The Quabbin Reservoir and the Lost Towns of the Swift River Valley
A reproducible, multi-layer R GIS study of the Quabbin Reservoir and the four Swift River Valley towns (Dana, Enfield, Greenwich, Prescott) disincorporated in 1938 to supply metropolitan Boston. The centerpiece is an interactive LiDAR imprint explorer — the drowned villages' street plans and cellar holes are still readable in 1 m bare-earth LiDAR on the land the water spared — alongside twenty figures: terrain, watershed, decennial census population, a valley cross-section, the aqueduct to Boston, and a schematic reservoir-filling animation. One R pipeline renders it all from open data.
My role
I designed the study, sourced the historical and modern spatial data, built the reproducible R pipeline, and developed the interactive LiDAR explorer.
Approach
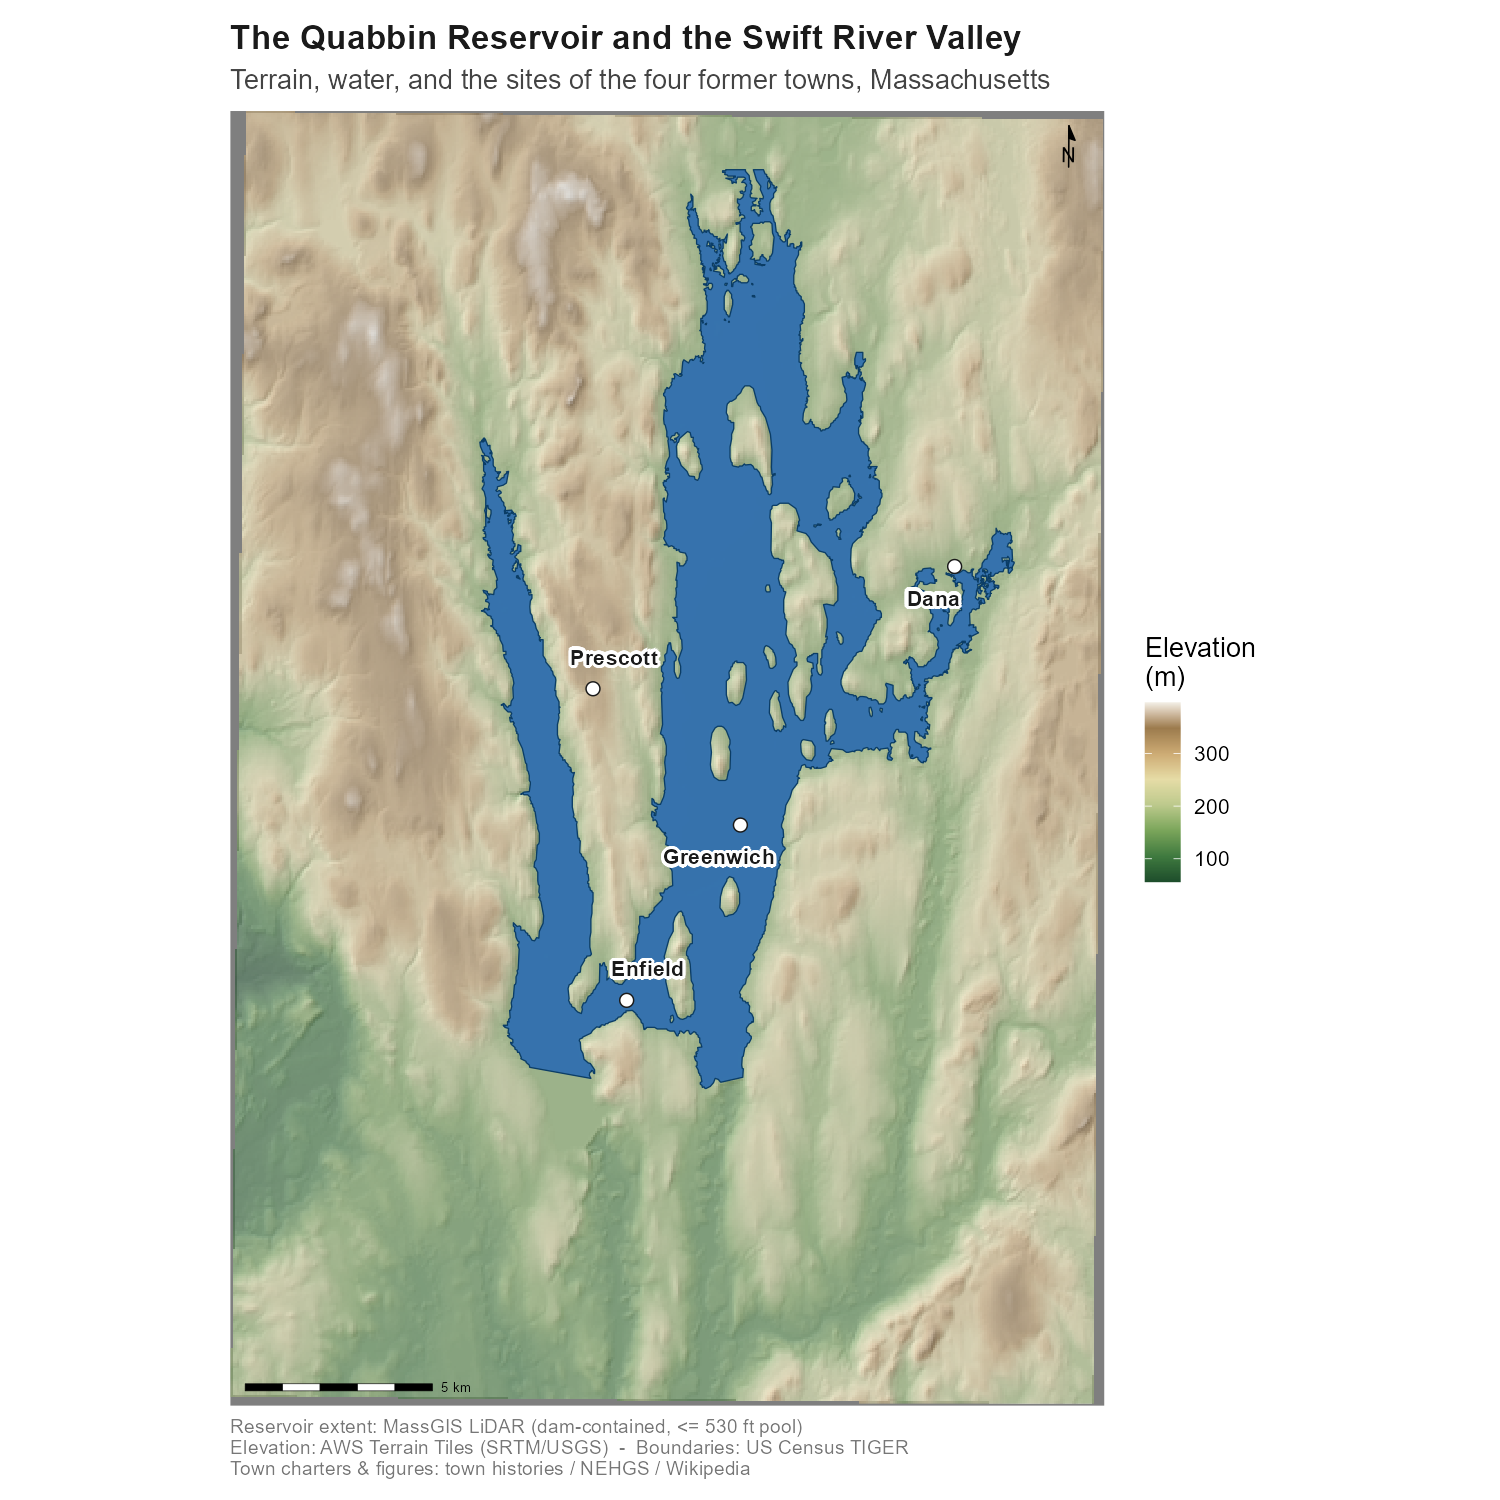
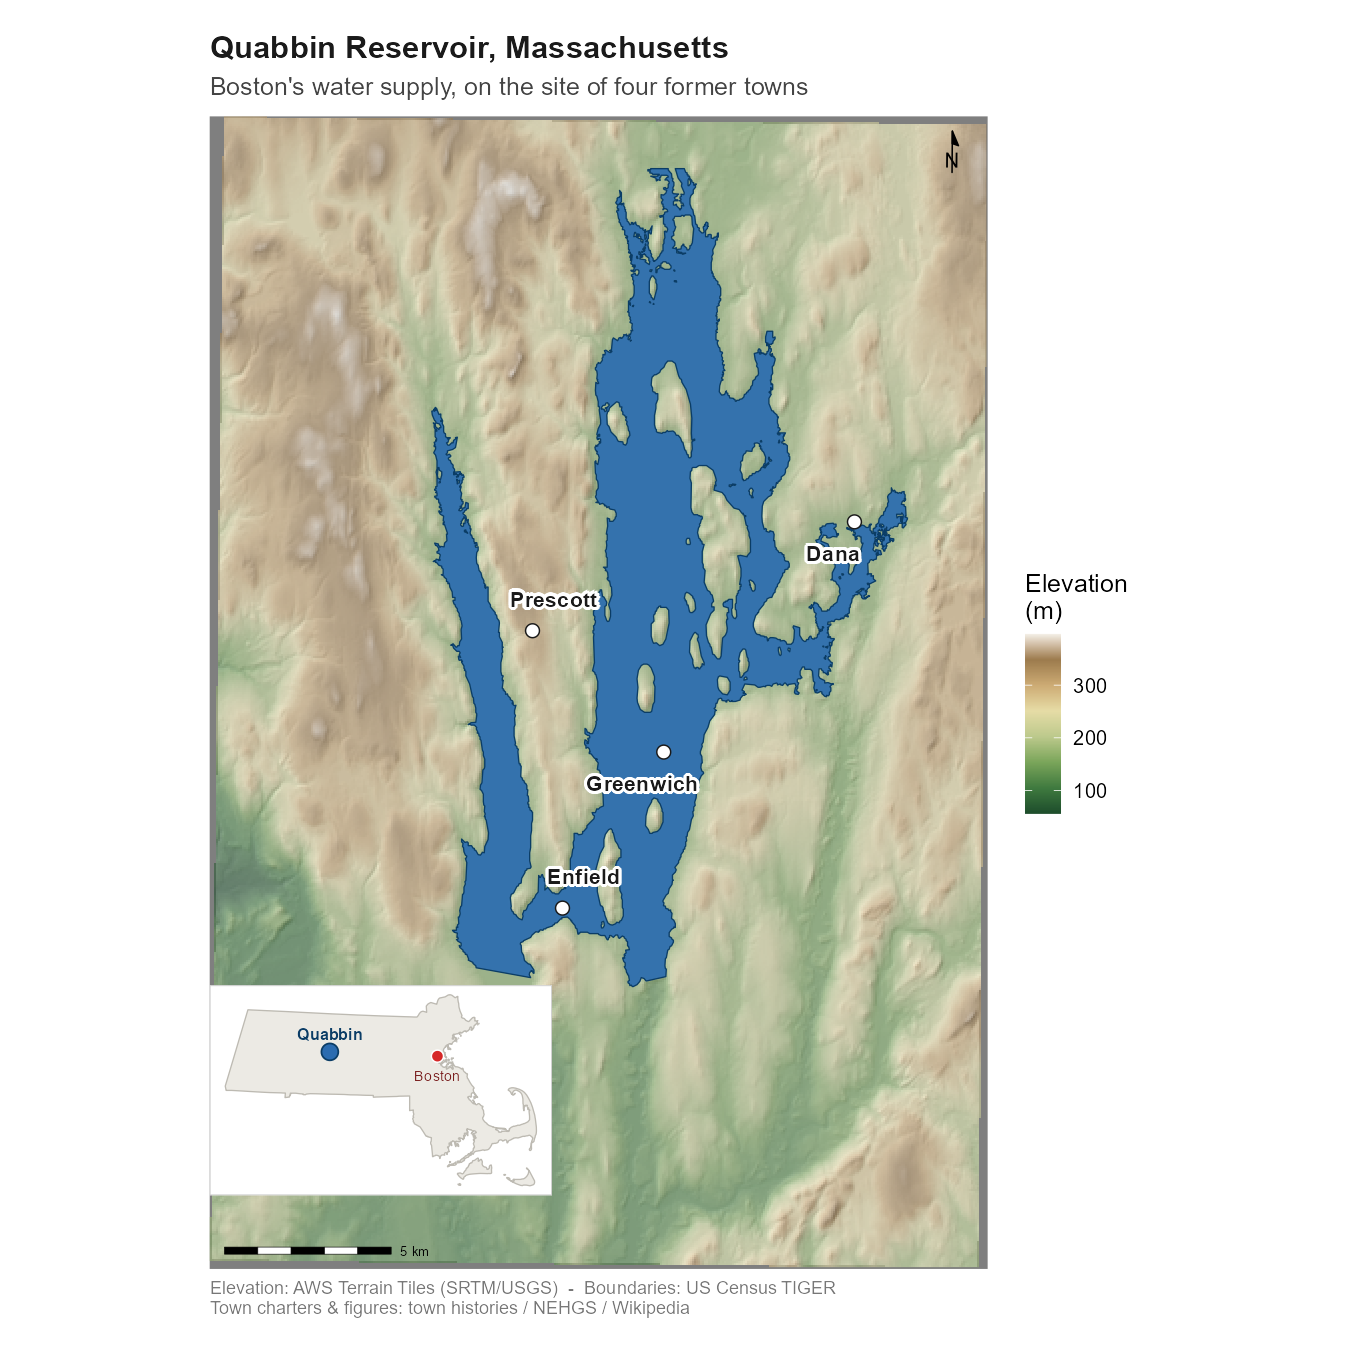
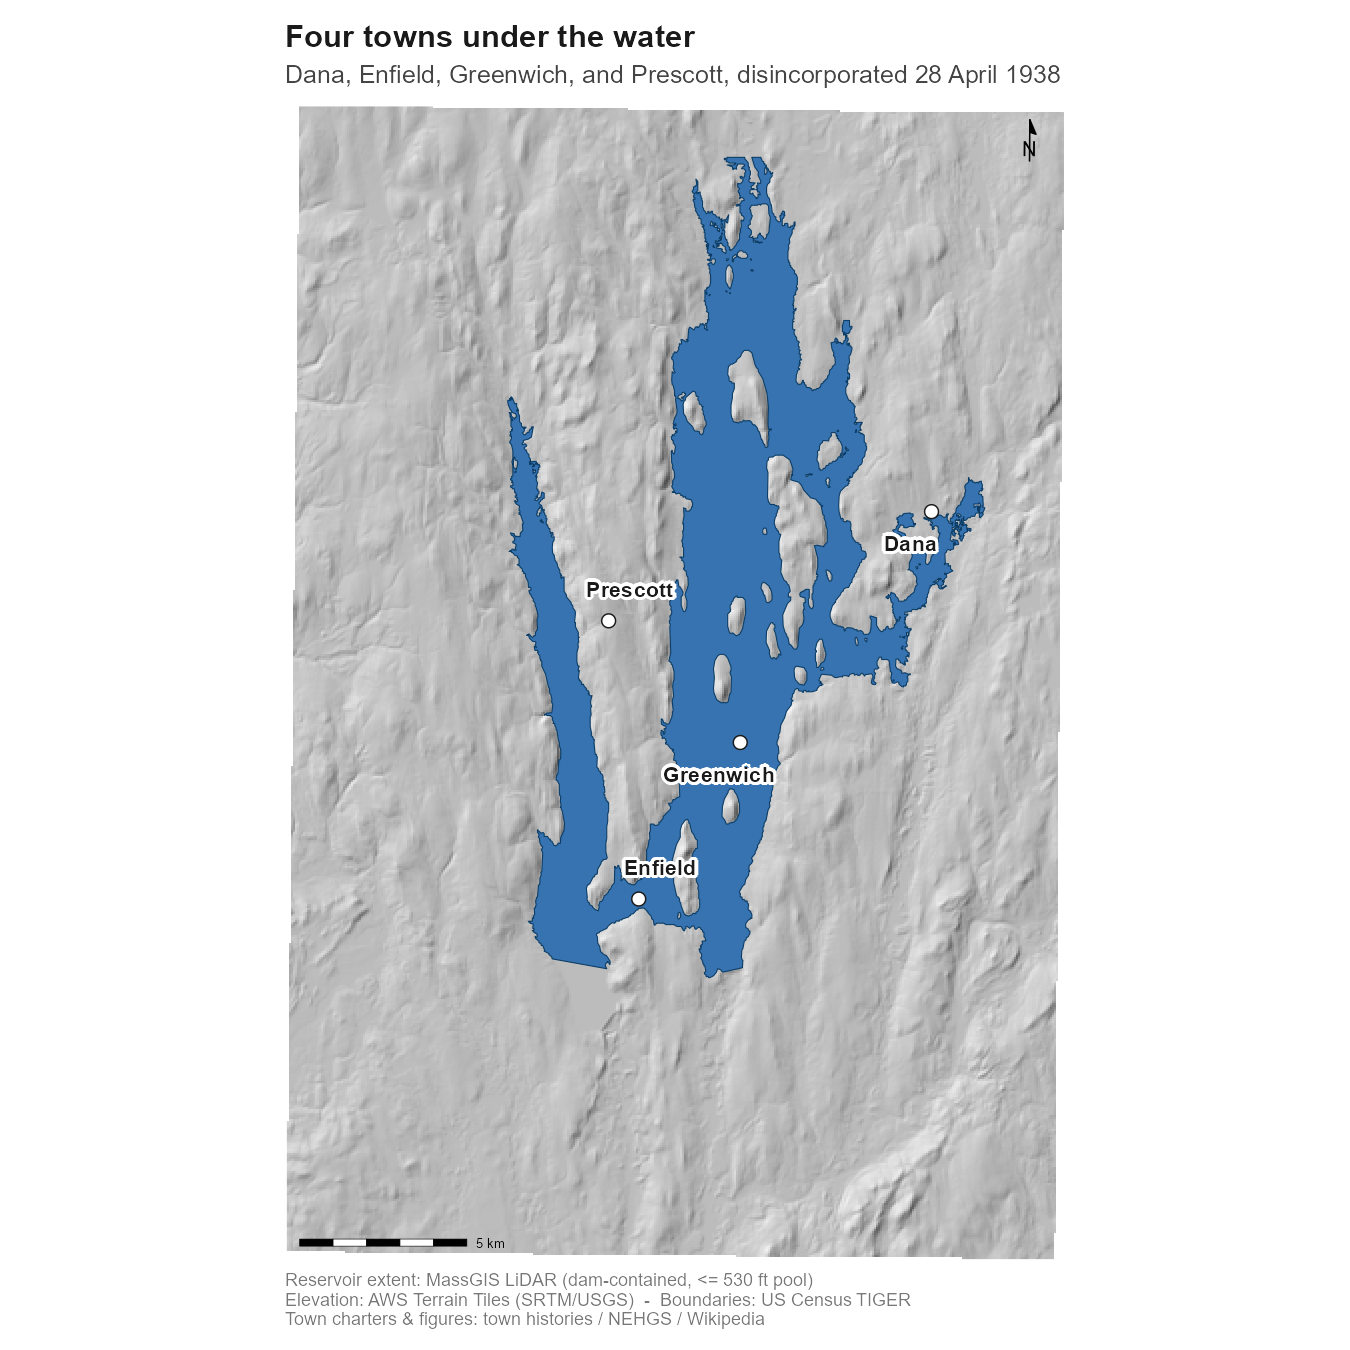
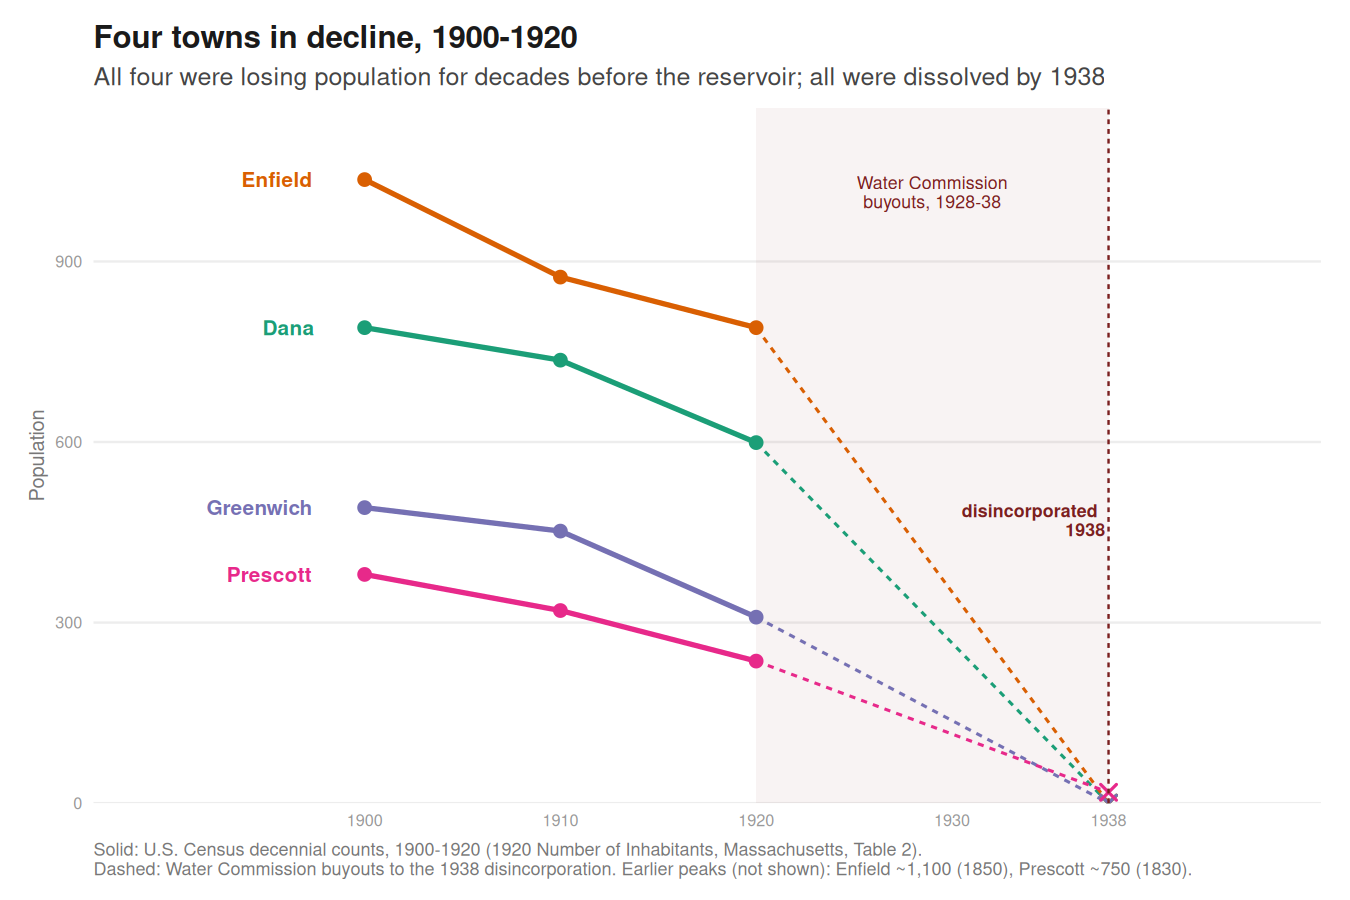
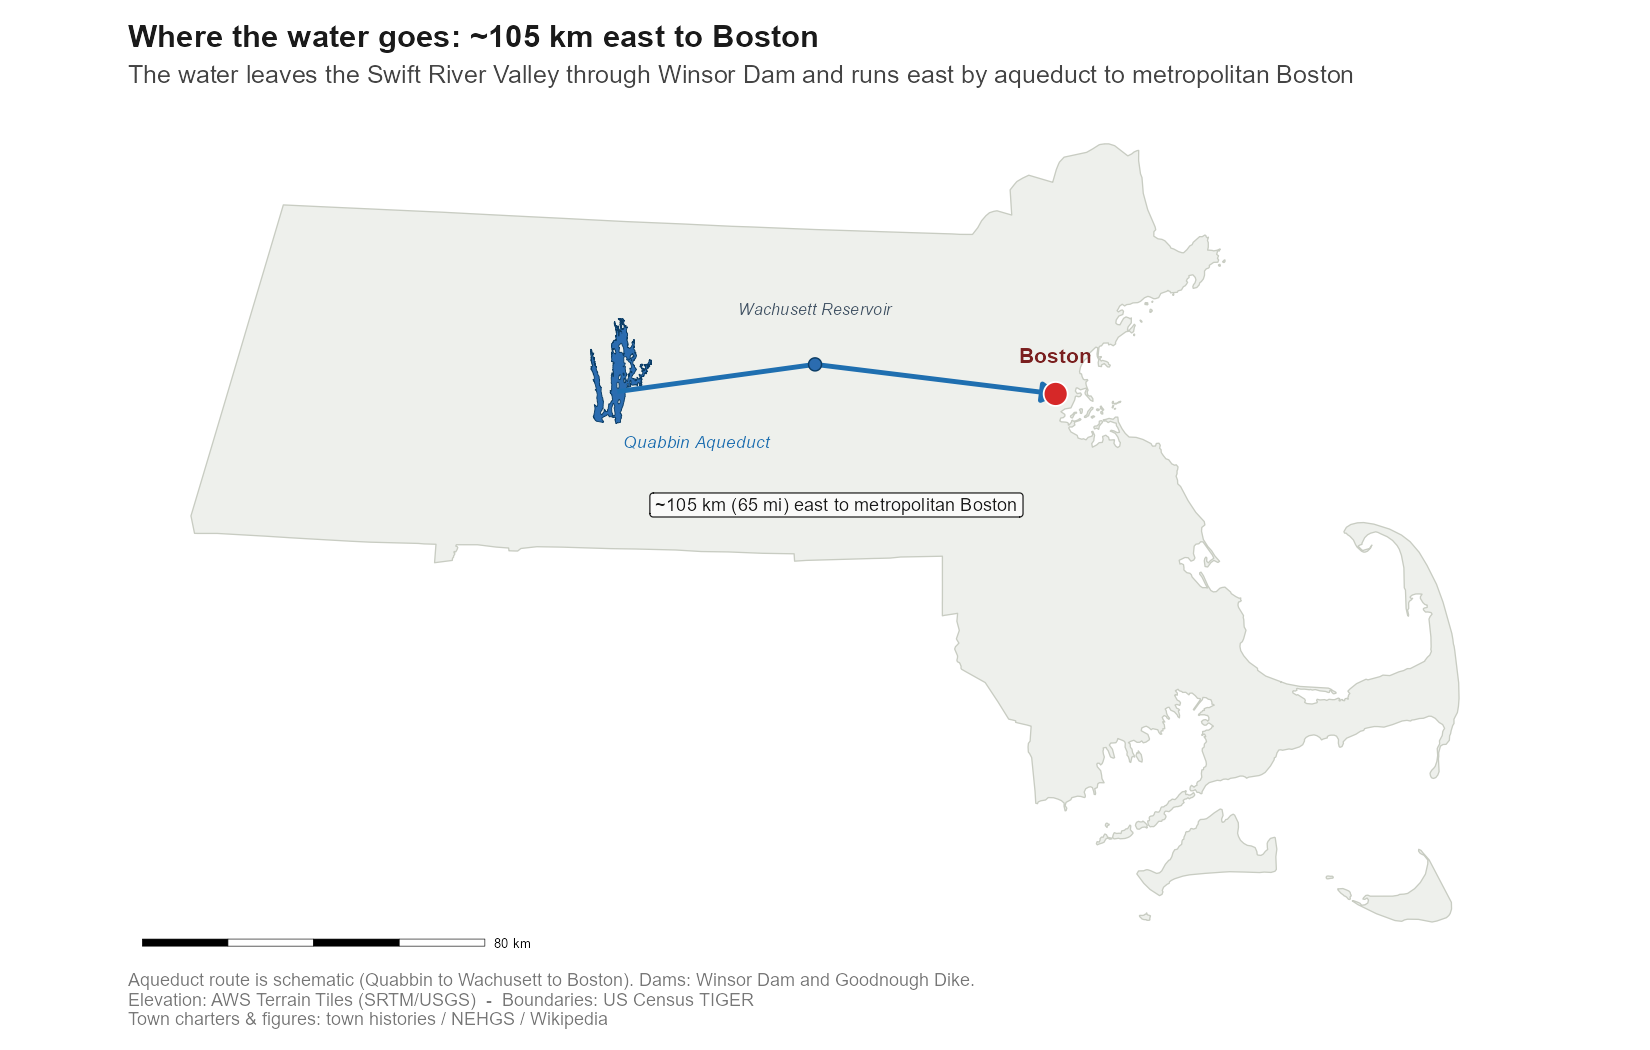
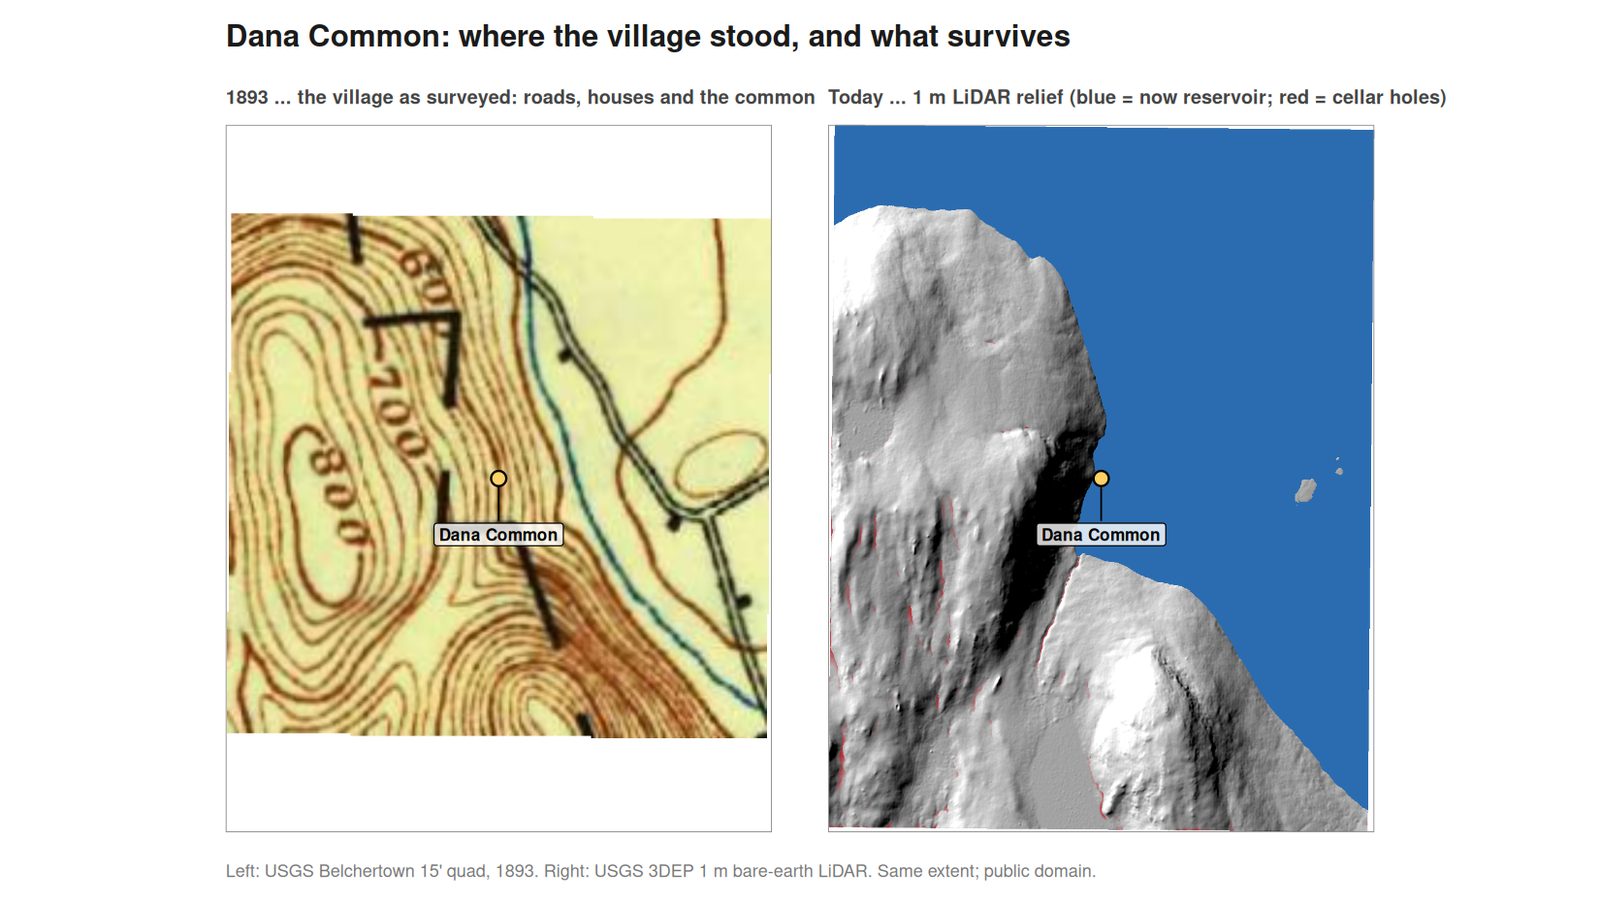
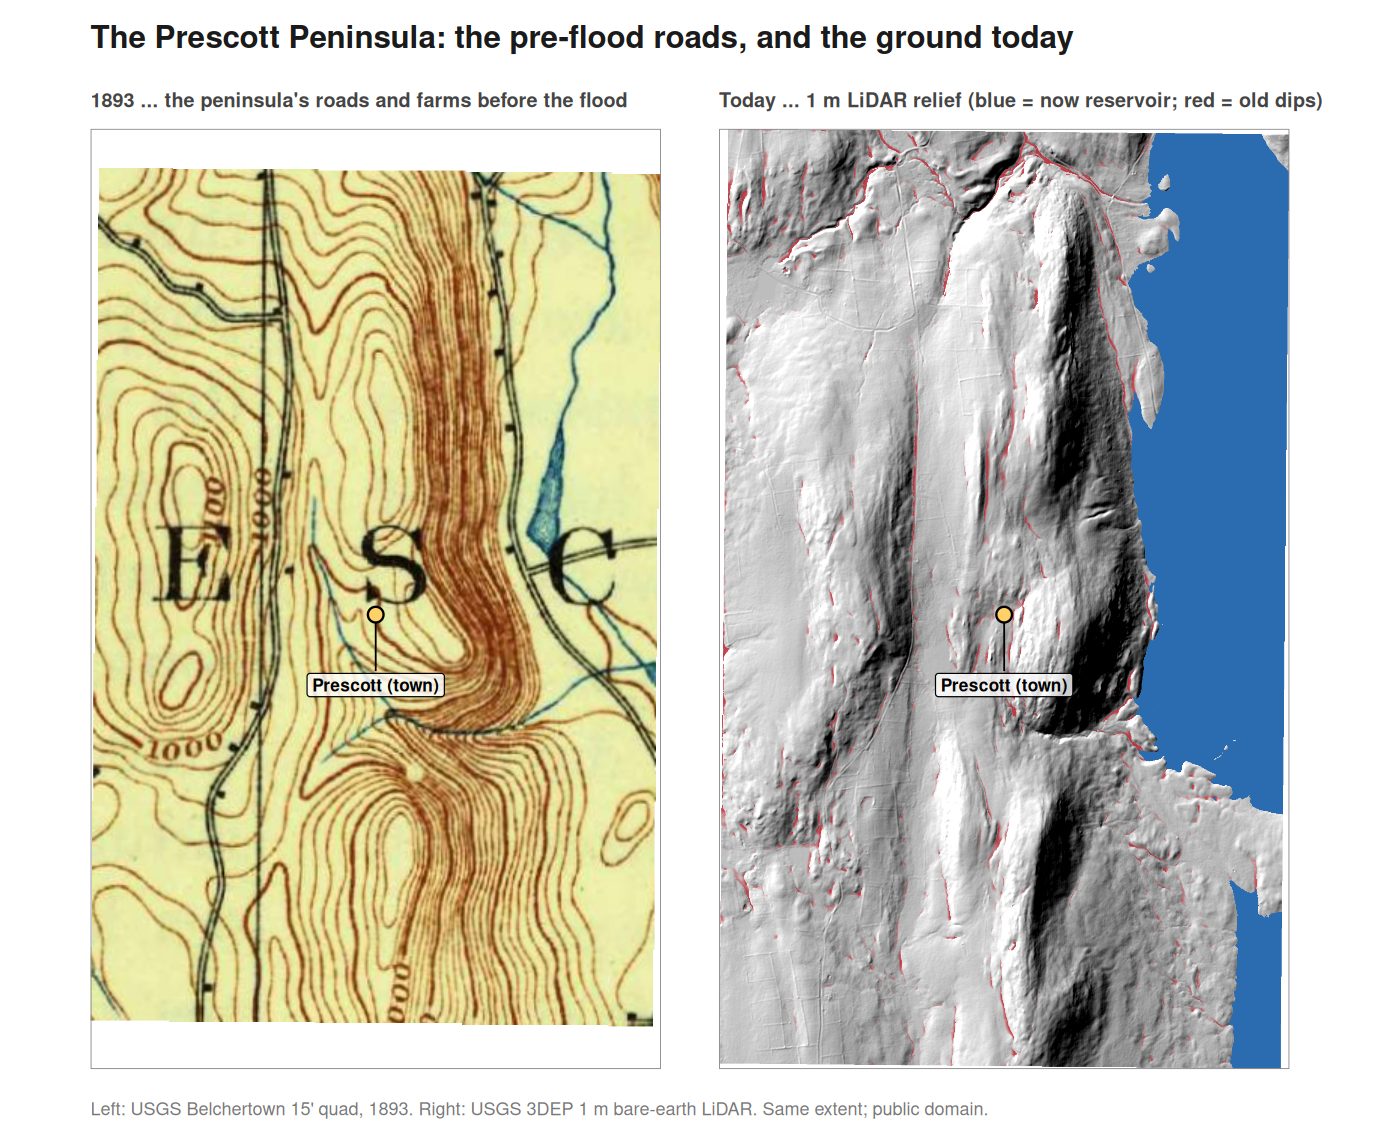
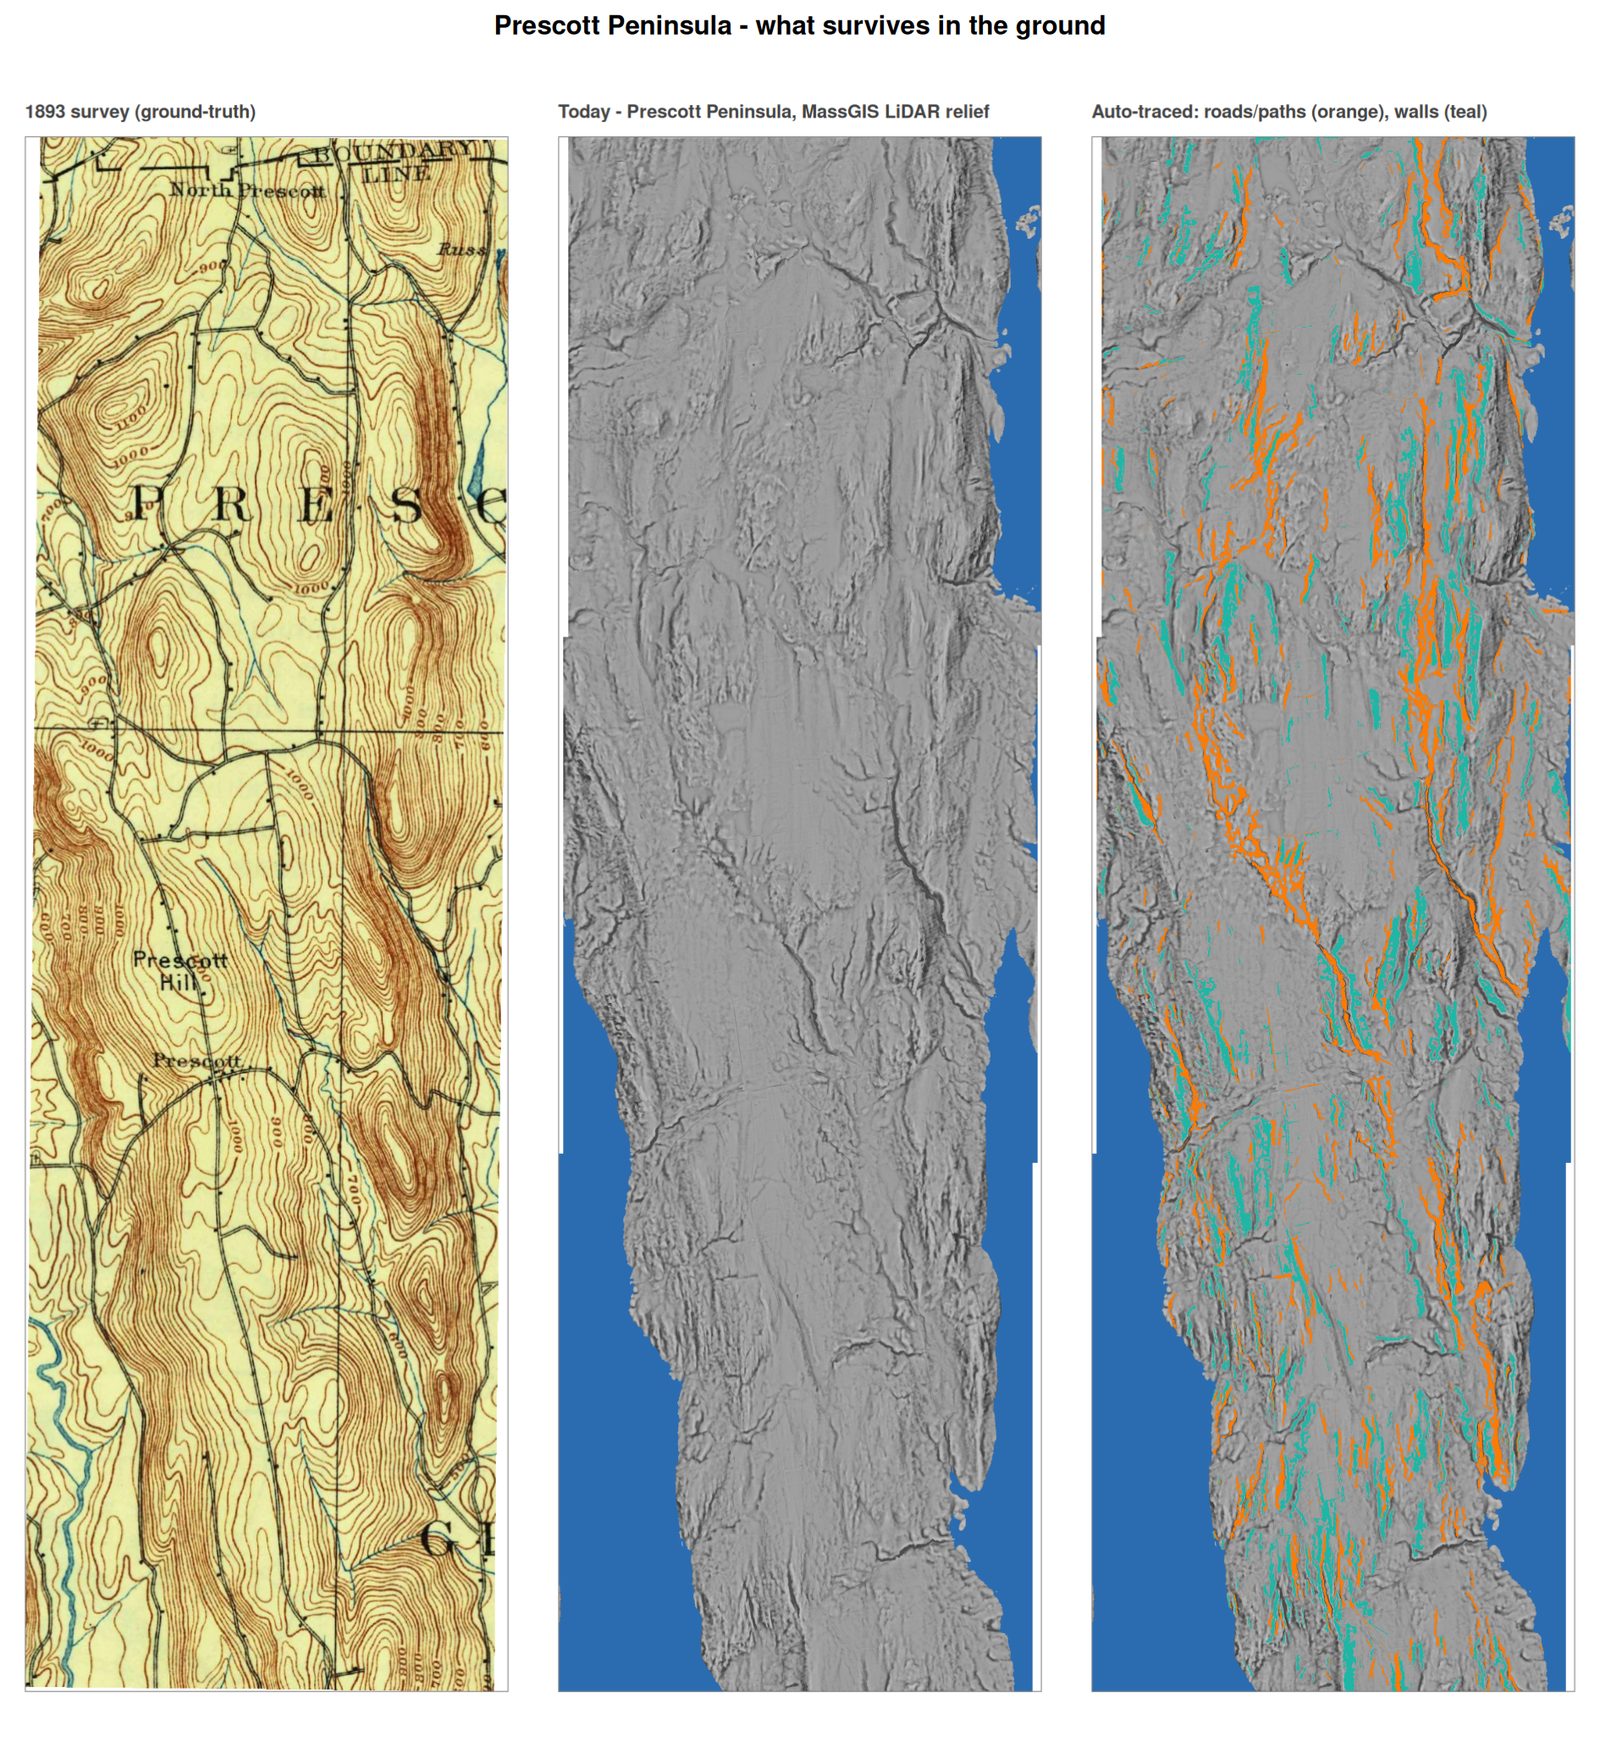
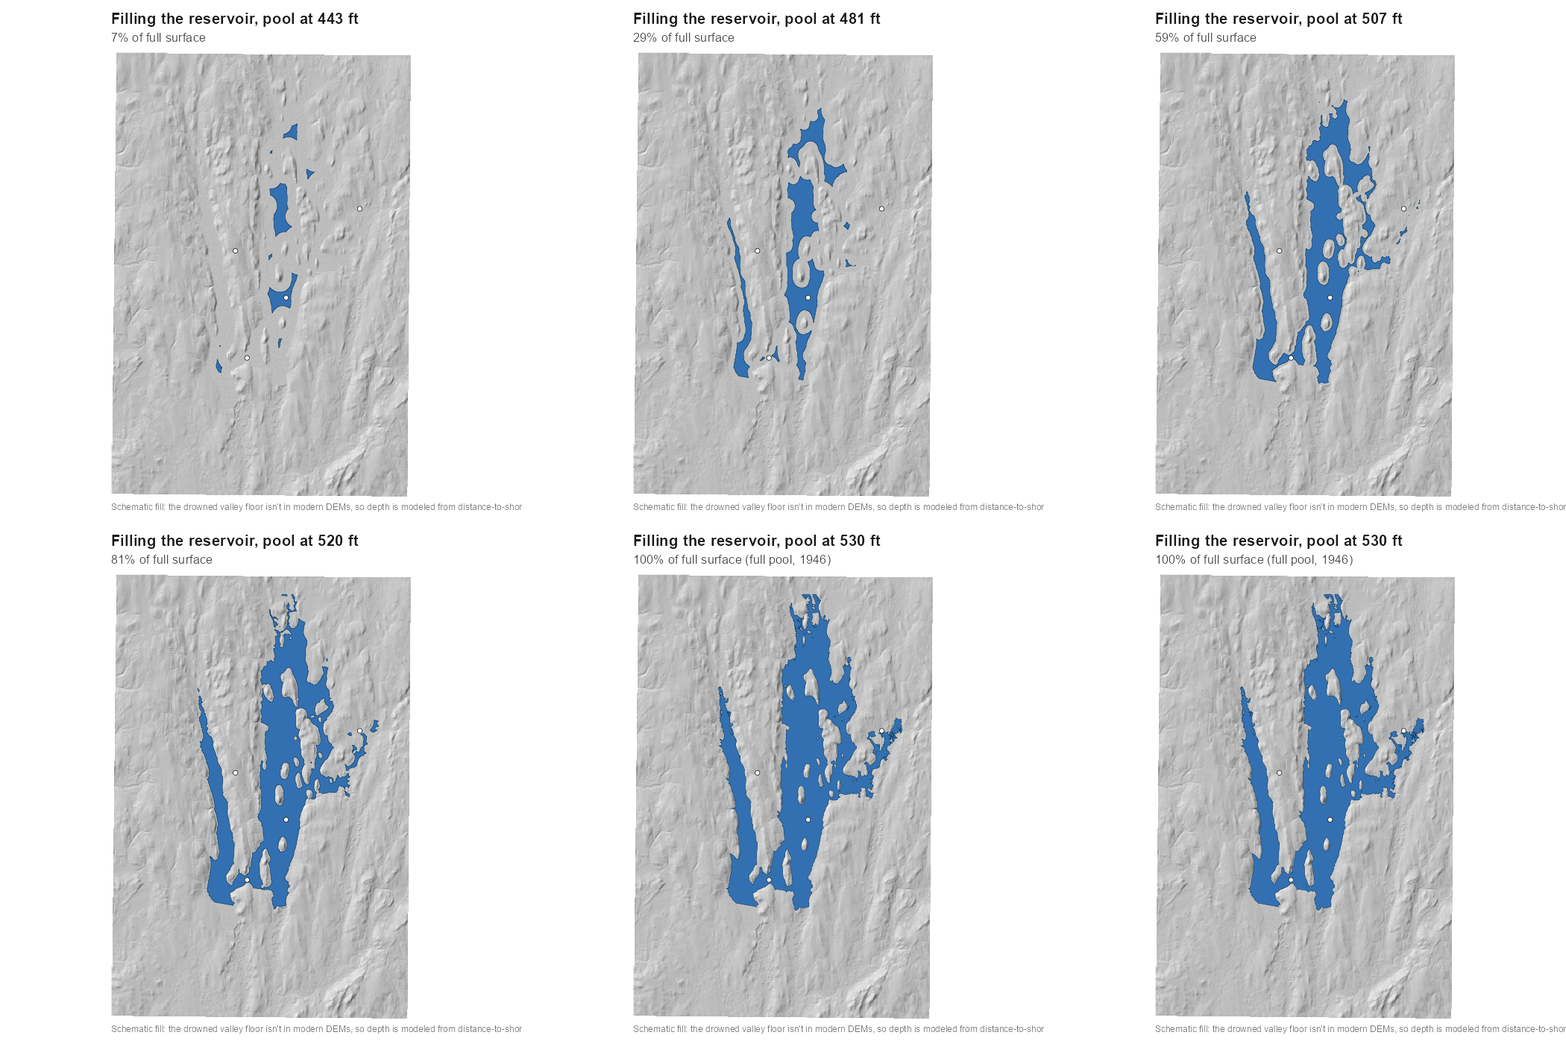
A multi-layer GIS study of how the Quabbin Reservoir was sited and what it replaced, built in R as a reproducible pipeline and shipped with its full analysis code. Between 1938 and 1946 Massachusetts dammed and flooded the Swift River Valley, disincorporating four towns — Dana, Enfield, Greenwich, and Prescott — and relocating about 2,500 residents to supply metropolitan Boston, roughly 105 km east. The pipeline pulls a DEM from AWS Terrain Tiles (elevatr), reprojects it to Massachusetts State Plane and hillshades it with terra; derives the reservoir from MassGIS LiDAR, which resolves the dams and keeps the water contained; adds USGS Watershed Boundary Dataset units for drainage context and US Census TIGER municipalities showing how the former town land is now divided among the surrounding towns. It also assembles decennial US Census counts (1900–1920) for all four towns; a schematic animation of the reservoir filling in equal-area stages to the 1946 full pool (a synthetic basin — modern DEMs capture only today's water surface, not the drowned valley floor); a west-east valley cross-section; a documented 'by the numbers' summary; a 3D terrain view; the aqueduct route carrying the water east to Boston; and MassGIS 1 m bare-earth LiDAR of Dana Common and the Prescott Peninsula, the areas that stayed above water, where the old roads, house lots and cellar holes are still imprinted in the ground — a Local Relief Model makes them readable, ground-truthed against the 1893 USGS survey. These come together in the interactive LiDAR imprint explorer: a full-reservoir 'LiDAR relief' layer for hunting the drowned villages' street plans, with auto-traced roads and walls, the 1893 quadrangle as a fade overlay, an adjustable pool level, per-town census popups, and the aqueduct route. Every layer comes from open data, each network fetch falls back to a documented default if a service is unavailable, and a single `Rscript run_all.R` regenerates the figures, the animation, and the GeoJSON the explorer consumes.
Result
One documented pipeline now regenerates the maps, figures, animation, and web layers while making the surviving landscape evidence readable to a general audience.
Figures