The Quabbin Reservoir and the Lost Towns of the Swift River Valley
Between 1938 and 1946, Massachusetts created the Quabbin Reservoir by damming and flooding the Swift River Valley. Four towns — Dana, Enfield, Greenwich, and Prescott — were disincorporated on 28 April 1938, and about 2,500 residents were relocated. The reservoir was built to supply metropolitan Boston, roughly 105 km (65 miles) to the east.
The centerpiece of the study is the LiDAR imprint explorer: the drowned villages' street plans, house-lot outlines and cellar-hole pits are still imprinted in the land the water spared — and still readable in 1 m bare-earth LiDAR. A “LiDAR relief” layer covers the whole reservoir with it, so you can pan across every acre, check each trace against the 1893 USGS survey, and raise the pool to see what drowned.
Around the explorer sits a multi-layer GIS study, built in R from open public data: terrain, the reservoir surface, the watershed, modern municipal boundaries, decennial US Census population for all four towns (1900–1920), a schematic animation of the reservoir filling to the 1946 full pool, the aqueduct route east to Boston, the valley's 1893 road network with the present reservoir overlaid to show which roads drowned, and 1 m LiDAR close-ups of Dana Common and the Prescott Peninsula, the village sites that stayed above water.
Read together, the layers show a valley whose terrain forms a natural basin, four towns that had been losing population for decades before construction, and a present-day map in which their land has been absorbed by the surrounding municipalities.
The analysis ships as a reproducible pipeline. A single Rscript run_all.R pulls a DEM from AWS Terrain Tiles, derives the reservoir from MassGIS LiDAR (which resolves the dams, keeping the water contained), fetches USGS watershed units and US Census boundaries, renders the twenty figures below, generates the schematic filling animation, and exports the GeoJSON the explorer consumes. Downloads are cached, and each network call falls back to a documented default if a service is unavailable.
Filling the reservoir, 1939–1946
After Winsor Dam was closed in 1939, the Swift River backed up for seven years, reaching the 530-foot full pool in 1946. The animation below raises the water in equal-area stages over a schematic synthetic basin — an illustration of the sequence, not surveyed bathymetry, because modern DEMs capture only today's water surface, not the drowned valley floor. In the LiDAR imprint explorer you can drag the pool level yourself and watch the village sites slip under.
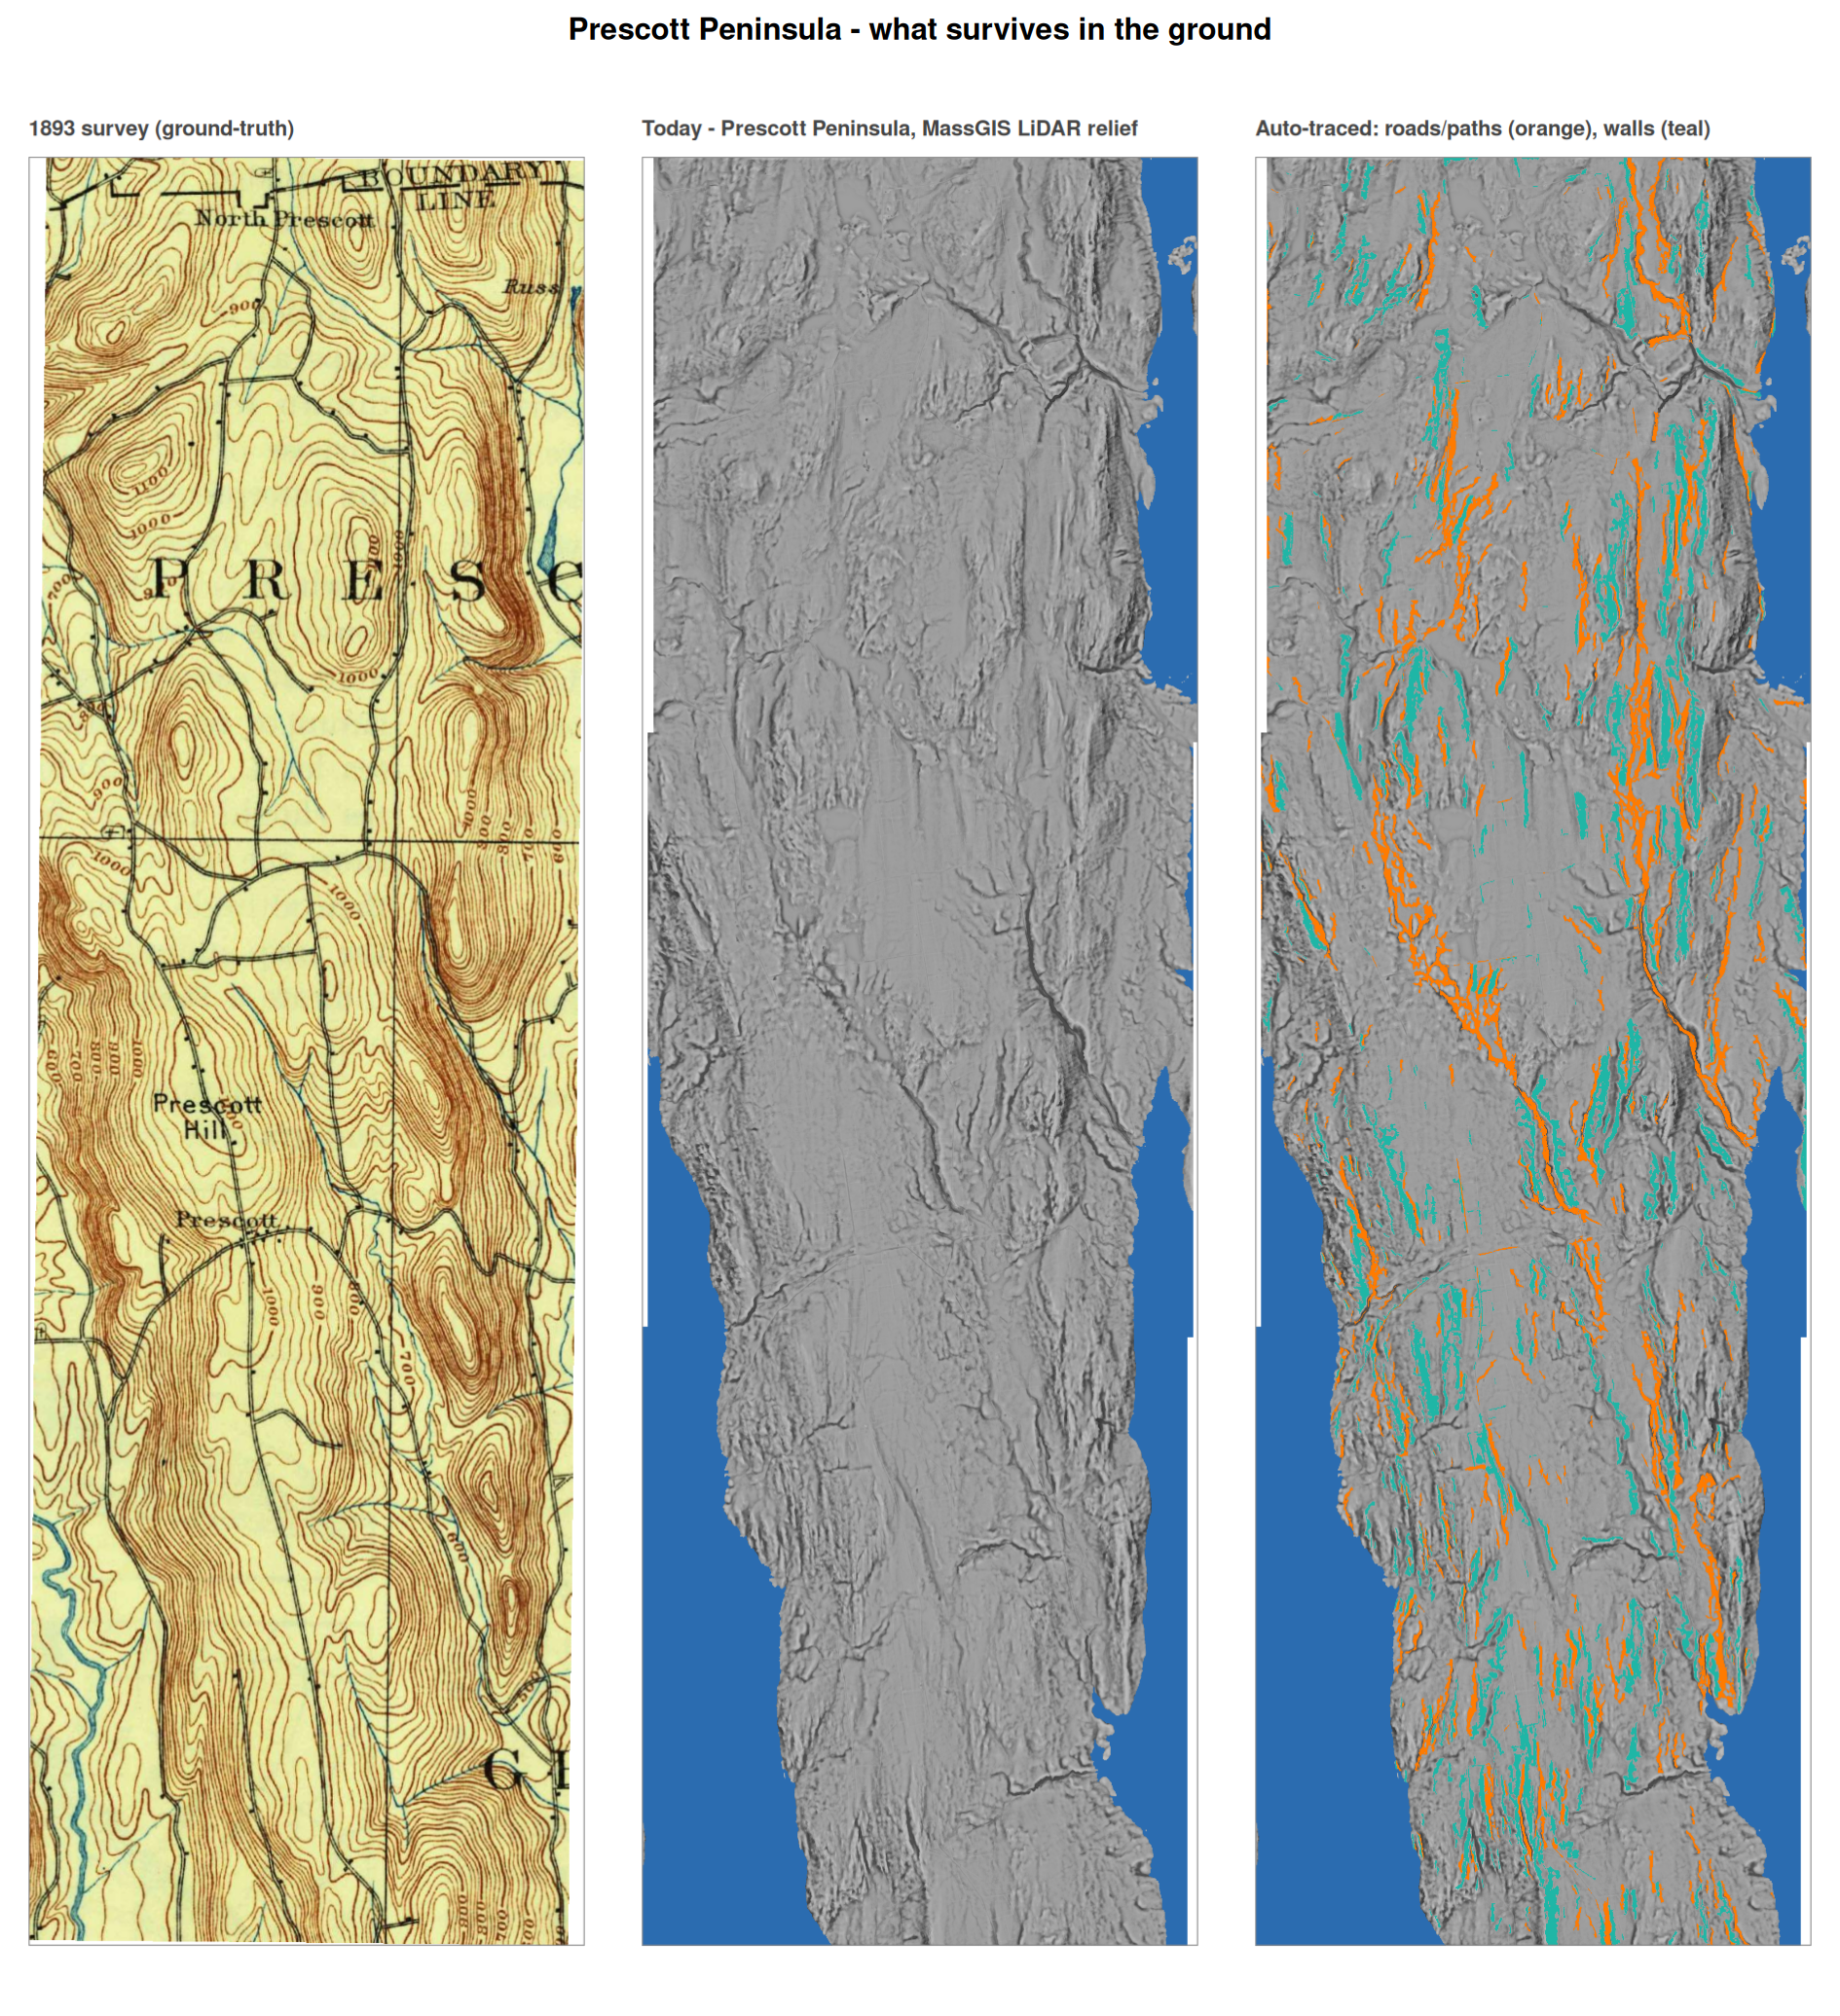
Reading the villages in bare-earth LiDAR
On the land the water spared — Dana Common, the Prescott Peninsula, Enfield's dry south — the old roads, house lots and cellar holes were never built over, so they are still physically imprinted in the ground. MassGIS 1 m bare-earth LiDAR strips away the forest, and a Local Relief Model removes the broad terrain so those subtle features stand out as readable lines and pits. Every trace is ground-truthed against the 1893 USGS topographic survey of the valley. Below, the whole Prescott Peninsula: the 1893 survey beside today's LiDAR relief and the auto-traced roads and walls.