Salem Pantry: Mapping Food Access
Analyzed 150,000 rows of client data for the Salem Pantry using R — identified underserved areas and used random forest modeling to find similar populations statewide.
My role
As part of a graduate team, I helped clean and analyze more than 150,000 client records, map coverage gaps, and compare similar communities across Massachusetts.
Approach
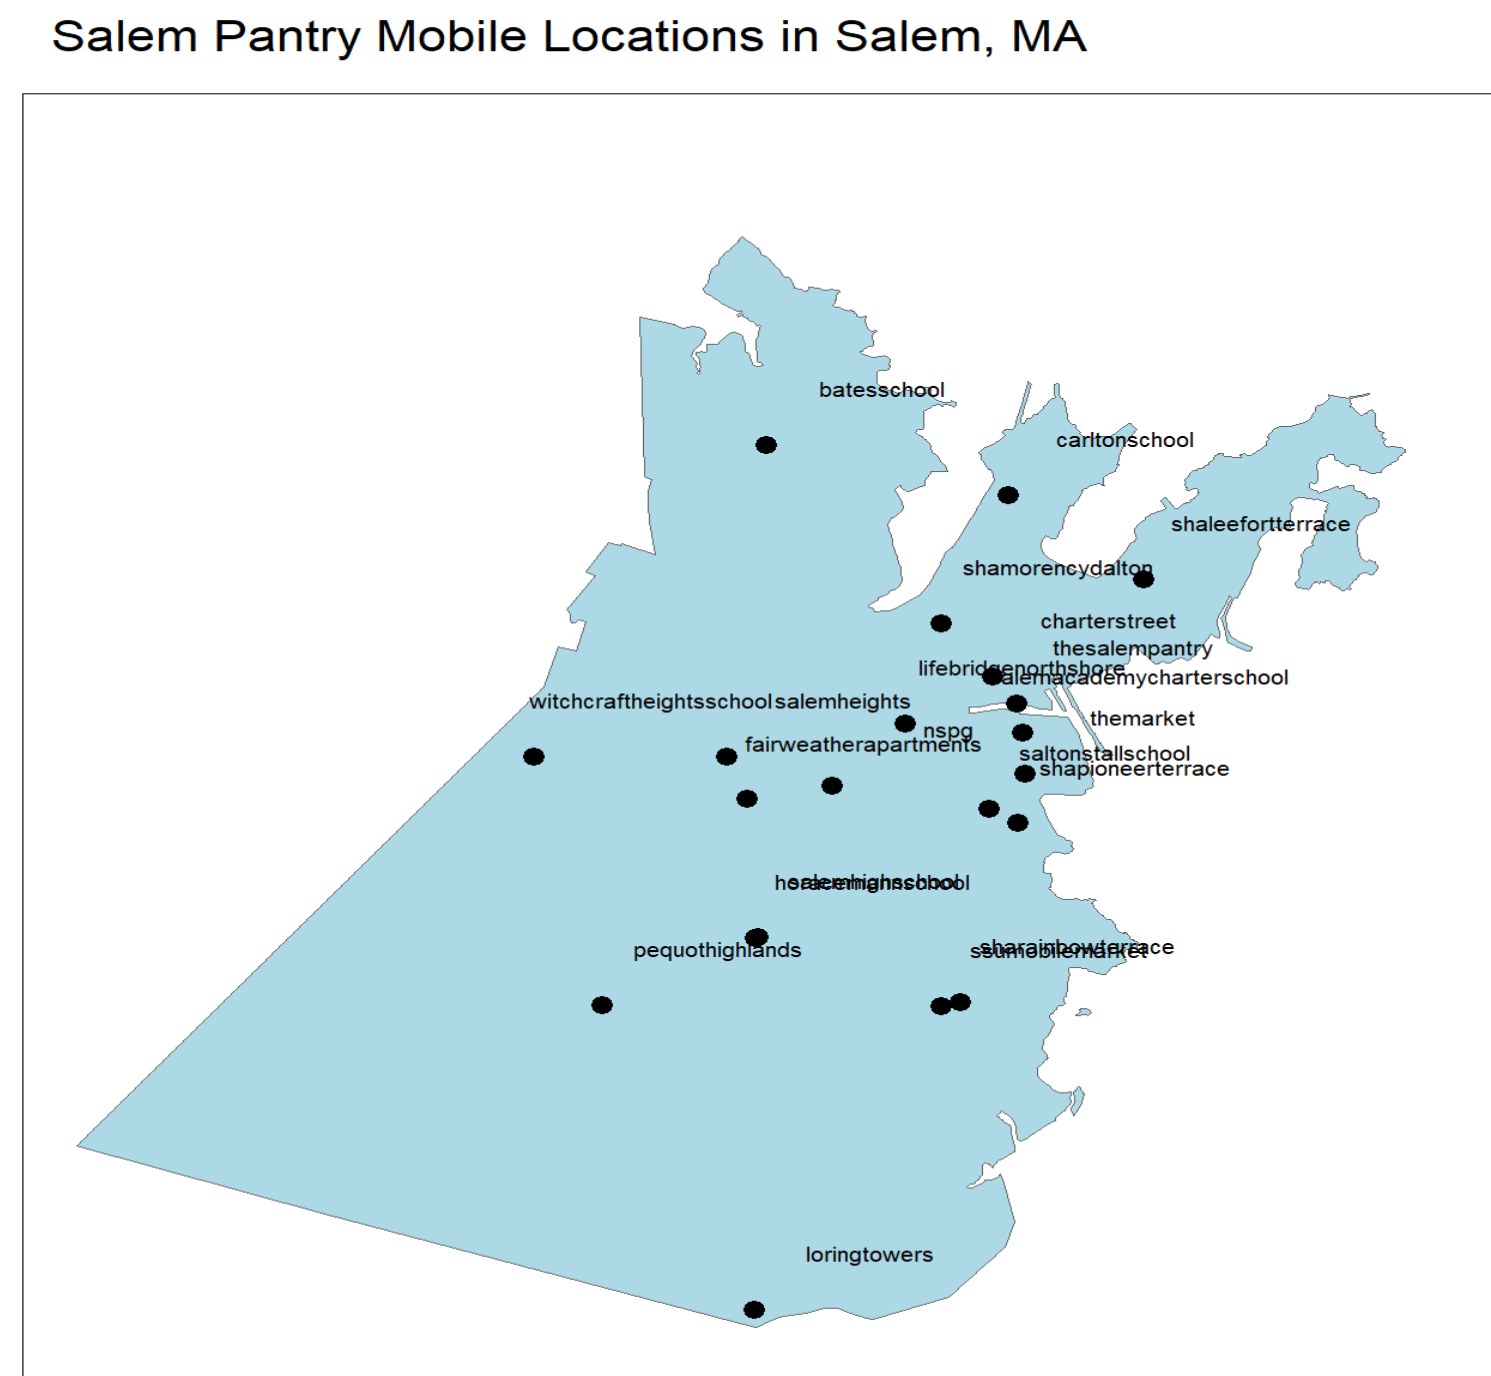
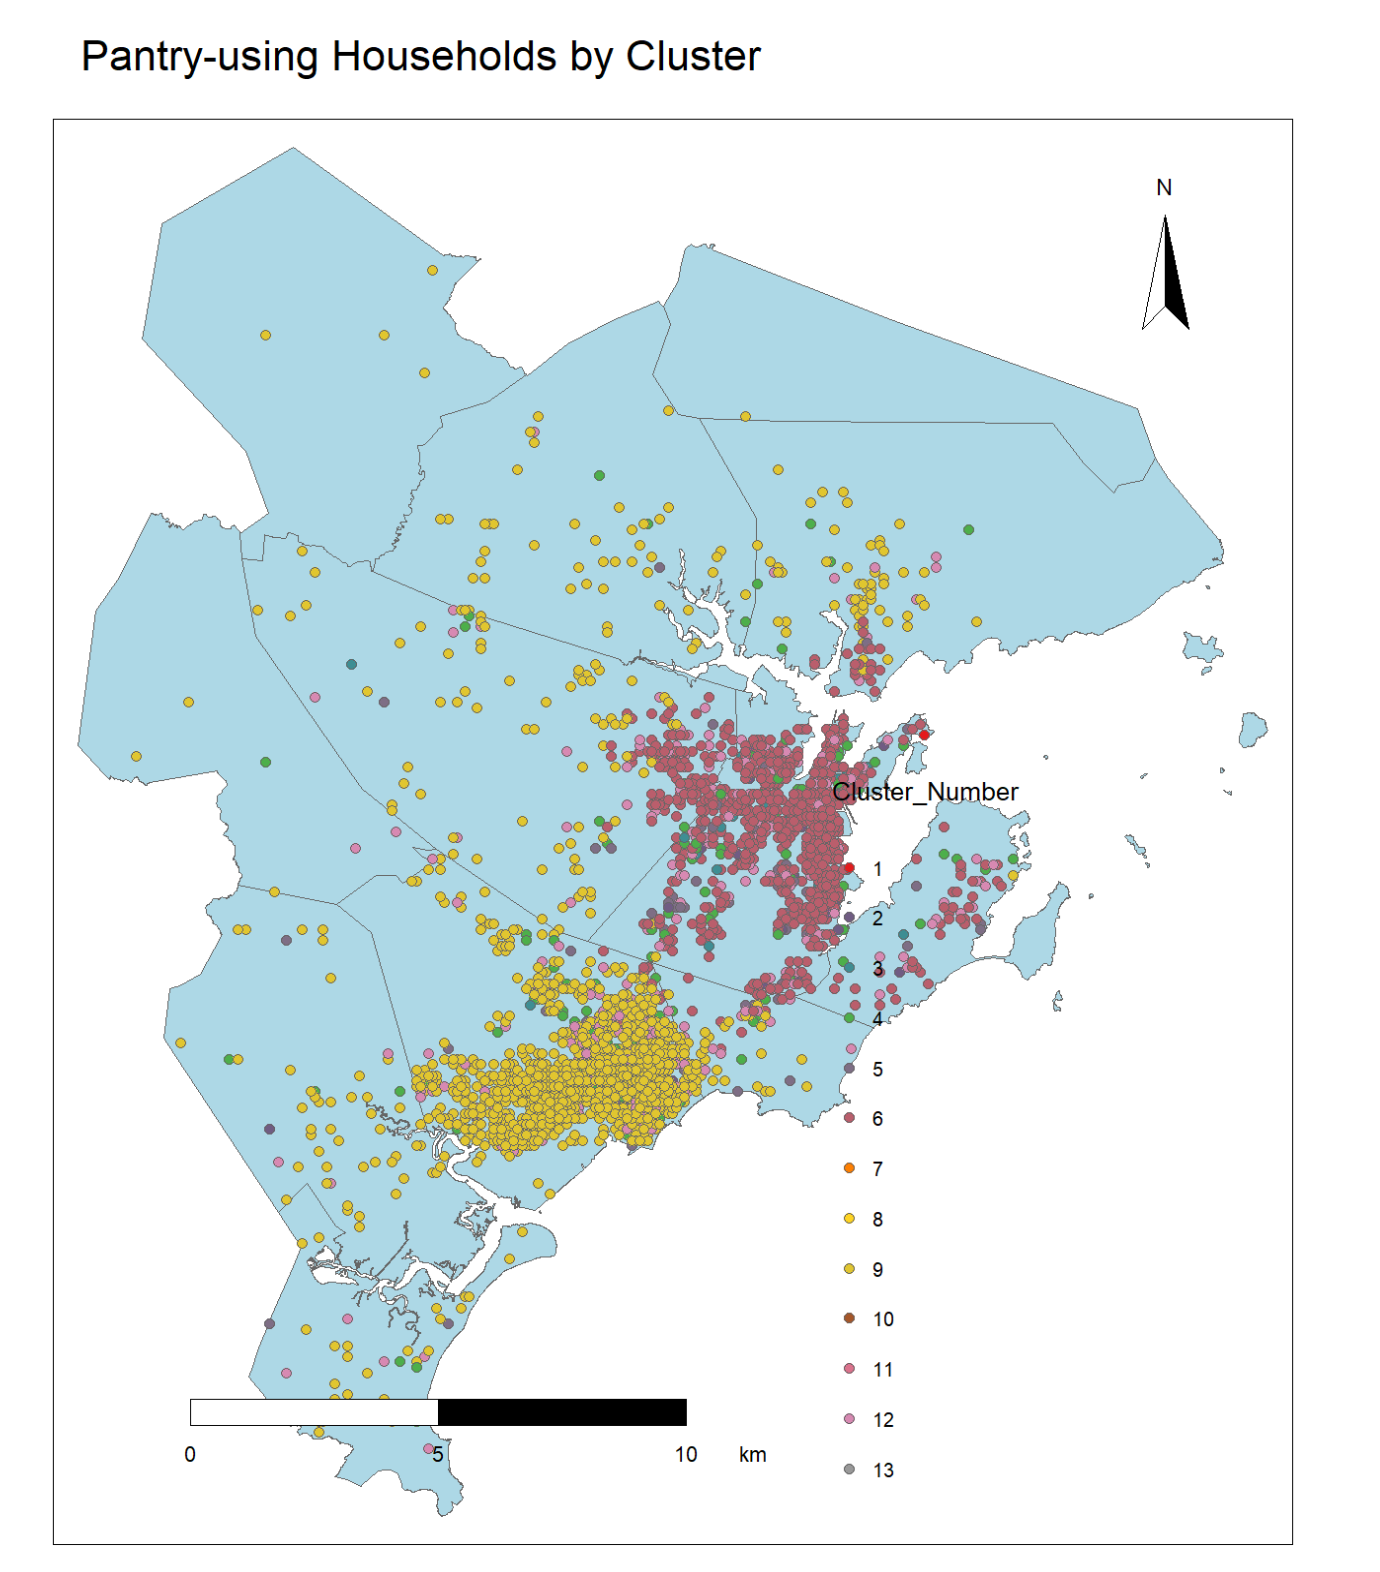
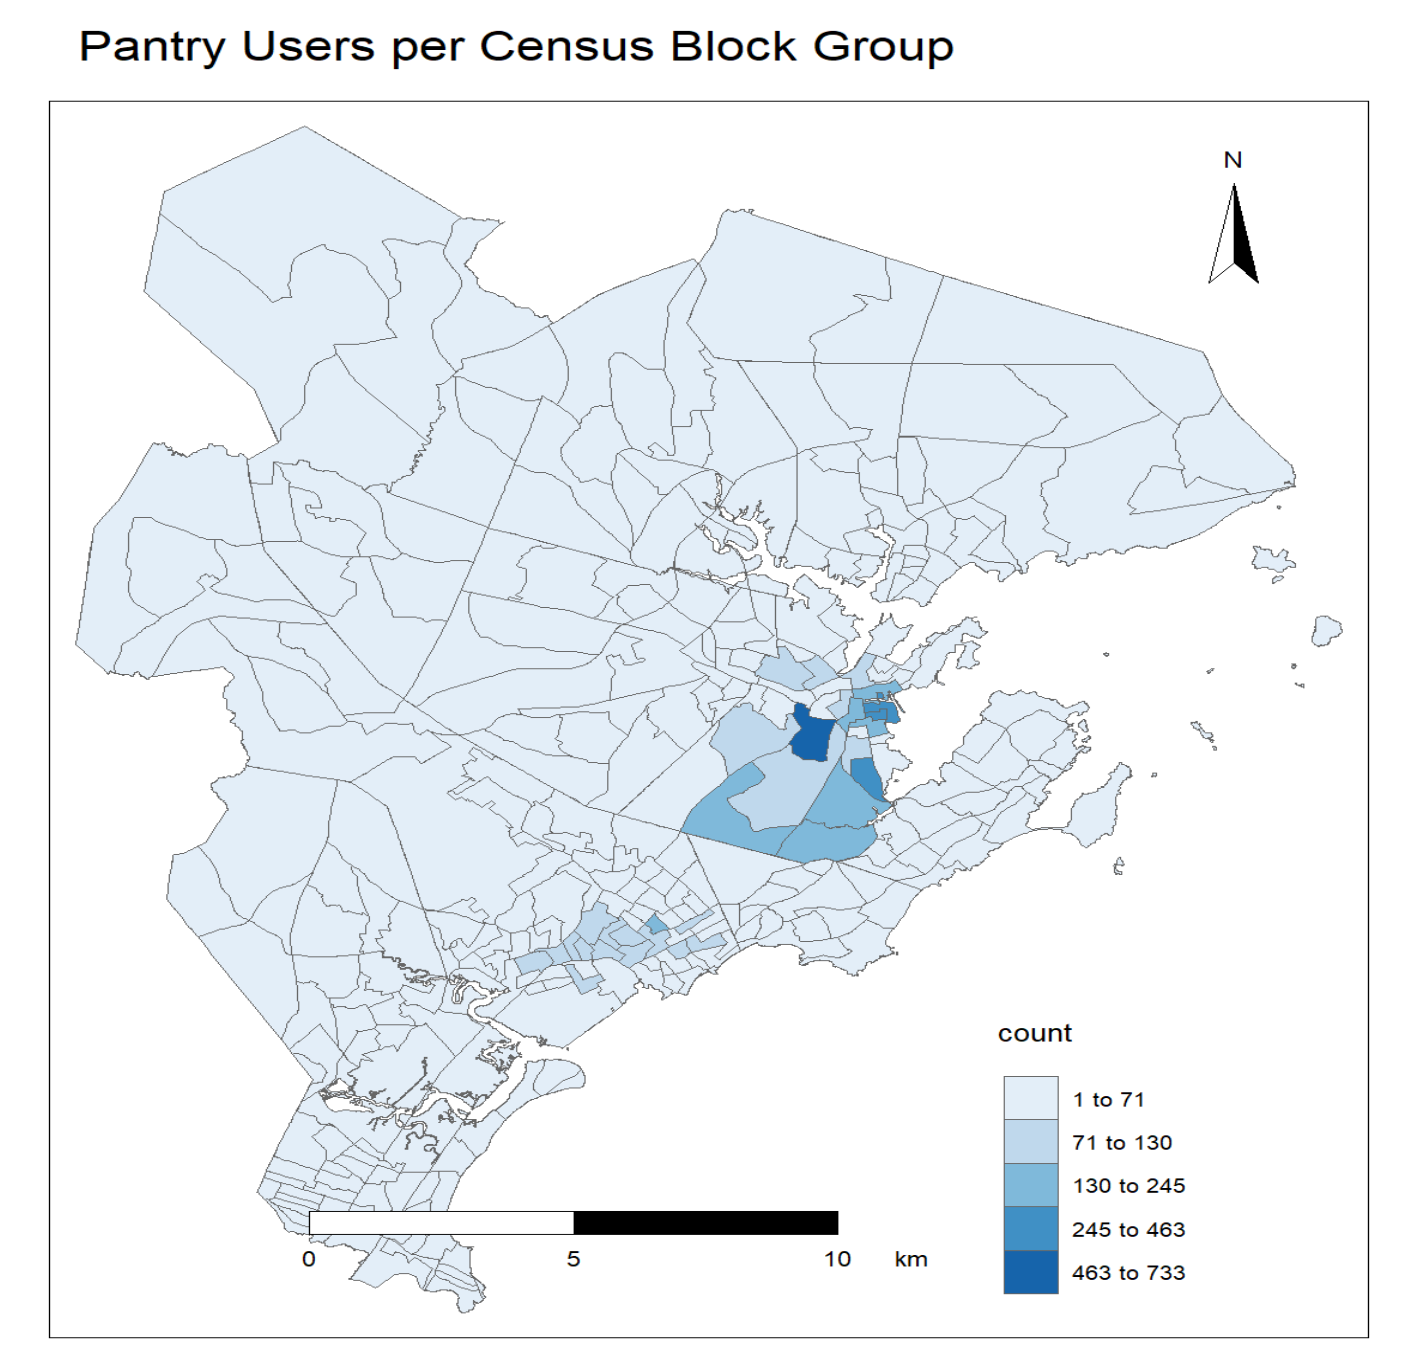
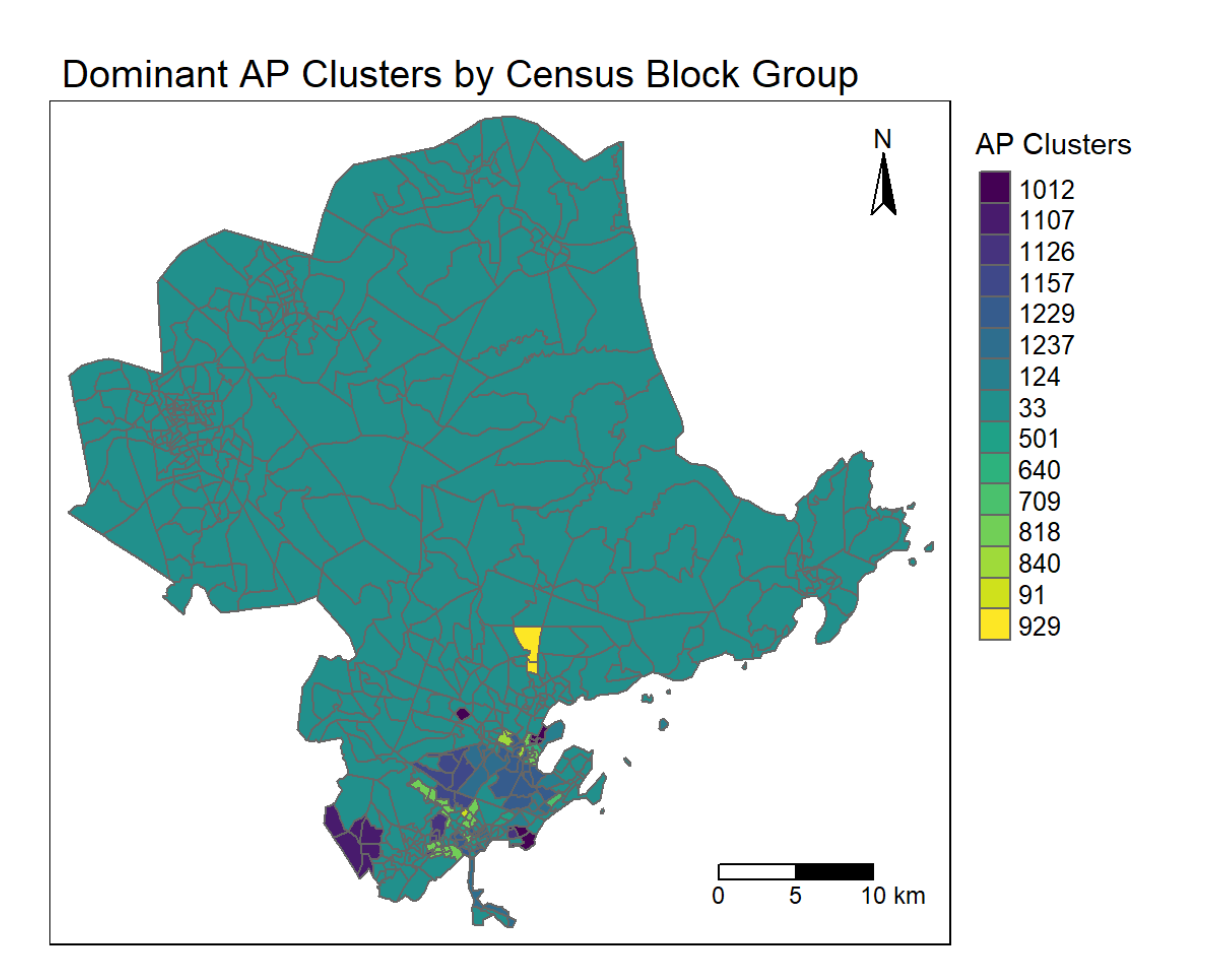
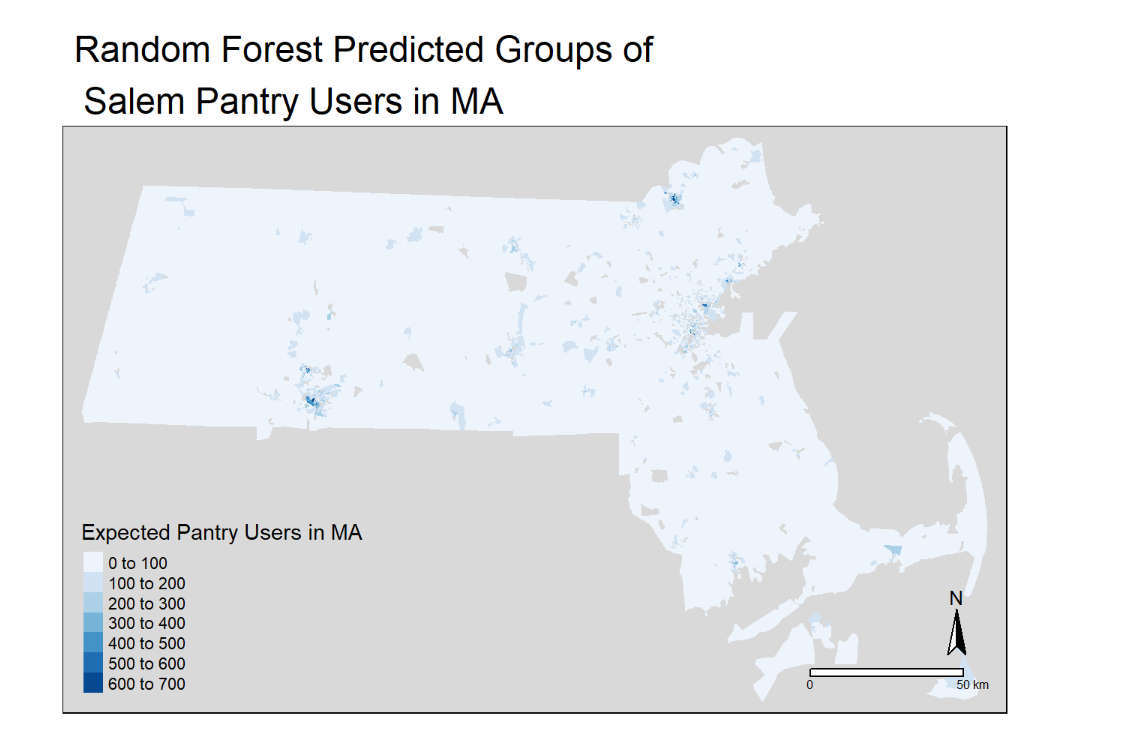
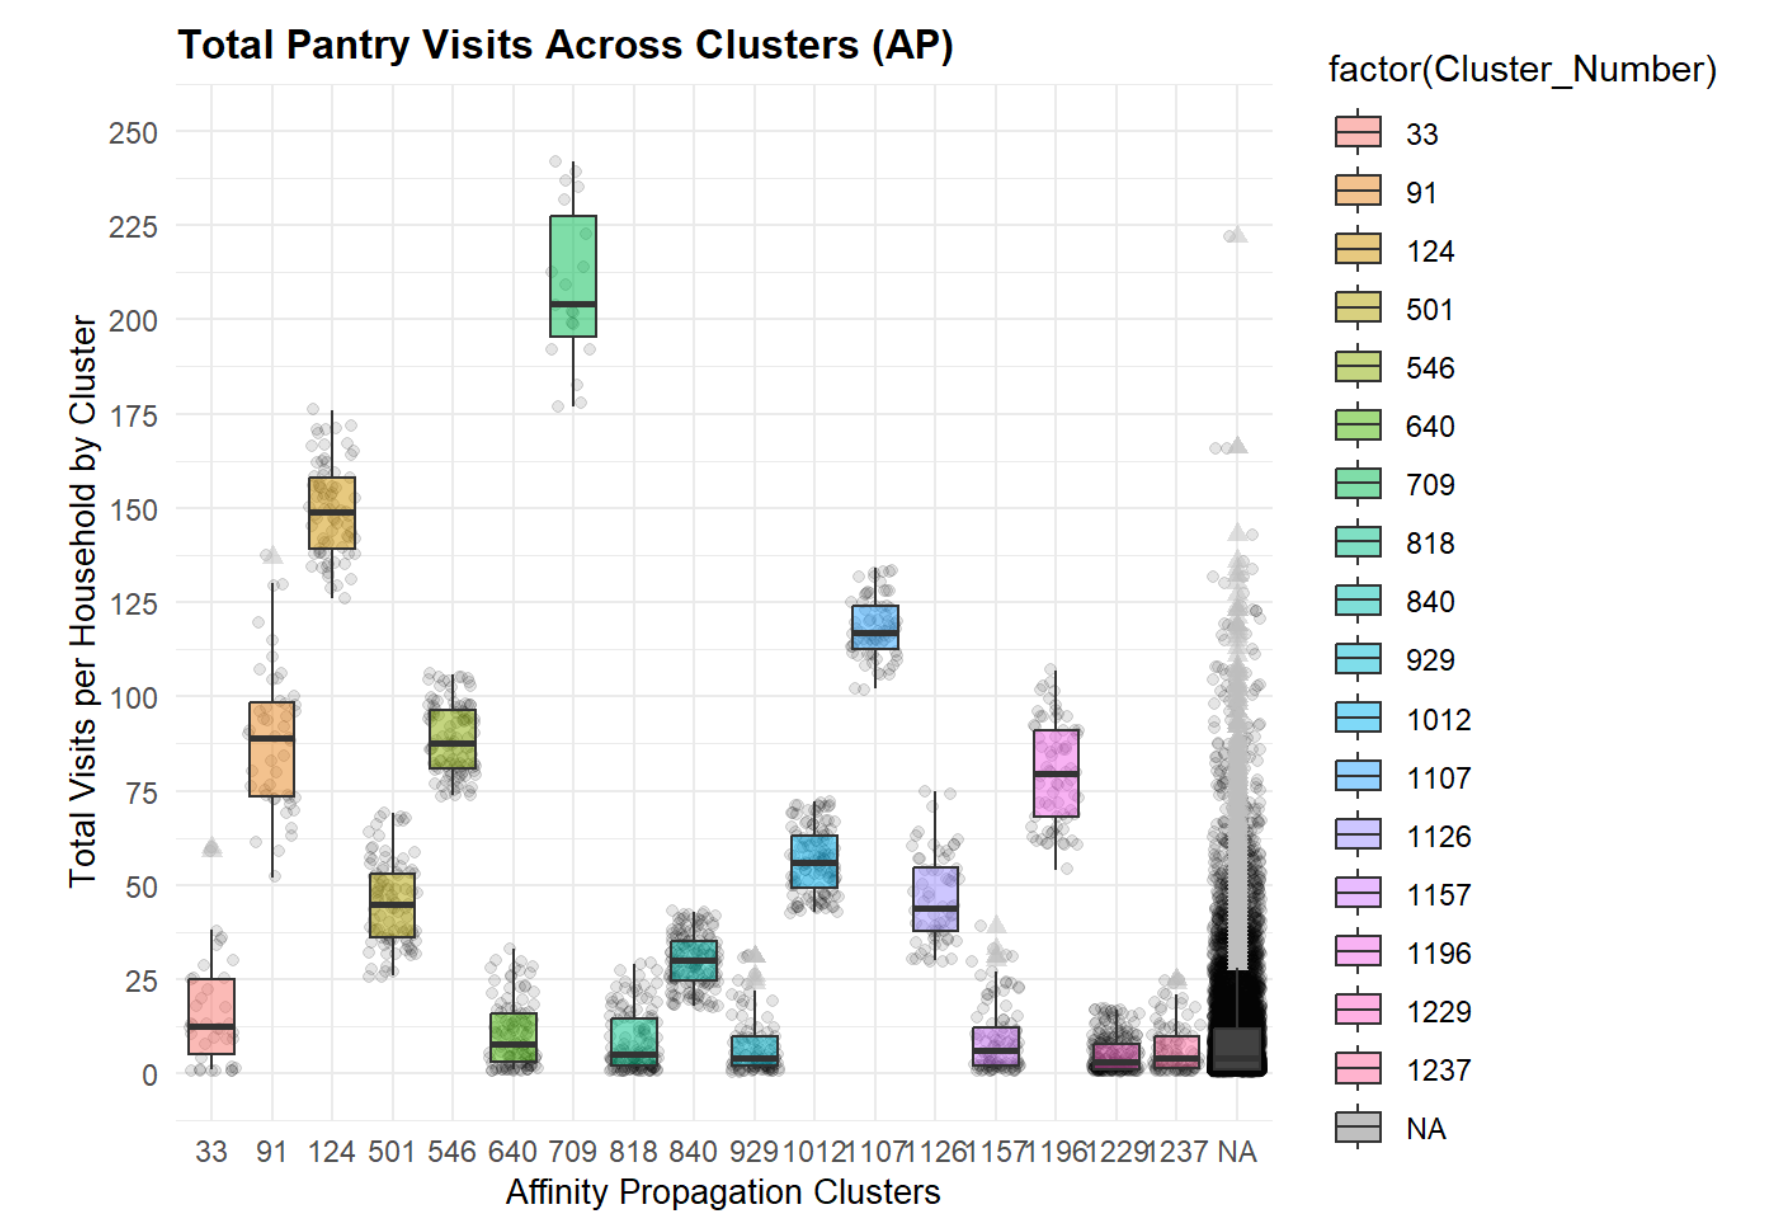
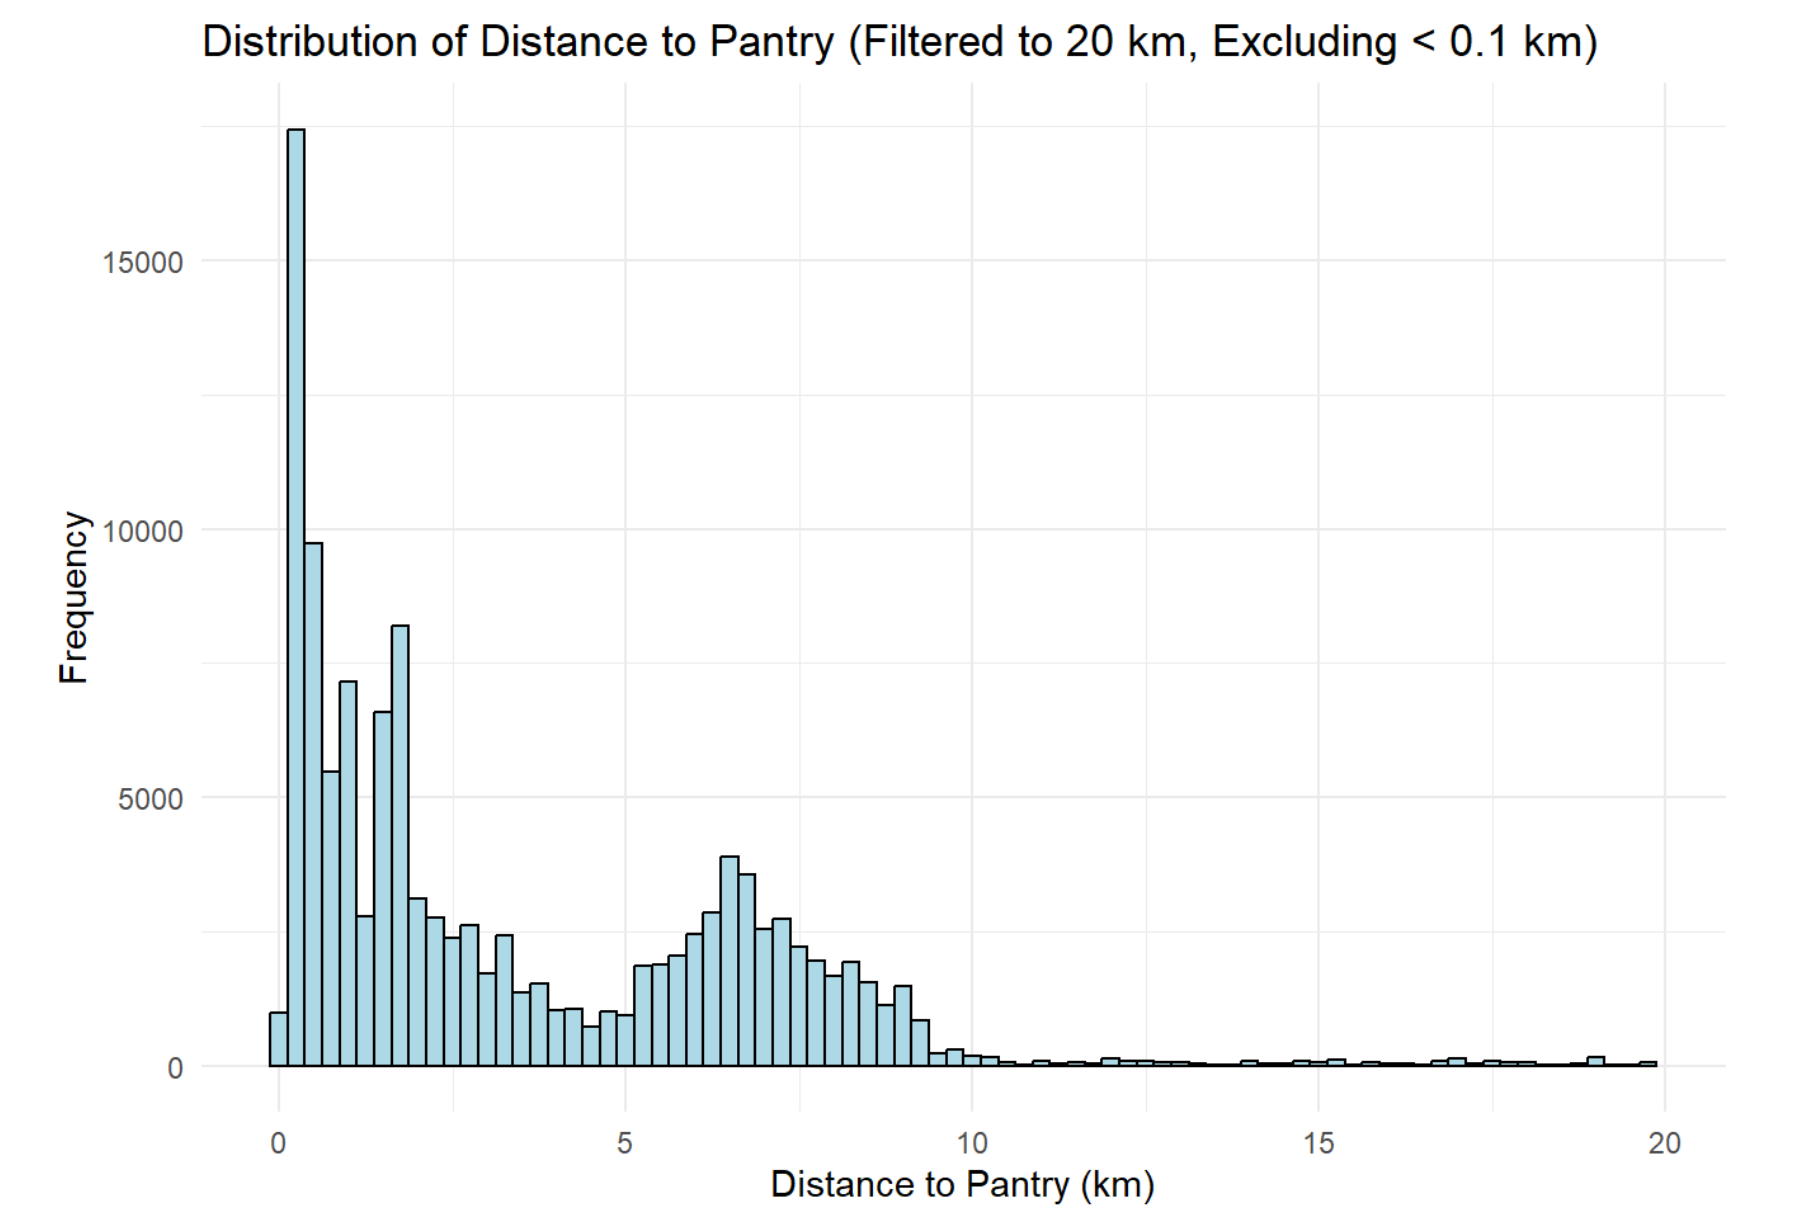
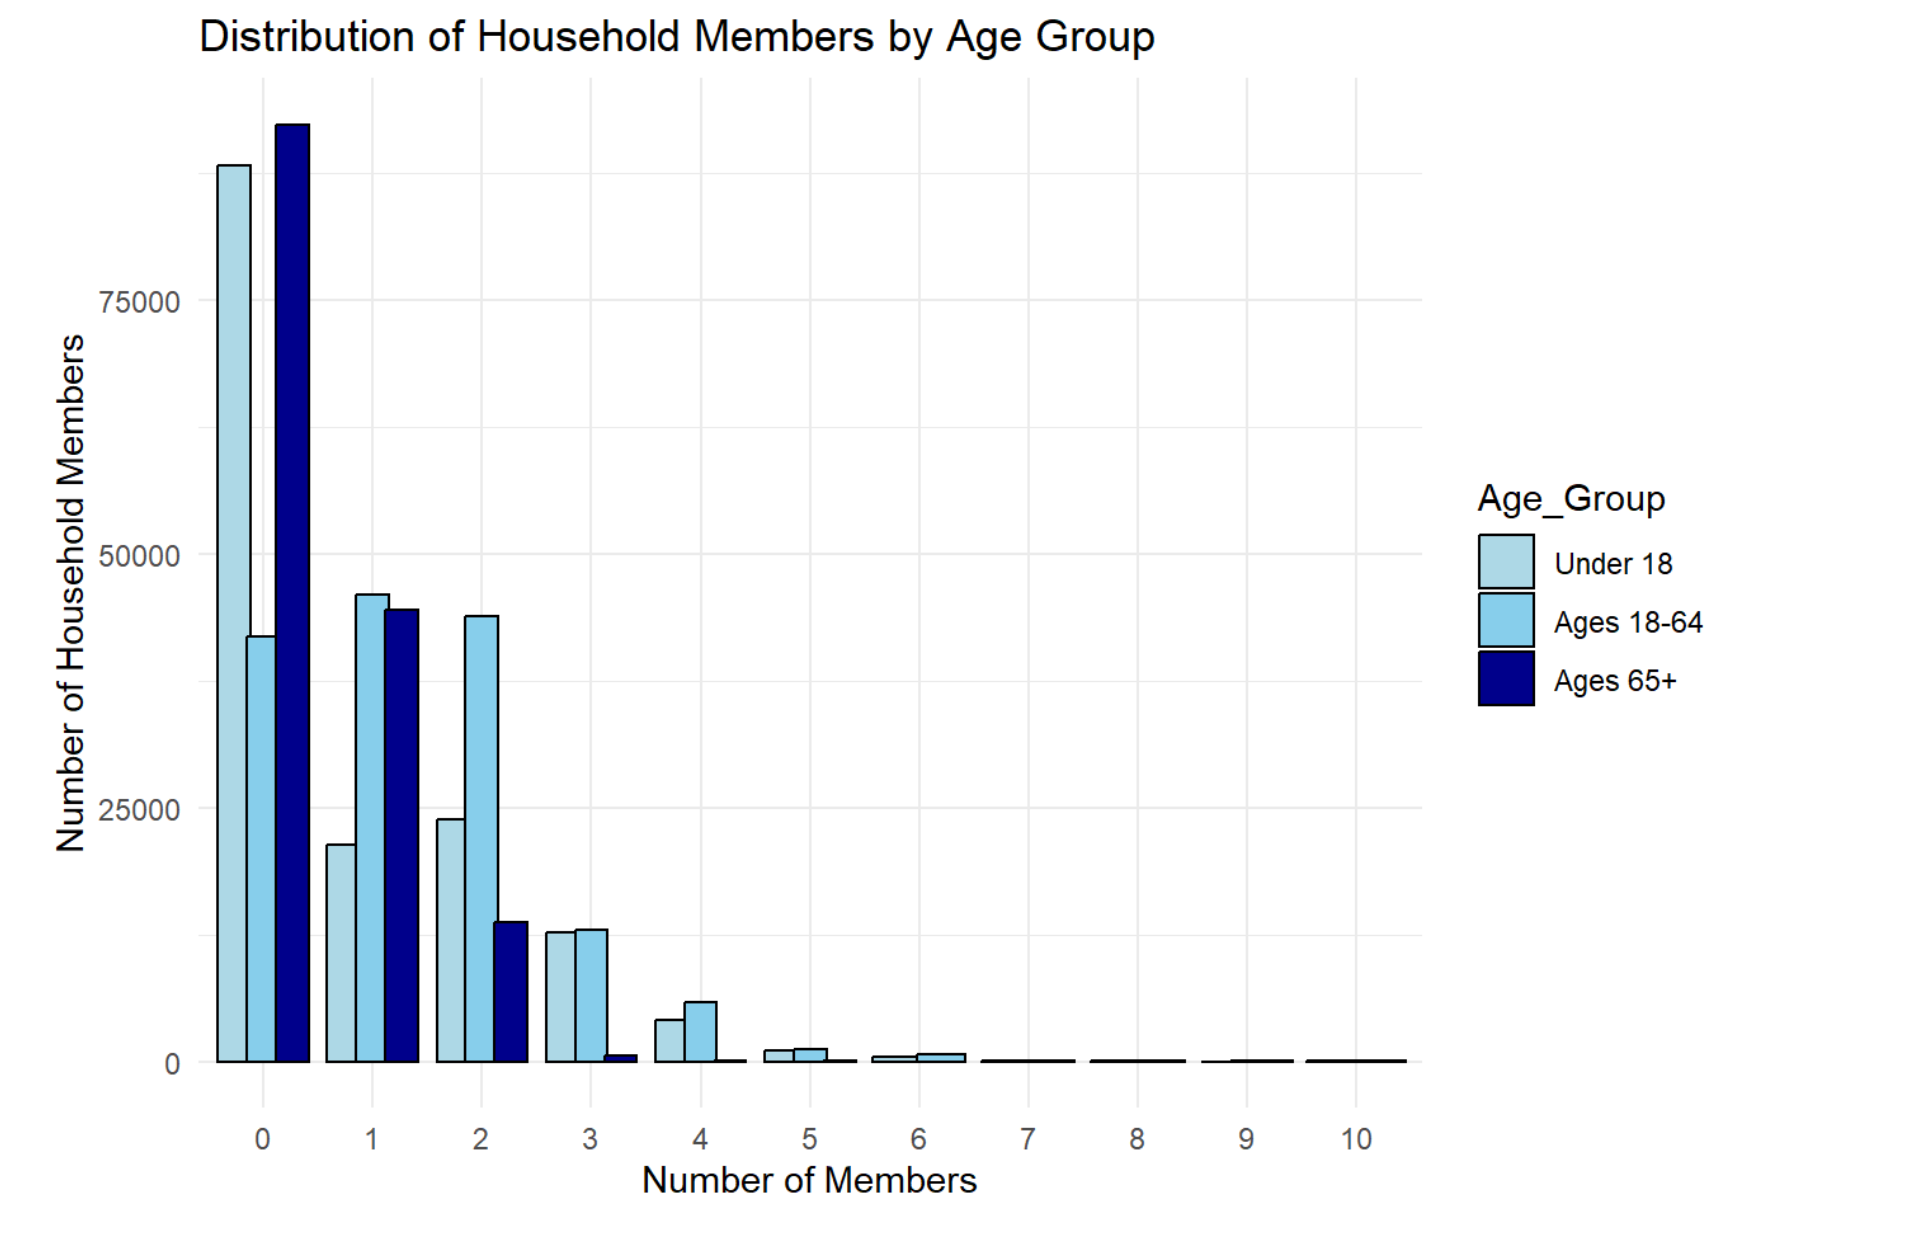
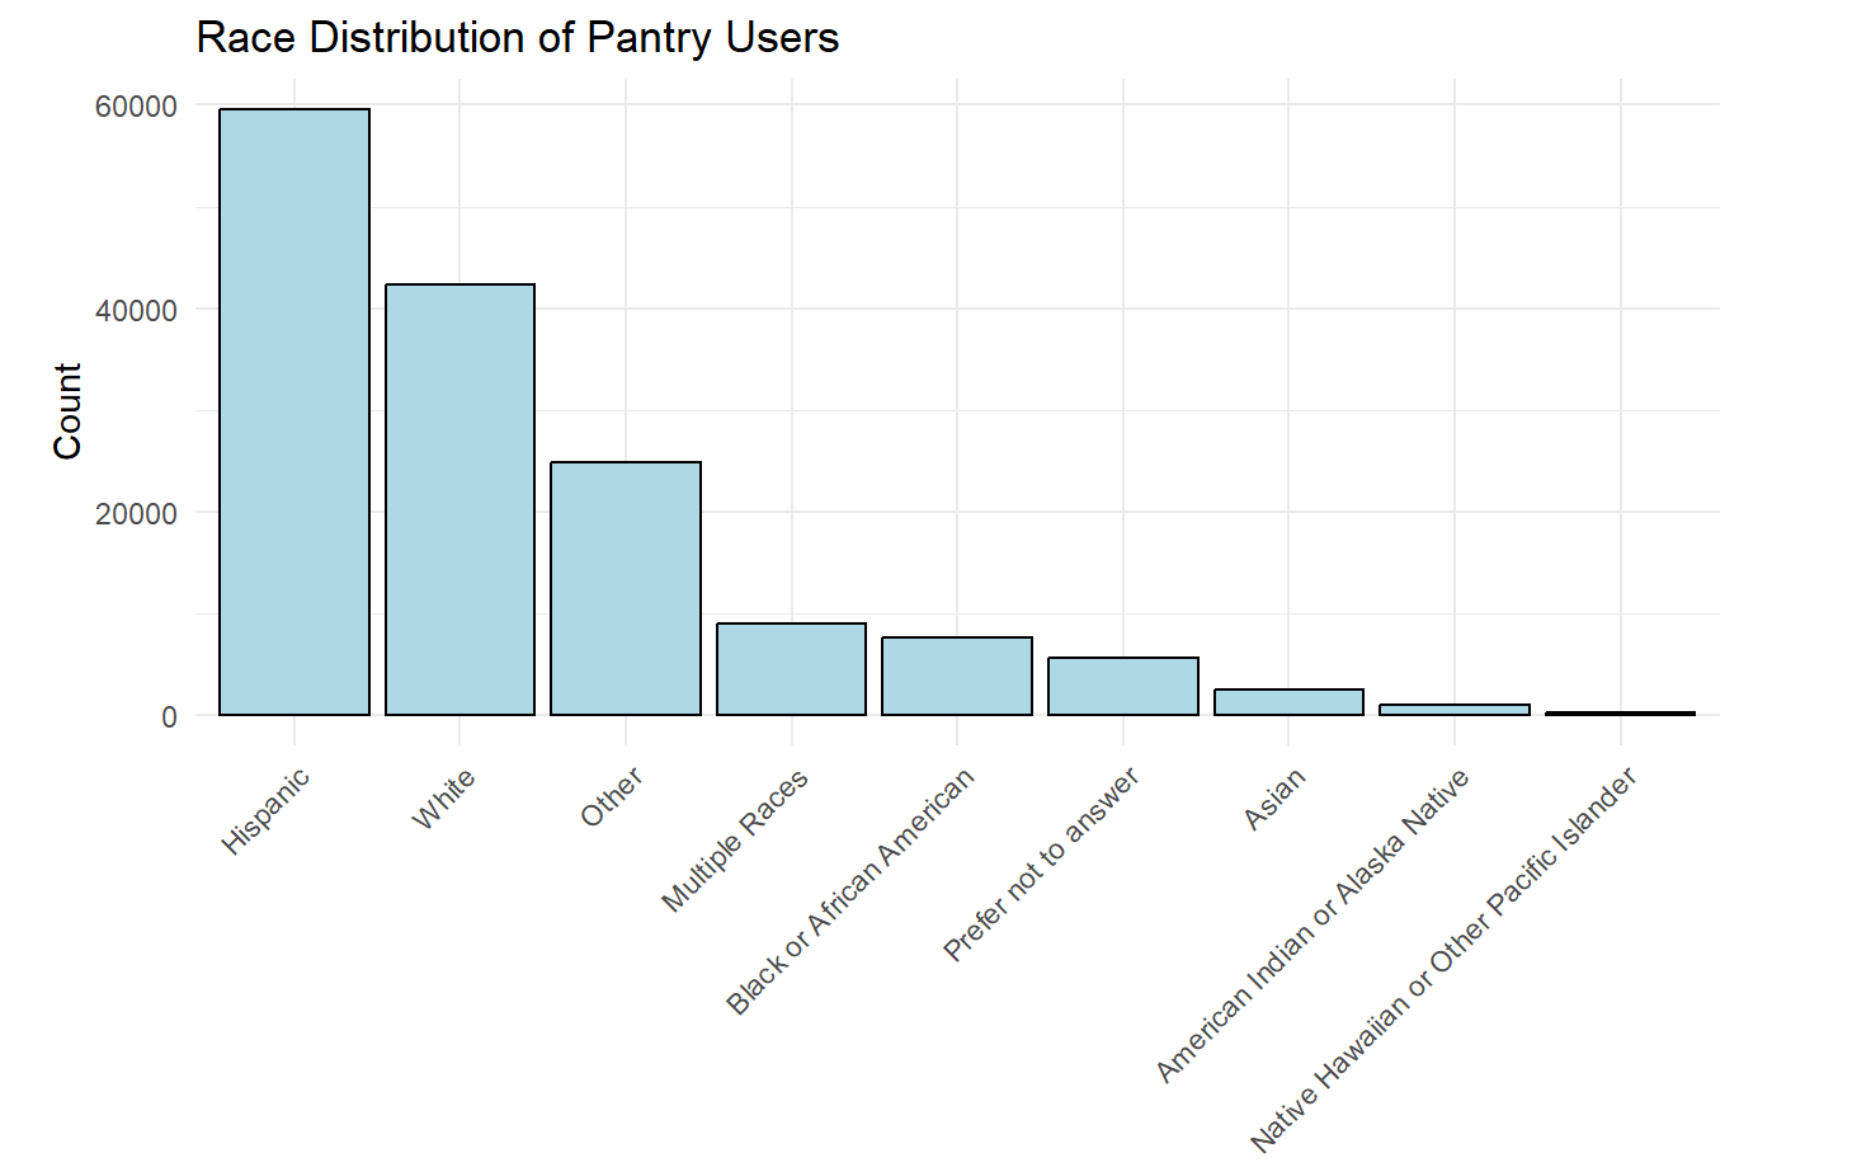
A group project where our team worked with the Salem Pantry, a non-profit food pantry in Salem, MA, to analyze over 150,000 rows of their client data. The goal was to figure out who's using the pantry, where they're coming from, and where the coverage gaps are. We cleaned and organized all the data, then used R with packages like sf, tmap, tidycensus, tigris, randomForest, ranger, caret, leaflet, and ggplot2 to run the analysis. We mapped dry zones — areas with less pantry coverage — and used random forest analysis and statistical regression to identify other parts of Massachusetts with similar socioeconomic profiles (based on census tract data like income, household size, language, and race). The results were presented to the Salem Pantry board to help guide decisions about outreach and potential expansion.
Result
Our team presented the findings to the Salem Pantry board to support outreach and expansion decisions.
Figures