Massachusetts Education Atlas
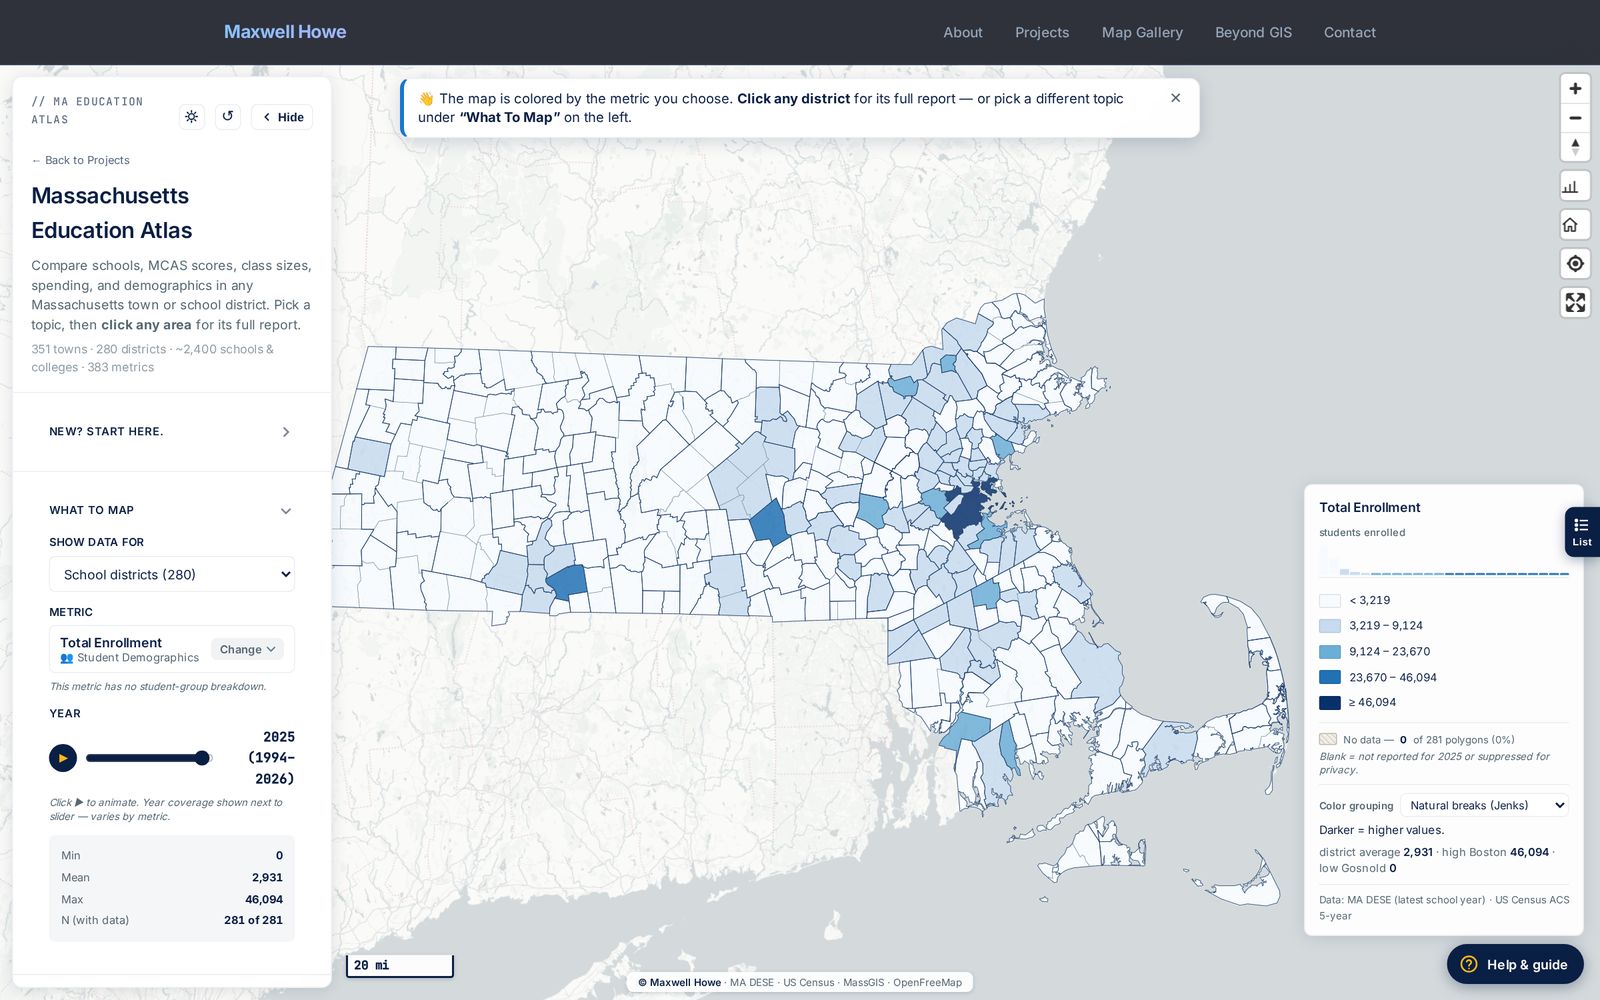
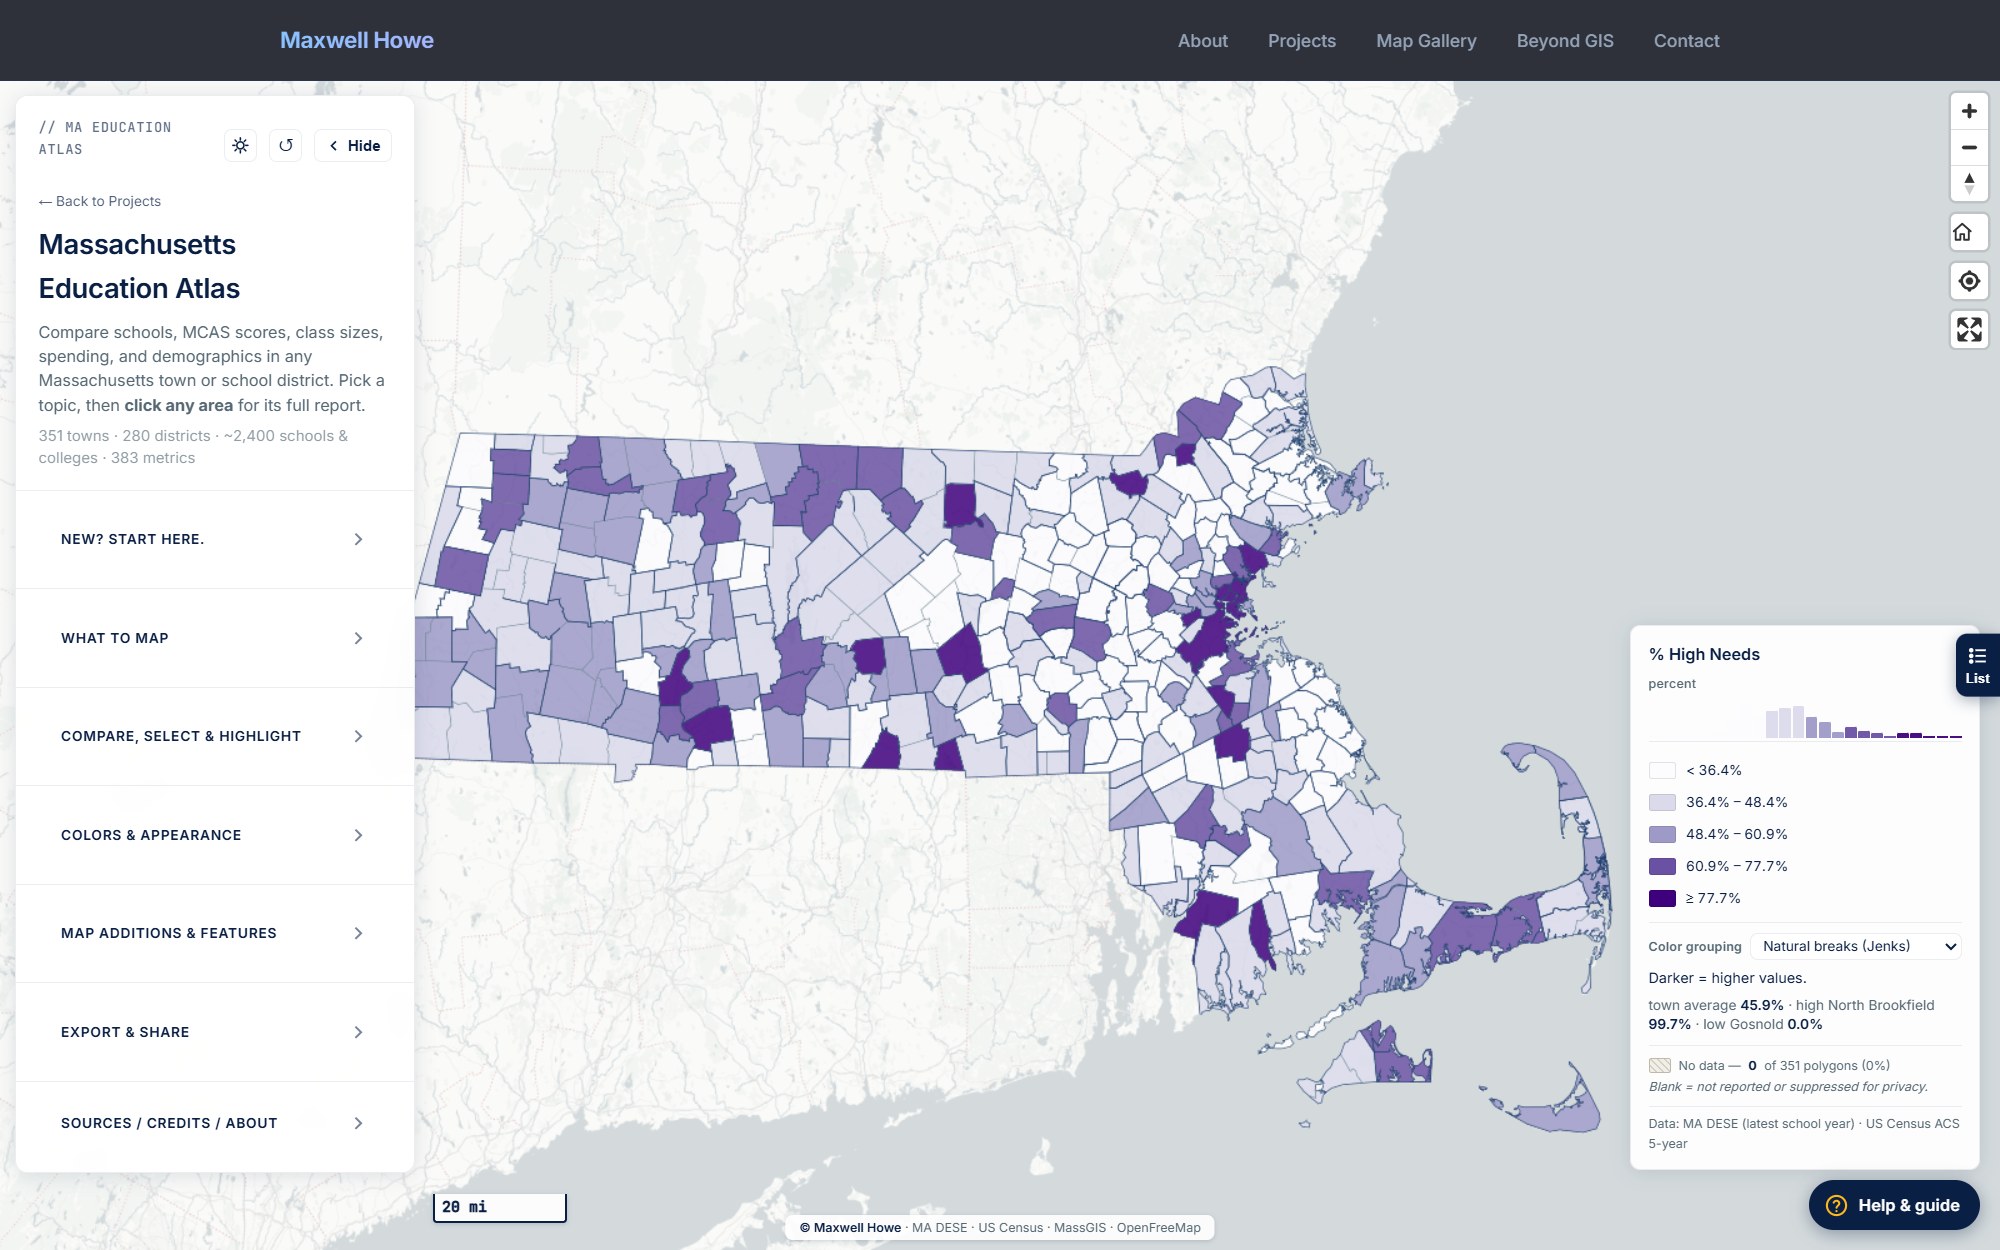
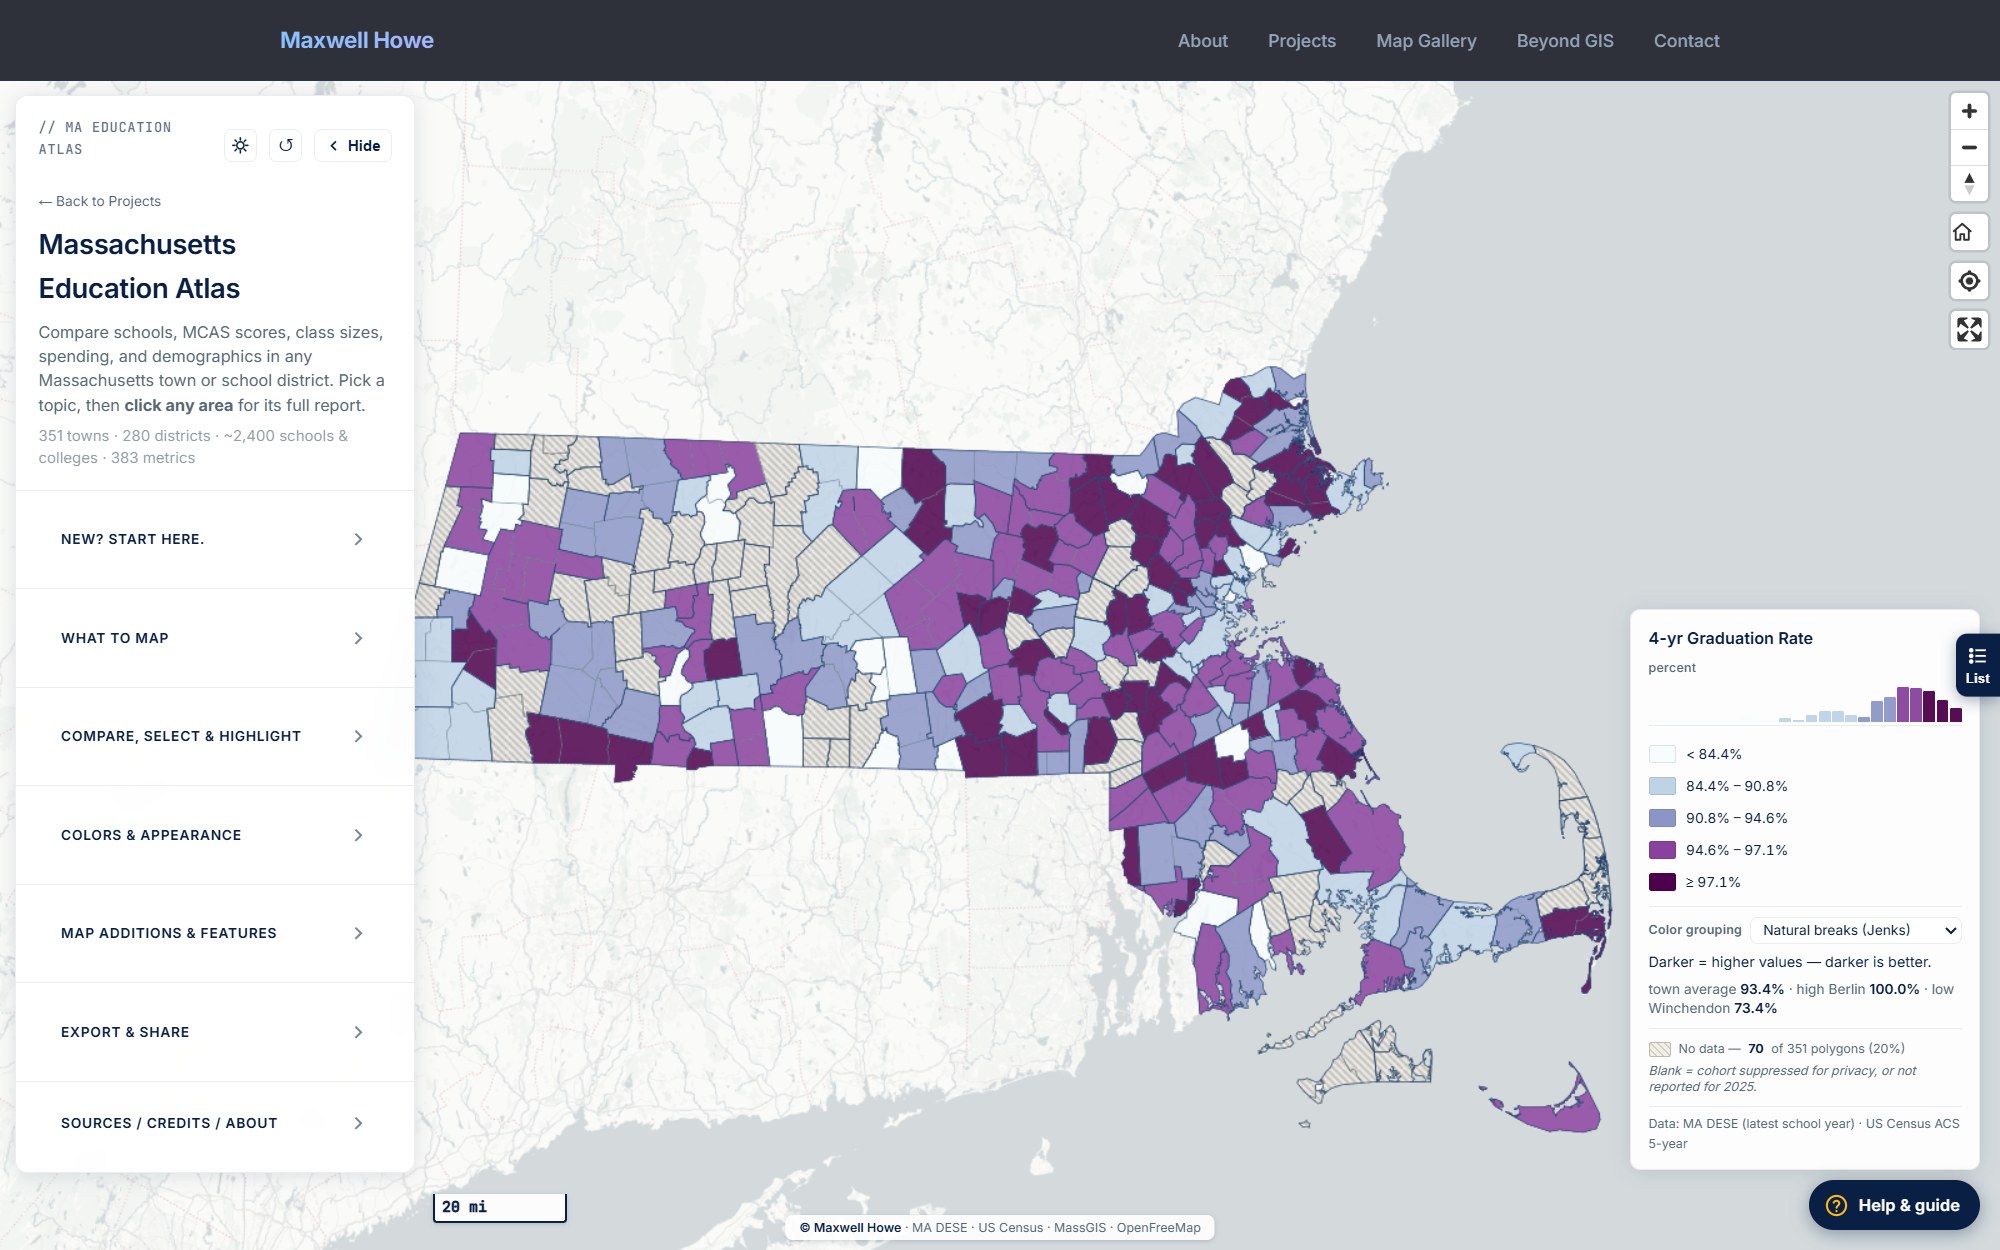
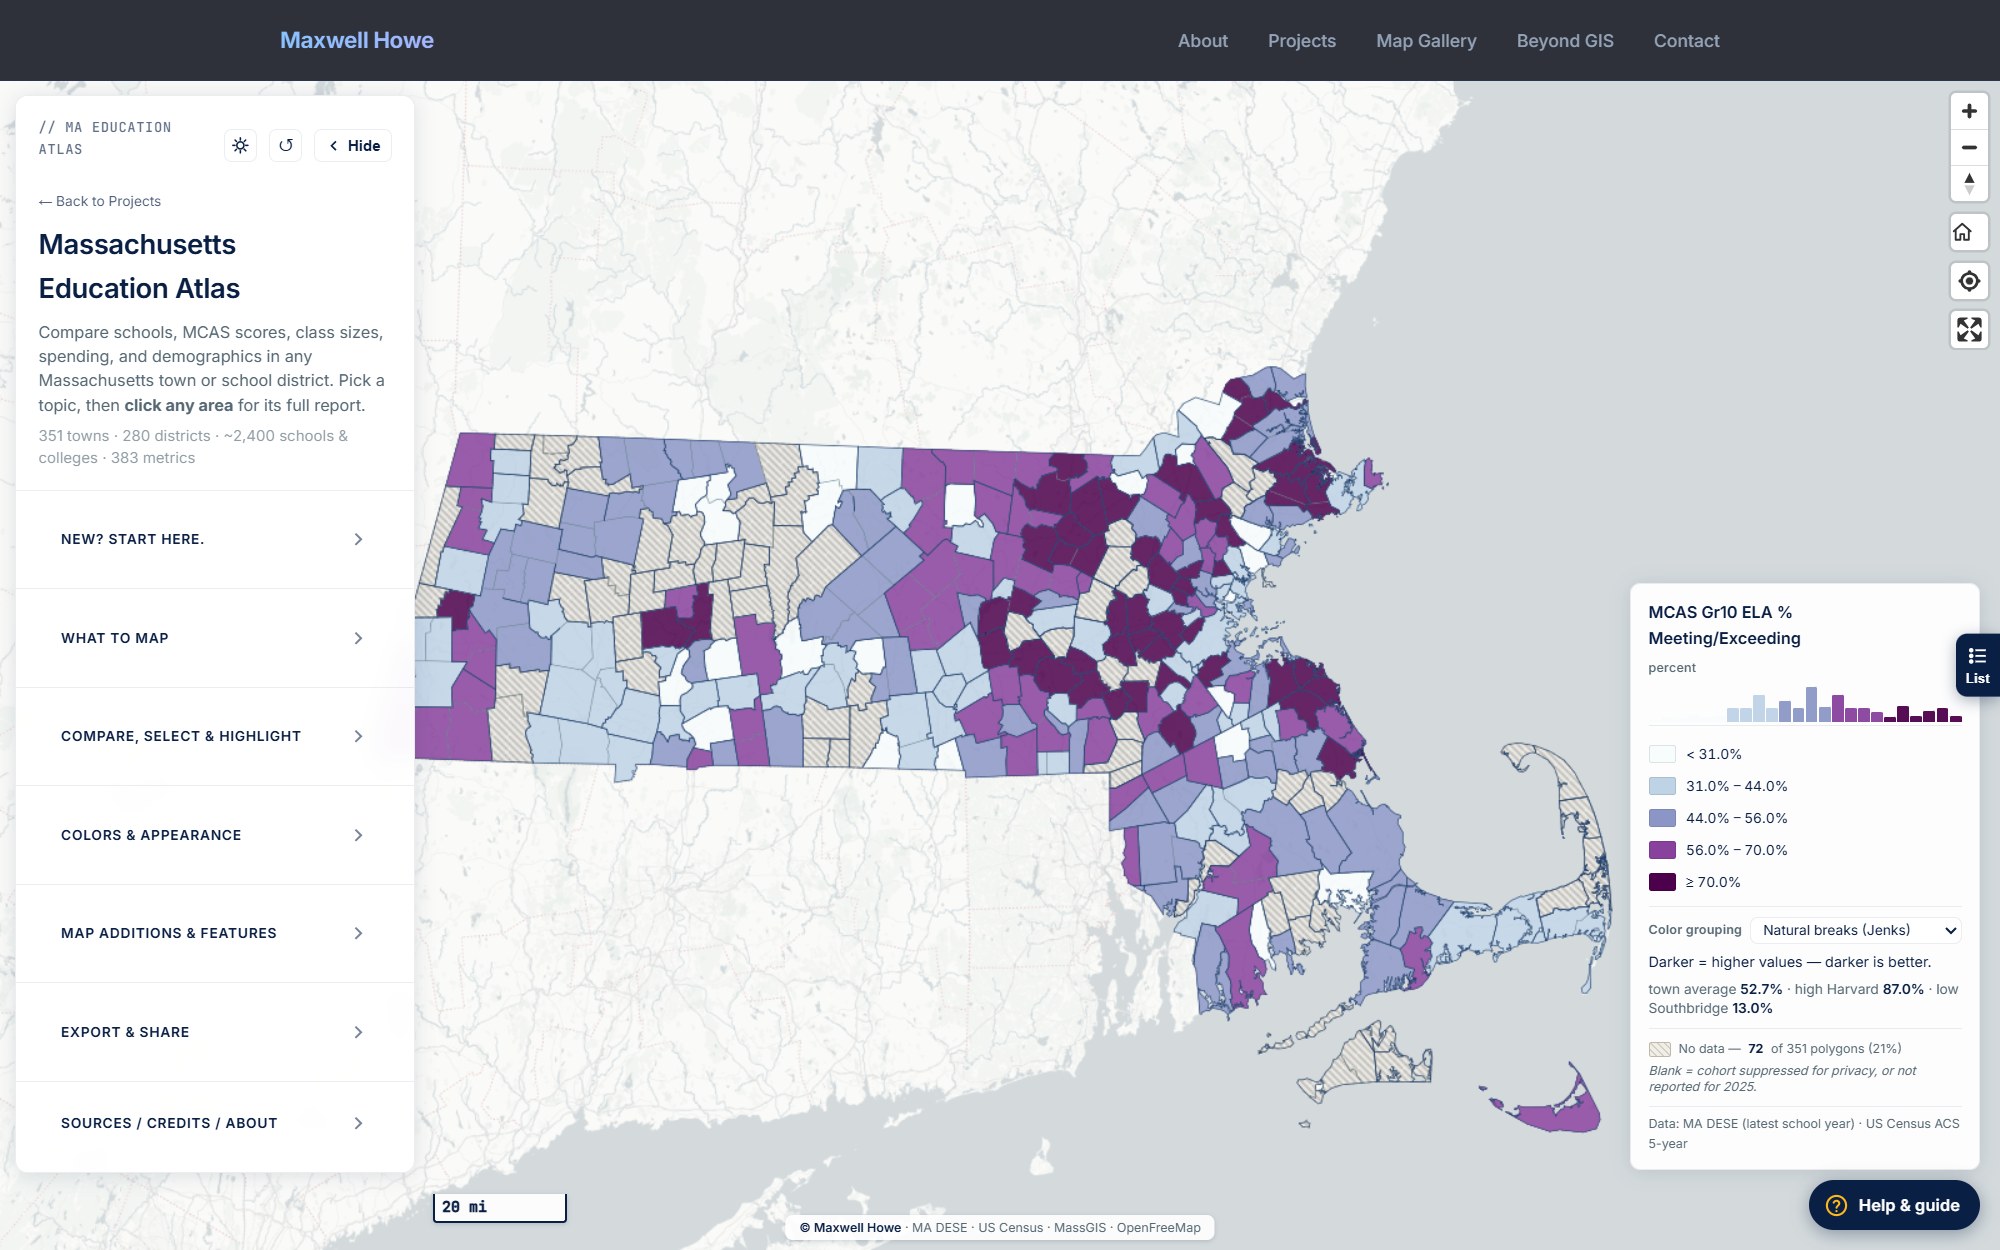
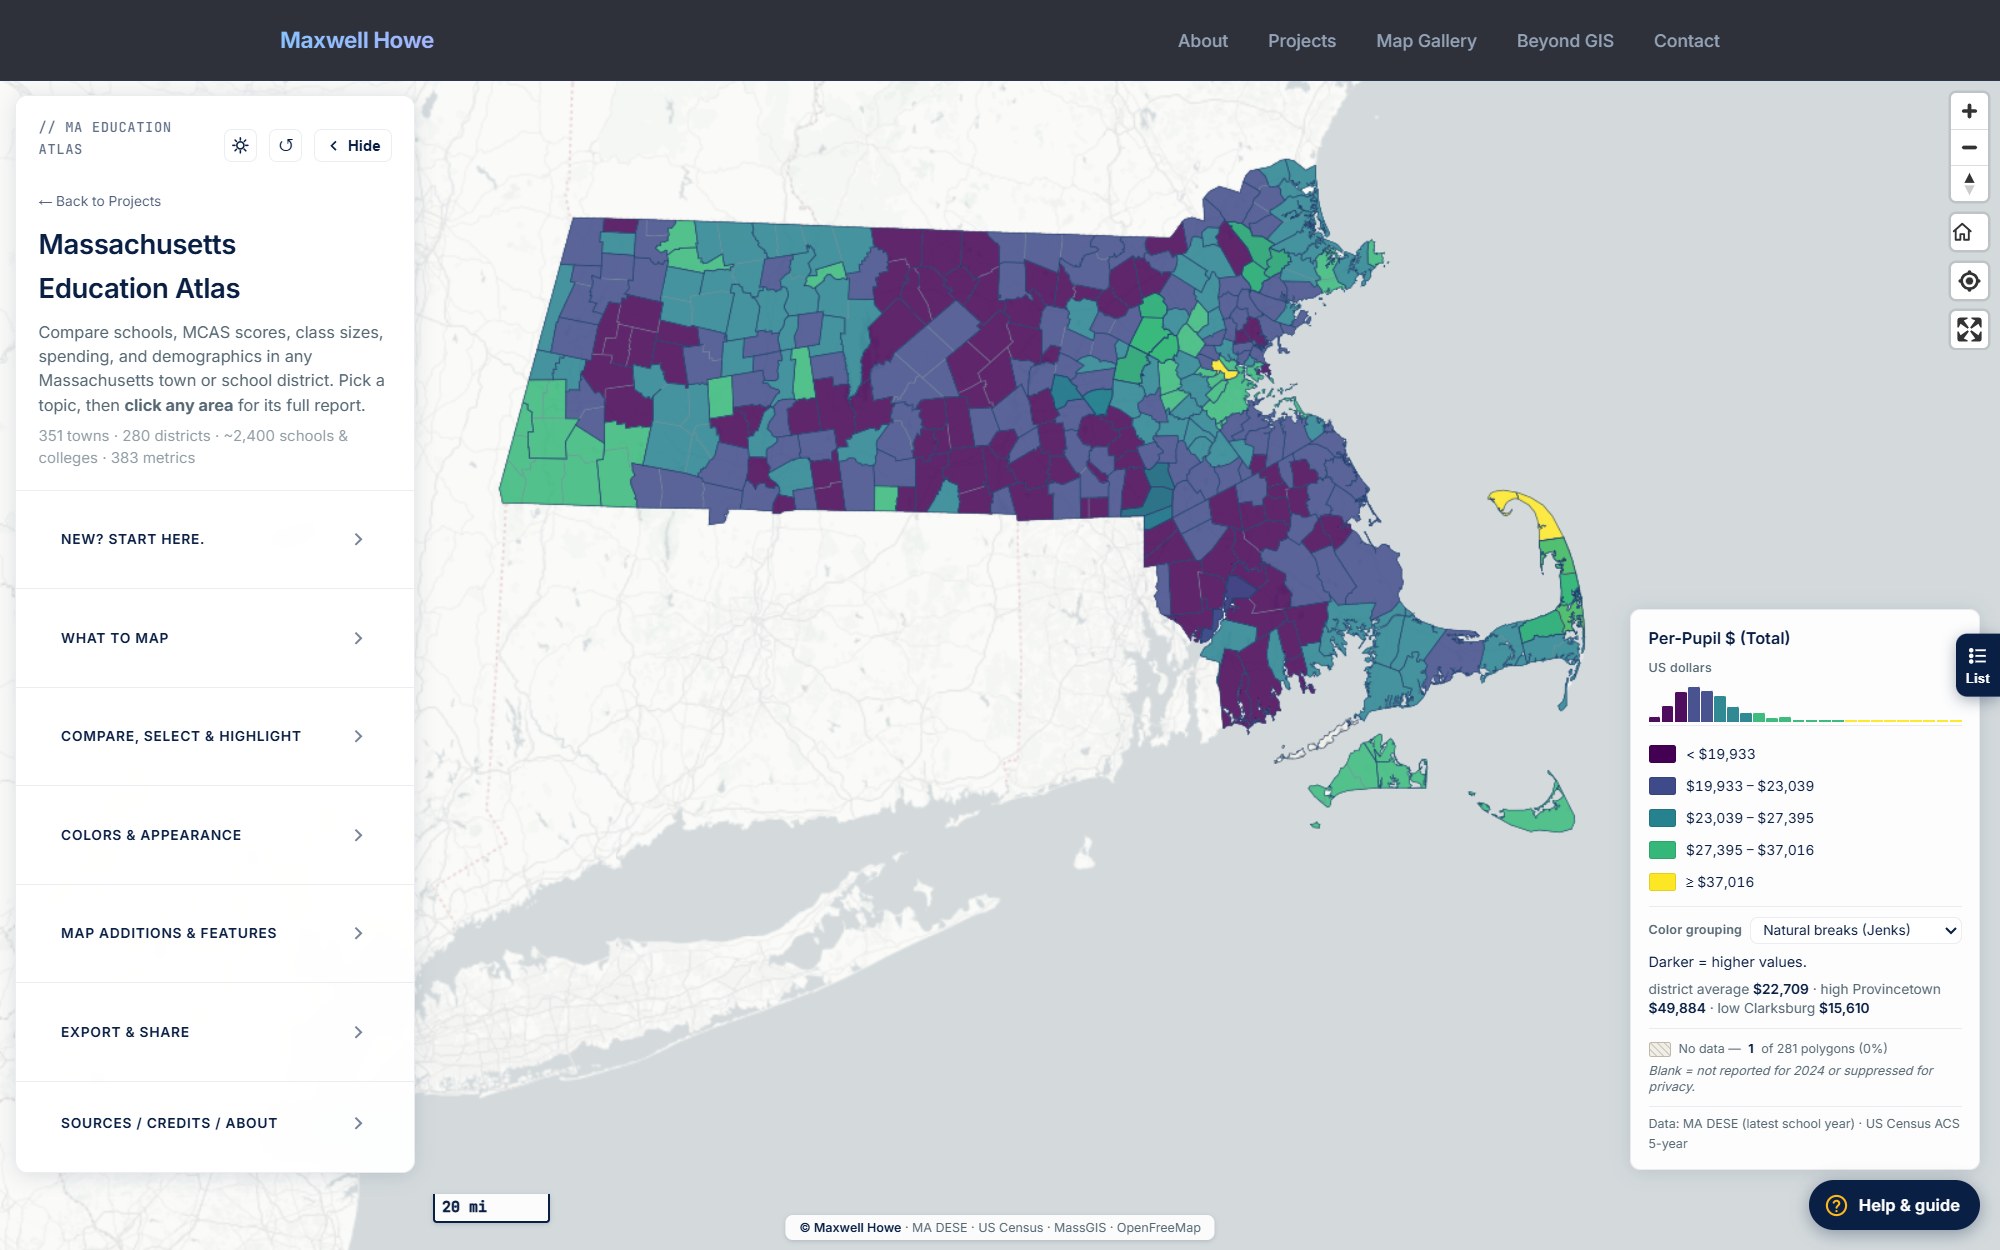
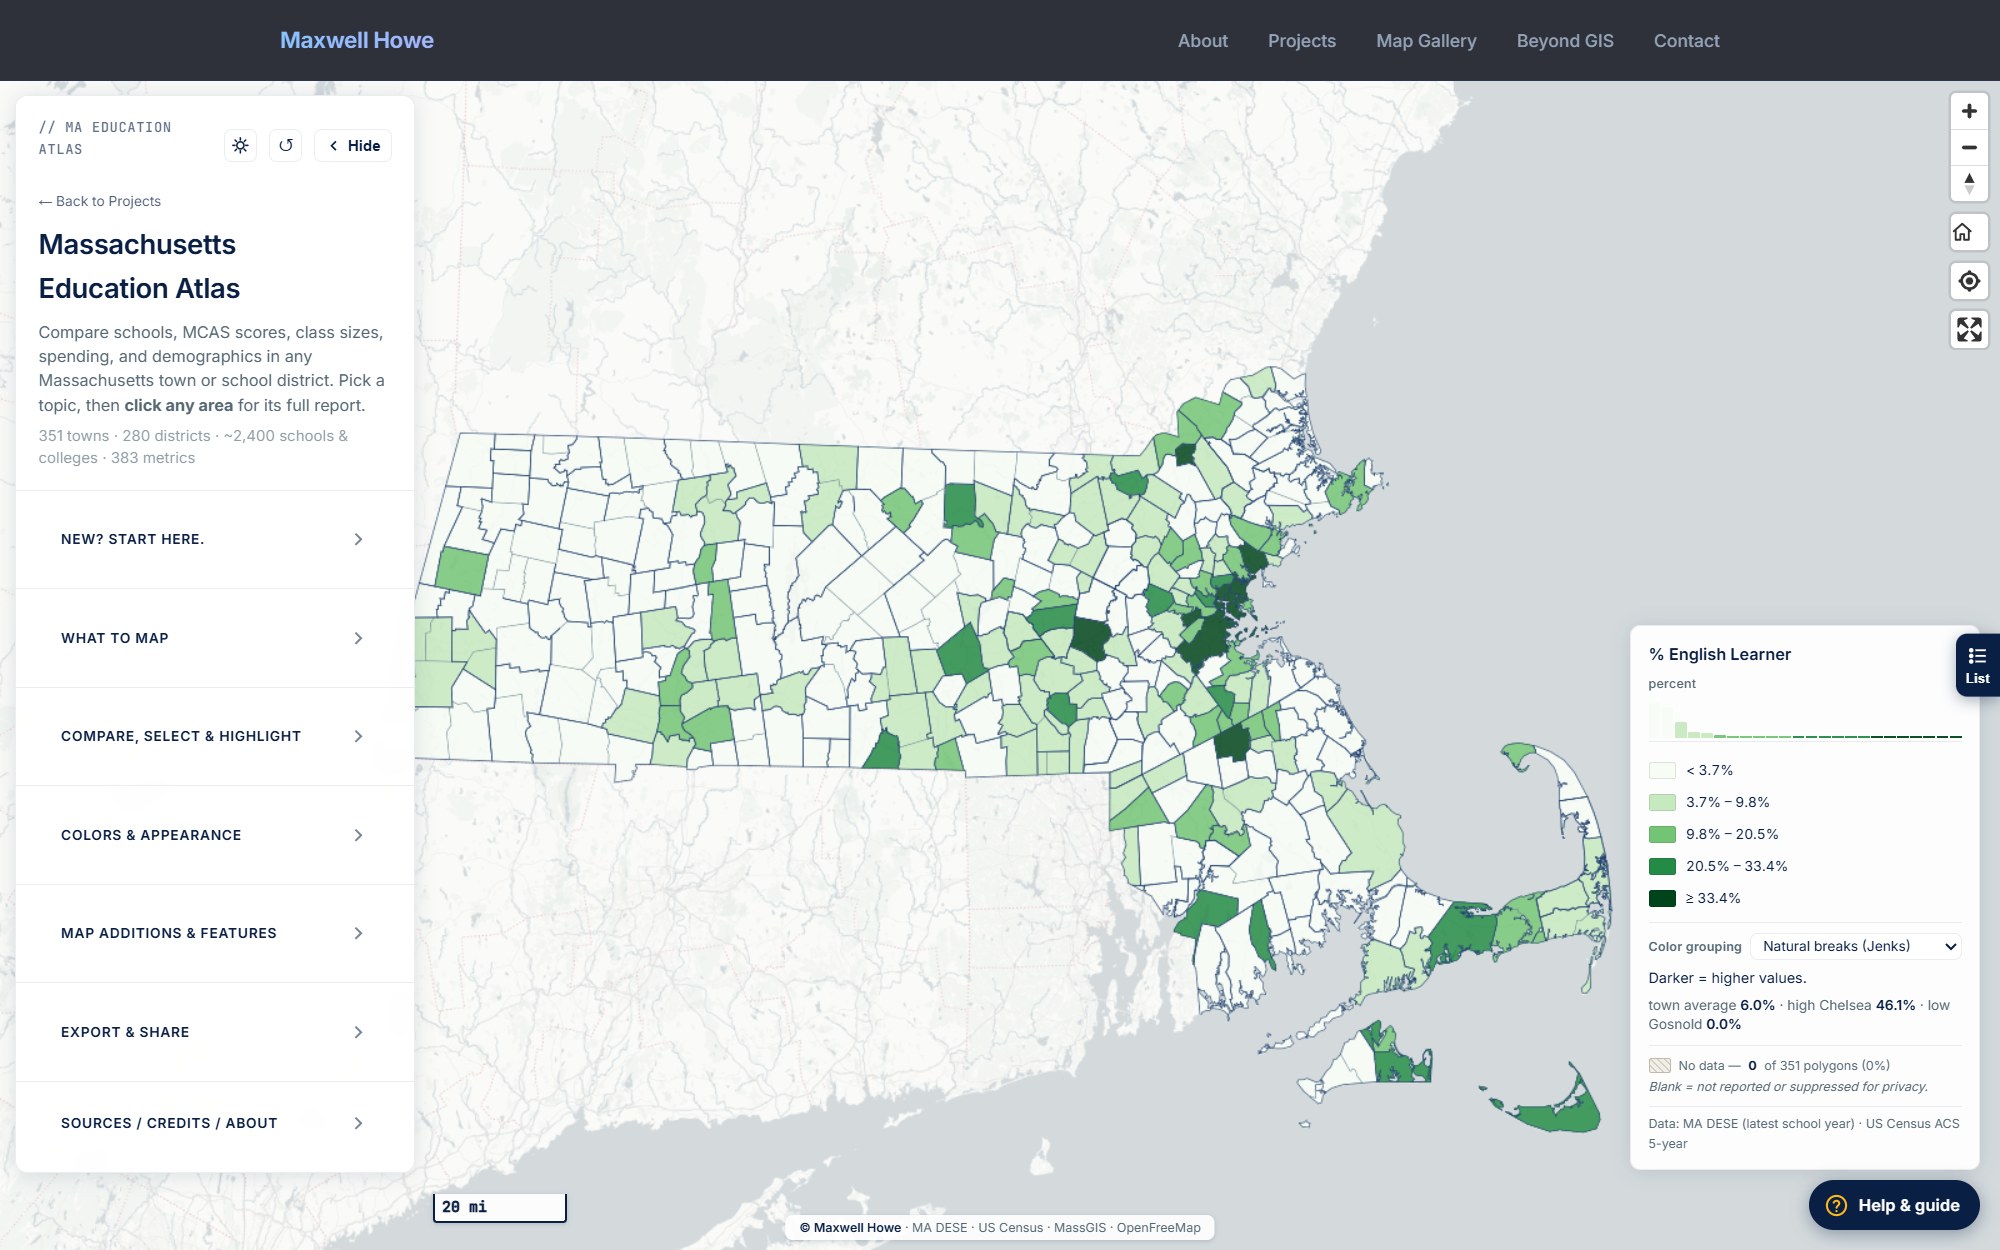
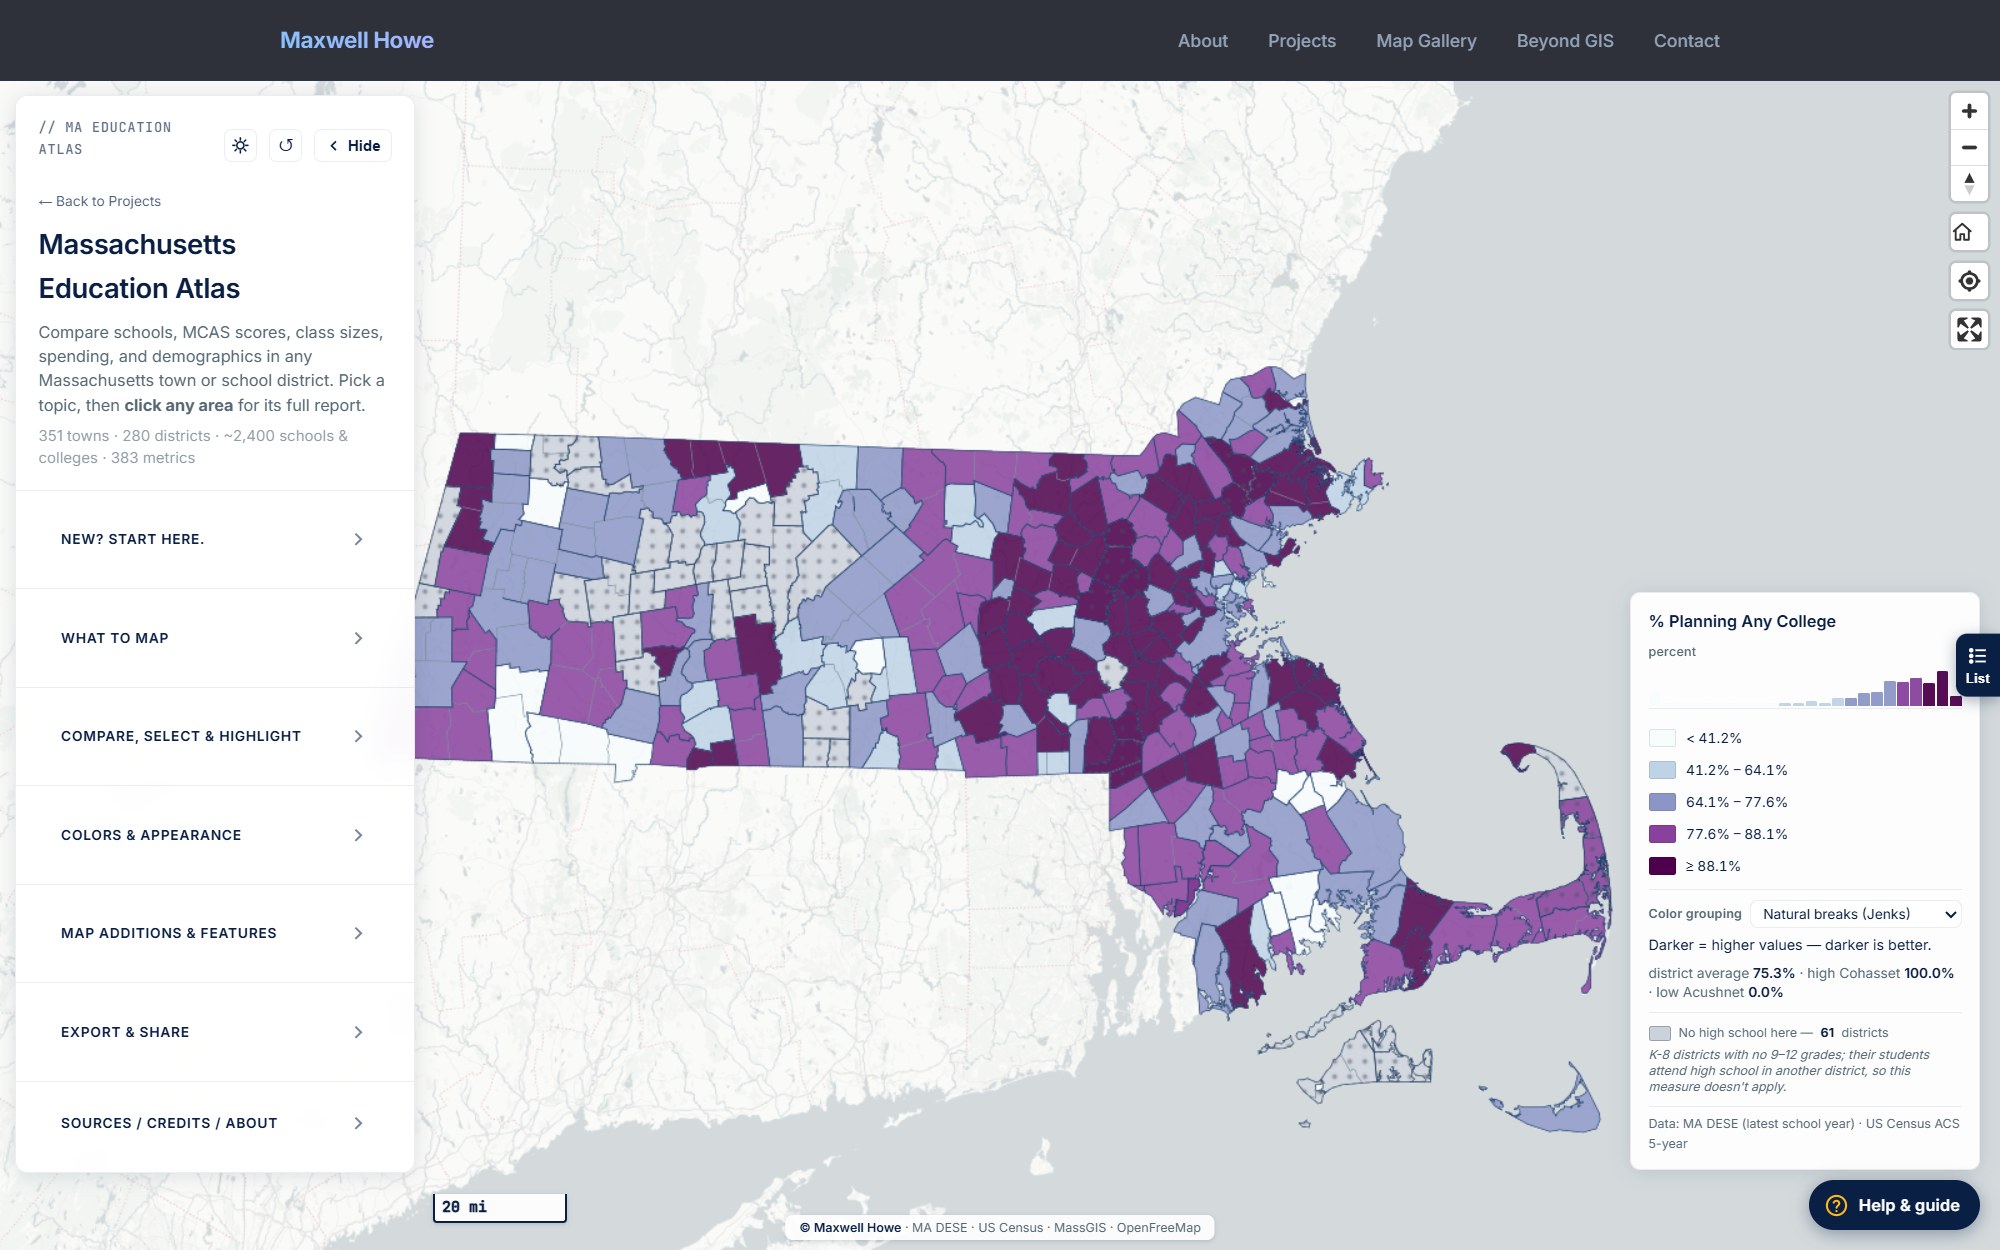
Statewide interactive web map of every public school and school district in Massachusetts. 351 municipalities, 274 academic districts, 78 charters, 26 regional vocational, 1,700 schools — 40+ joined education and demographic metrics, ArcGIS-style layer panel, palette + classification controls, hover + sticky side panel.
My role
I built the academic-district polygons, joined the statewide education and demographic data, and designed the MapLibre interface and classification controls.
Approach
MassGIS publishes charter, vocational, collaborative, and historic-union boundaries, but not the standard town and regional academic districts needed for this map. I built 274 academic district polygons by joining the public-schools point data to municipalities and dissolving towns by their dominant district code. Academic, vocational, and charter districts overlap, so the interface keeps them as independent layers. More than 40 joined measures cover demographics, MCAS, graduation, postsecondary plans, finance, and teacher workforce, with selectable classification and palette controls.
Result
The atlas provides one interactive view of Massachusetts schools, districts, finance, outcomes, and community context across more than 40 joined measures.
Figures