GIS Case Study

Chronic Absenteeism in Lynn Public Schools

Spatial Analysis · 2025 · GPH945 — GIS Project Implementation Live

Geocoded student addresses and correlated distance from school with chronic absenteeism rates across Lynn, MA — my capstone project for my MS program.

My role

I designed the capstone question, geocoded student addresses, calculated distance bands, ran the statistical analysis in R, and produced the maps and figures.

Approach

For my capstone project in the MS program (Project Implementation), I tackled the chronic absenteeism problem in Lynn Public Schools. I wanted to know if the distance a student lives from school has any measurable impact on whether they show up. I geocoded student addresses across the district and correlated each student's distance from school with their absenteeism record. I wrote scripts in R to run the analysis, including scatter plots, violin plots, box plots, and distance band breakdowns (0–0.25 mi, 0.25–0.5 mi, 0.5–1 mi, 1–2 mi, 2–3 mi, 3+ mi). The result was an extremely slight negative correlation — distance alone is not a strong predictor of attendance. The project produced a full suite of thematic maps and statistical visualizations.

Result

Distance from school showed only a very slight negative correlation with attendance. The result ruled out a simple explanation and demonstrated why a null finding can still be useful.


Figures
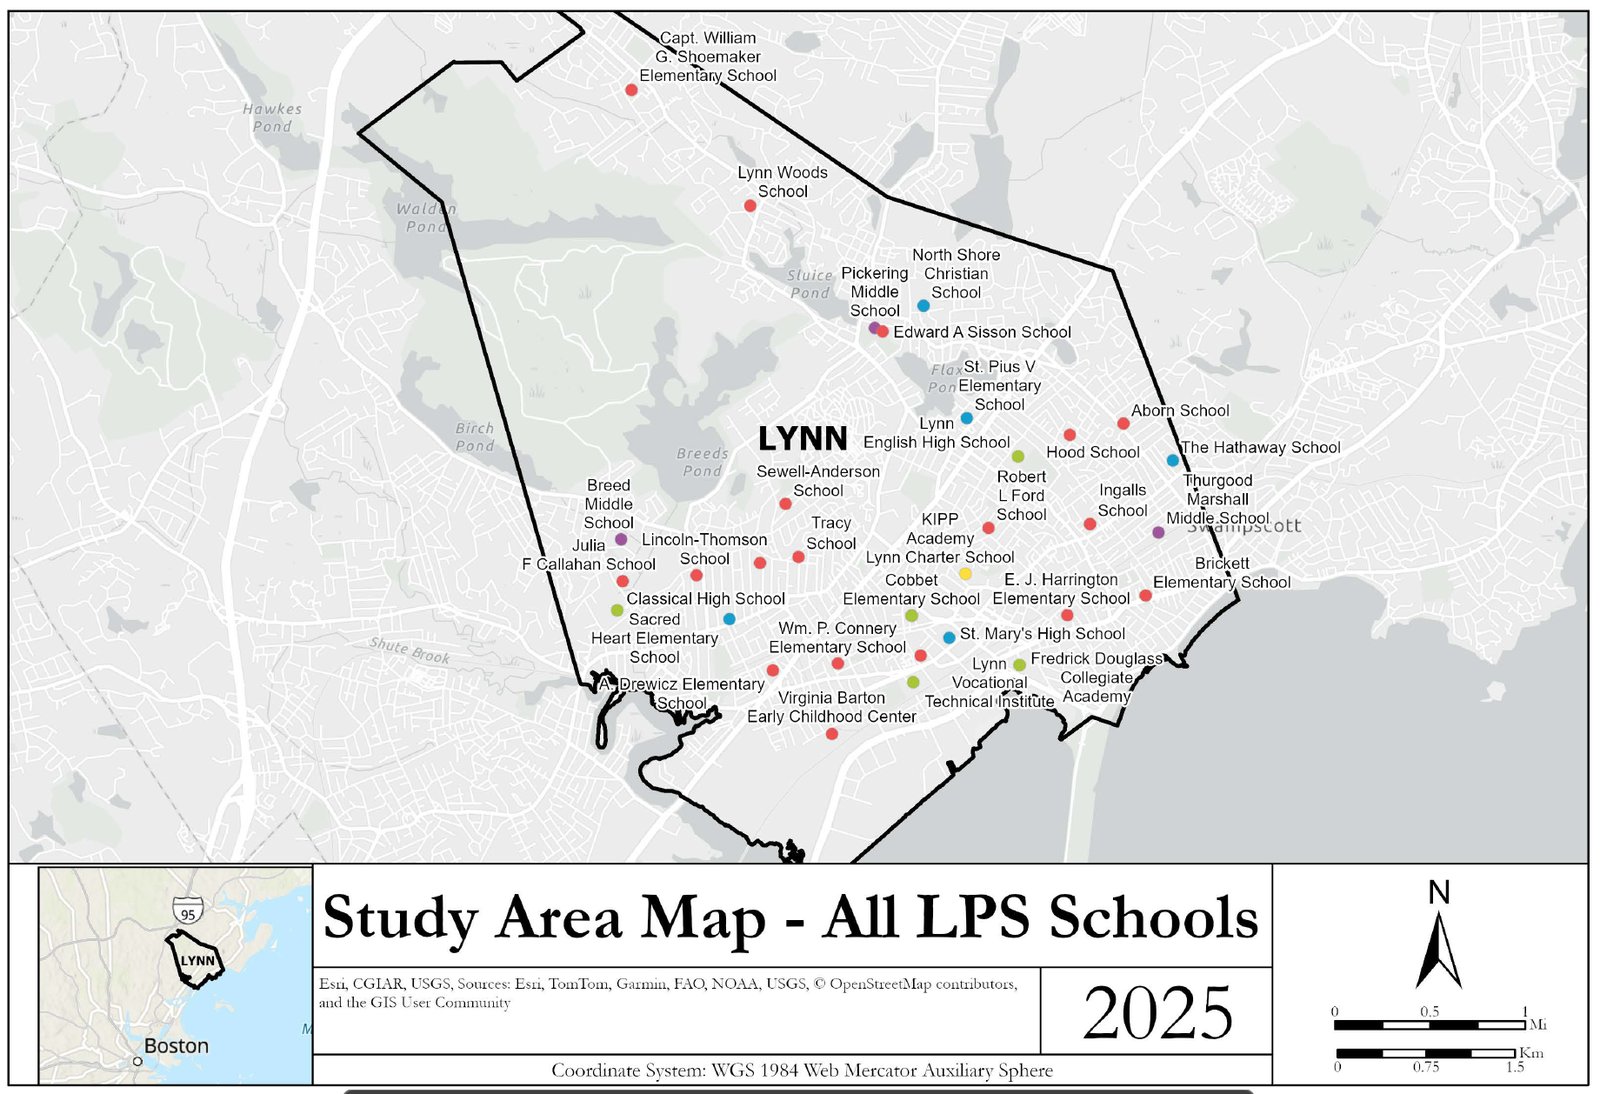
Study area — every Lynn Public Schools site inside the city boundary
Fig. 1Study area — every Lynn Public Schools site inside the city boundary
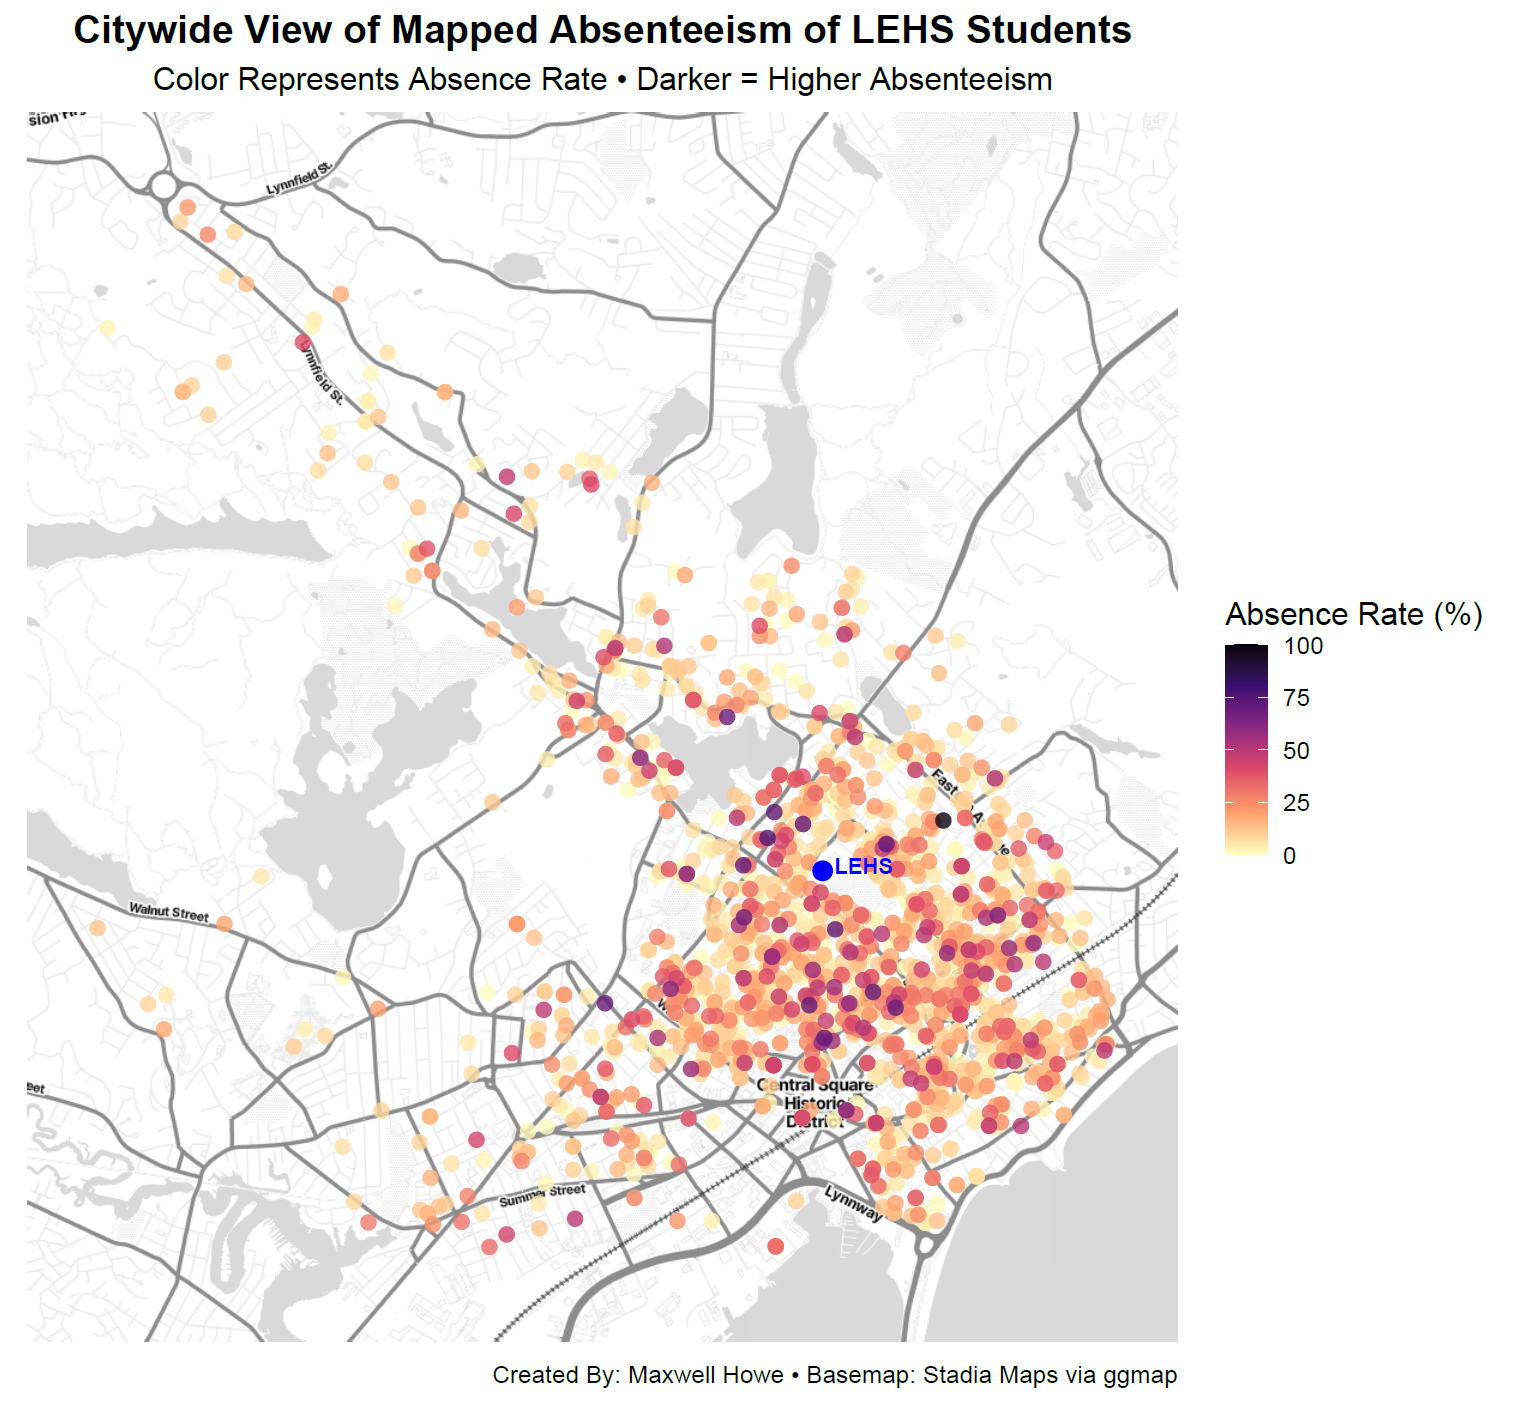
Citywide absenteeism — each dot a student address, colored by personal absence rate
Fig. 2Citywide absenteeism — each dot a student address, colored by personal absence rate
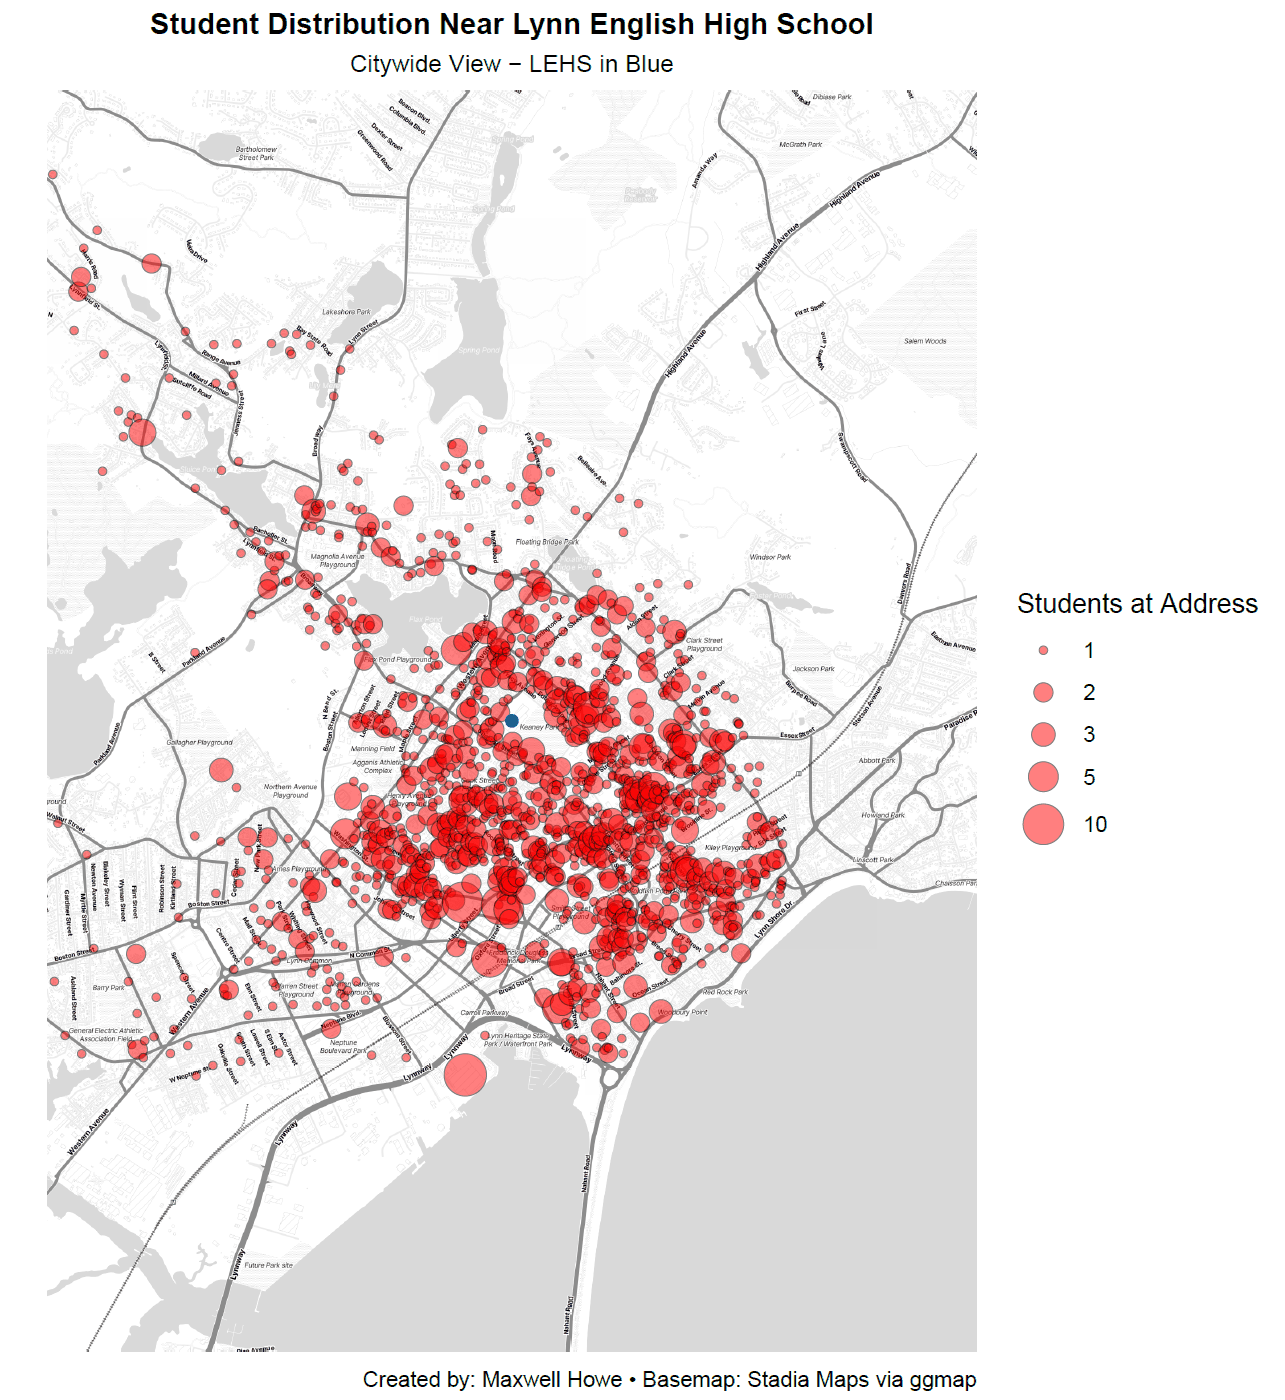
Student address distribution (citywide) — bubble size = students per address
Fig. 3Student address distribution (citywide) — bubble size = students per address
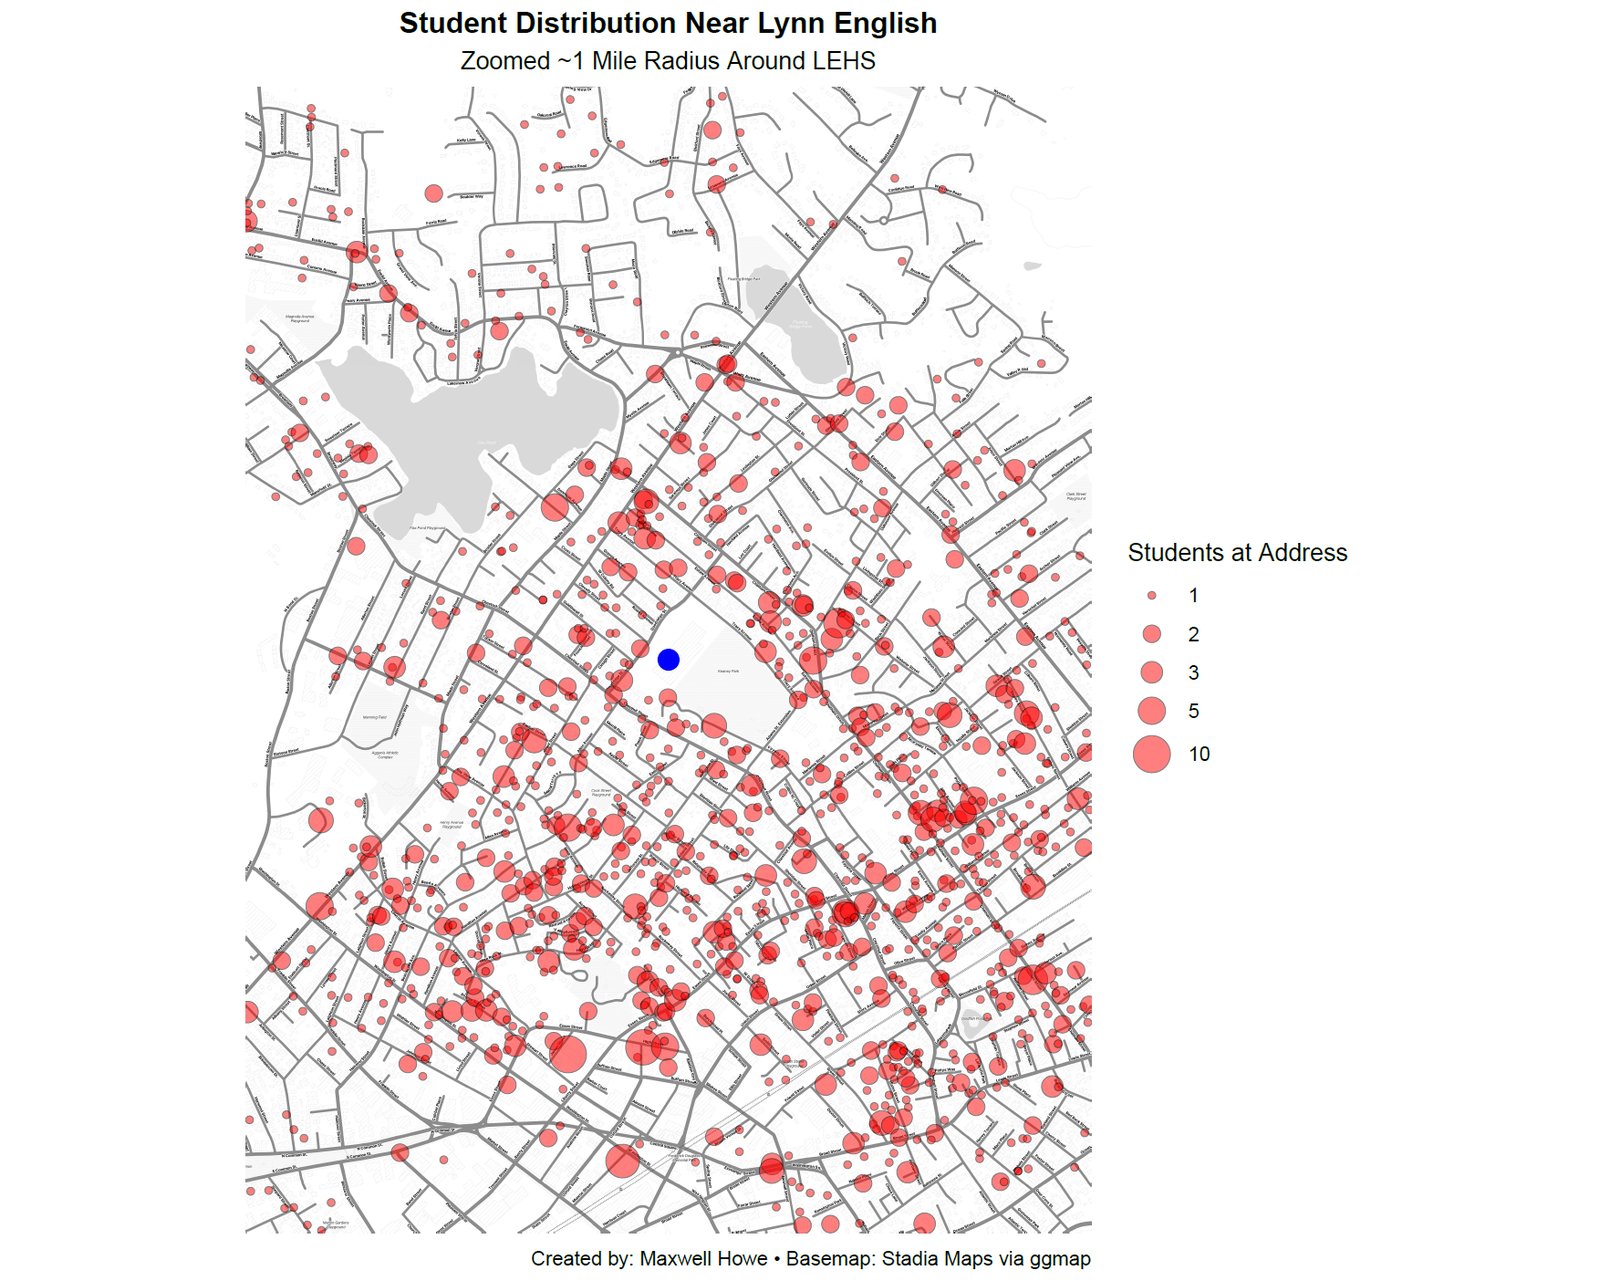
Student addresses near LEHS — 1-mile zoom
Fig. 4Student addresses near LEHS — 1-mile zoom
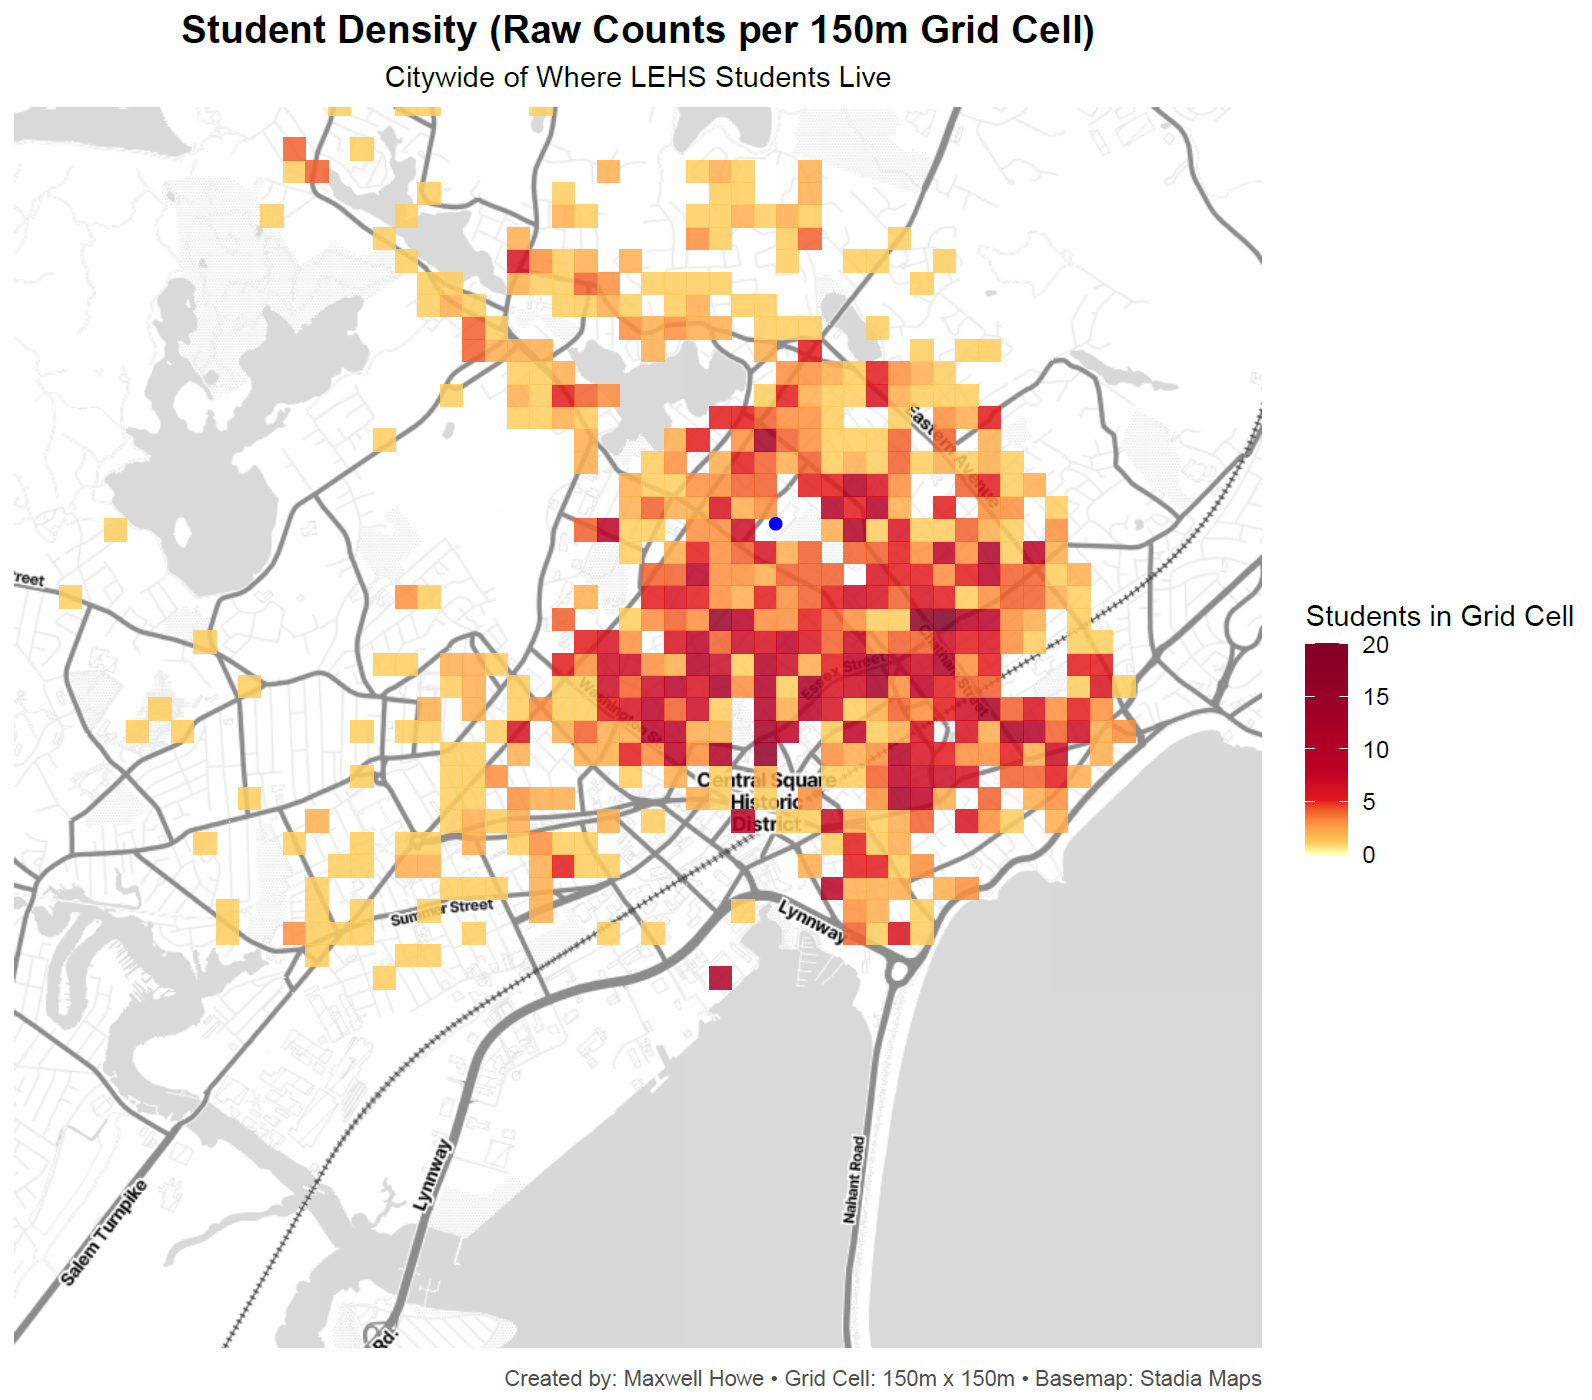
Student density grid — counts per 150 m cell
Fig. 5Student density grid — counts per 150 m cell
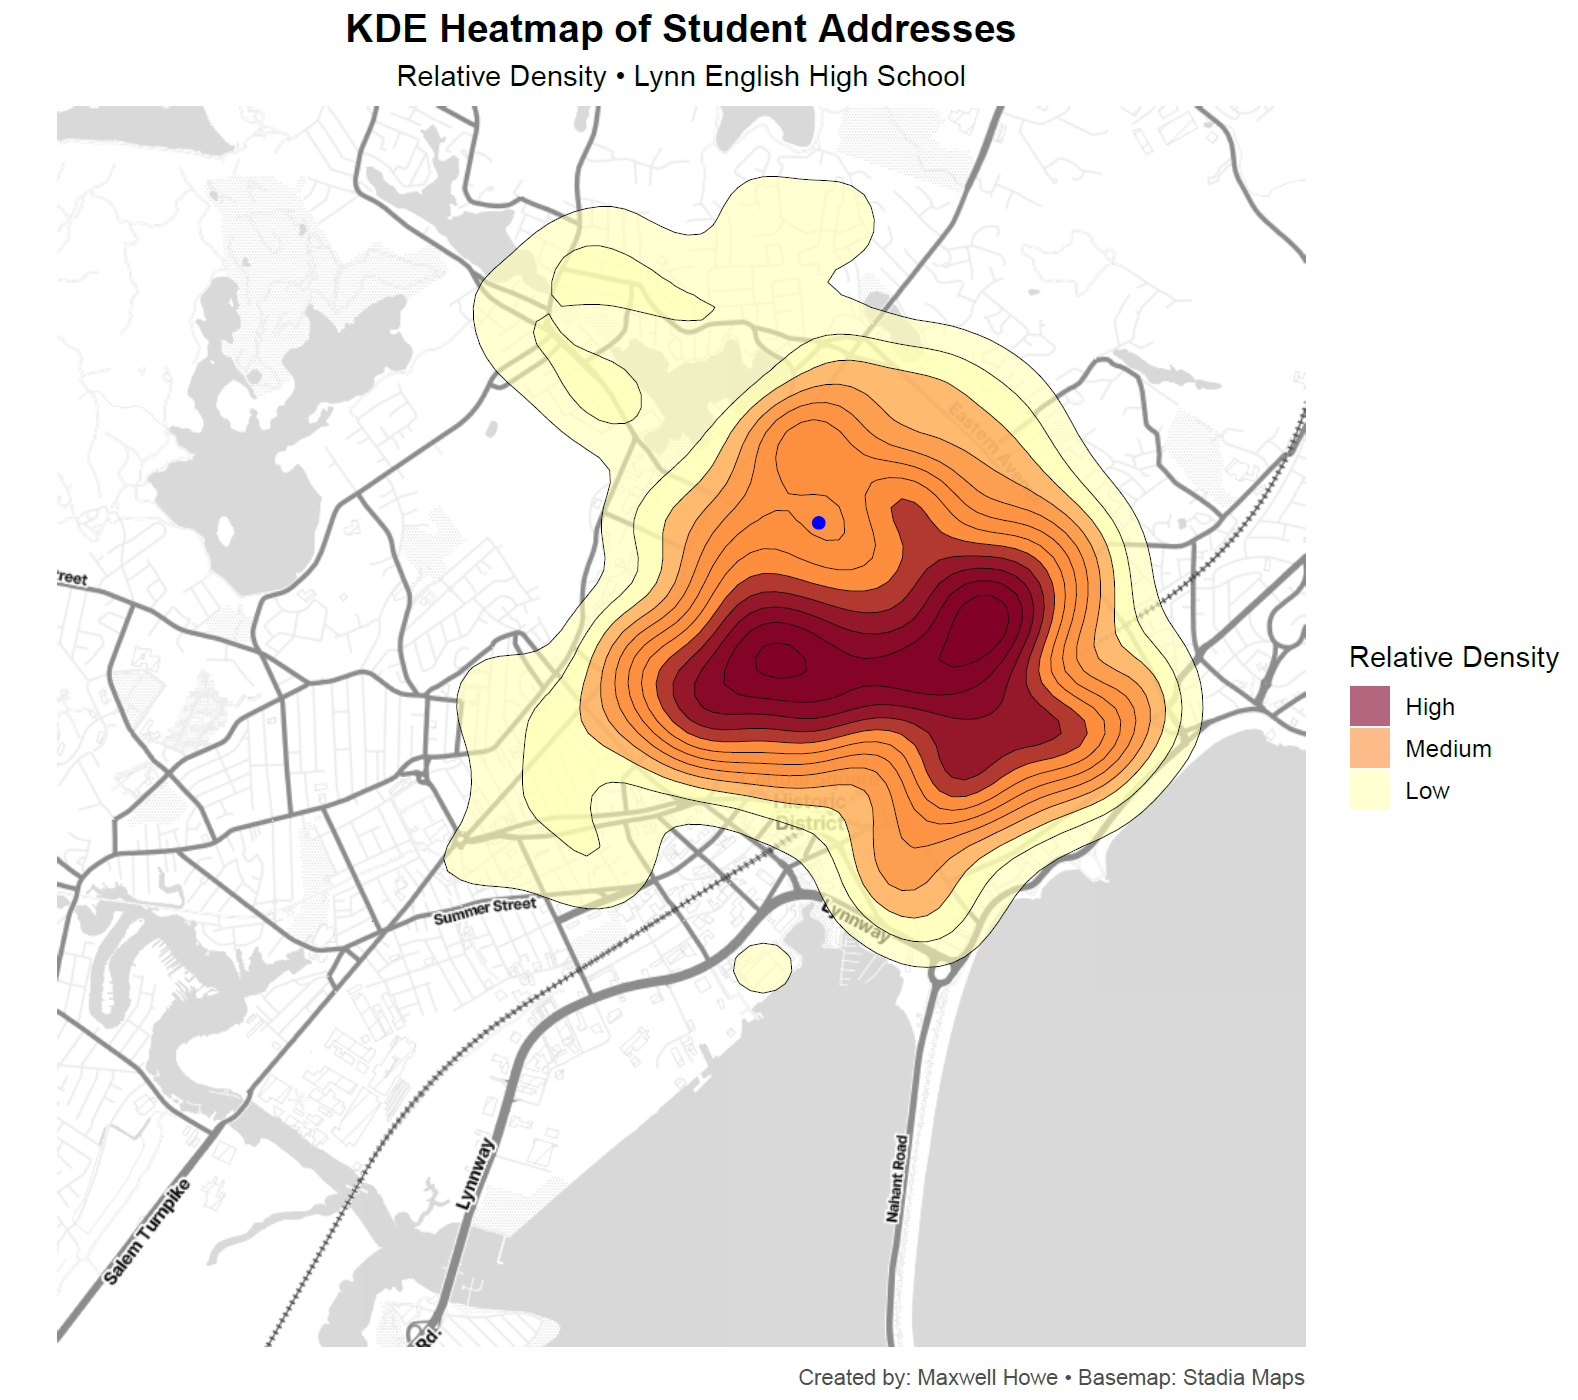
KDE heatmap of geocoded student addresses
Fig. 6KDE heatmap of geocoded student addresses
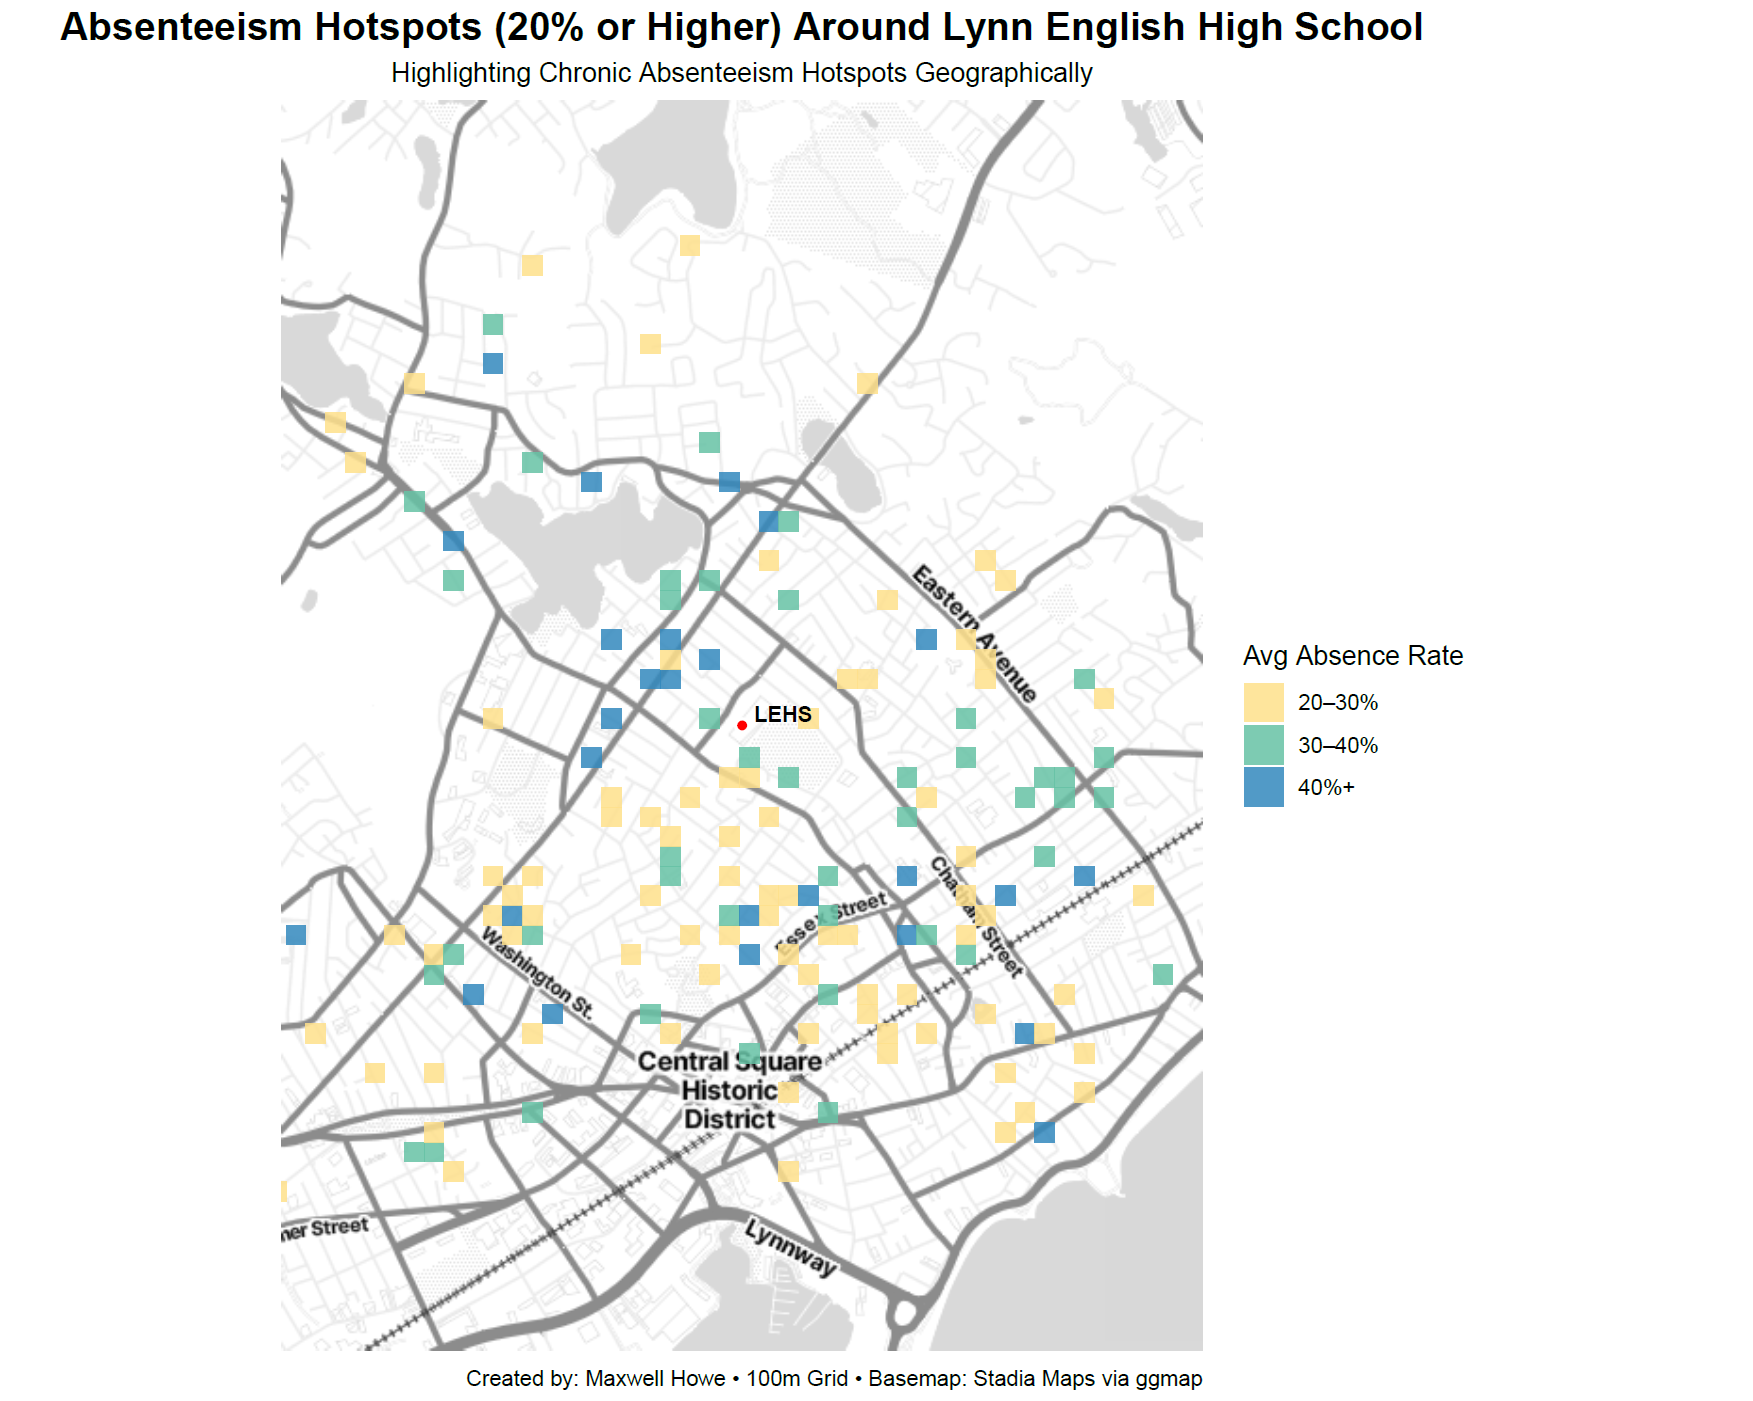
Absenteeism hotspots (≥20%) around LEHS
Fig. 7Absenteeism hotspots (≥20%) around LEHS
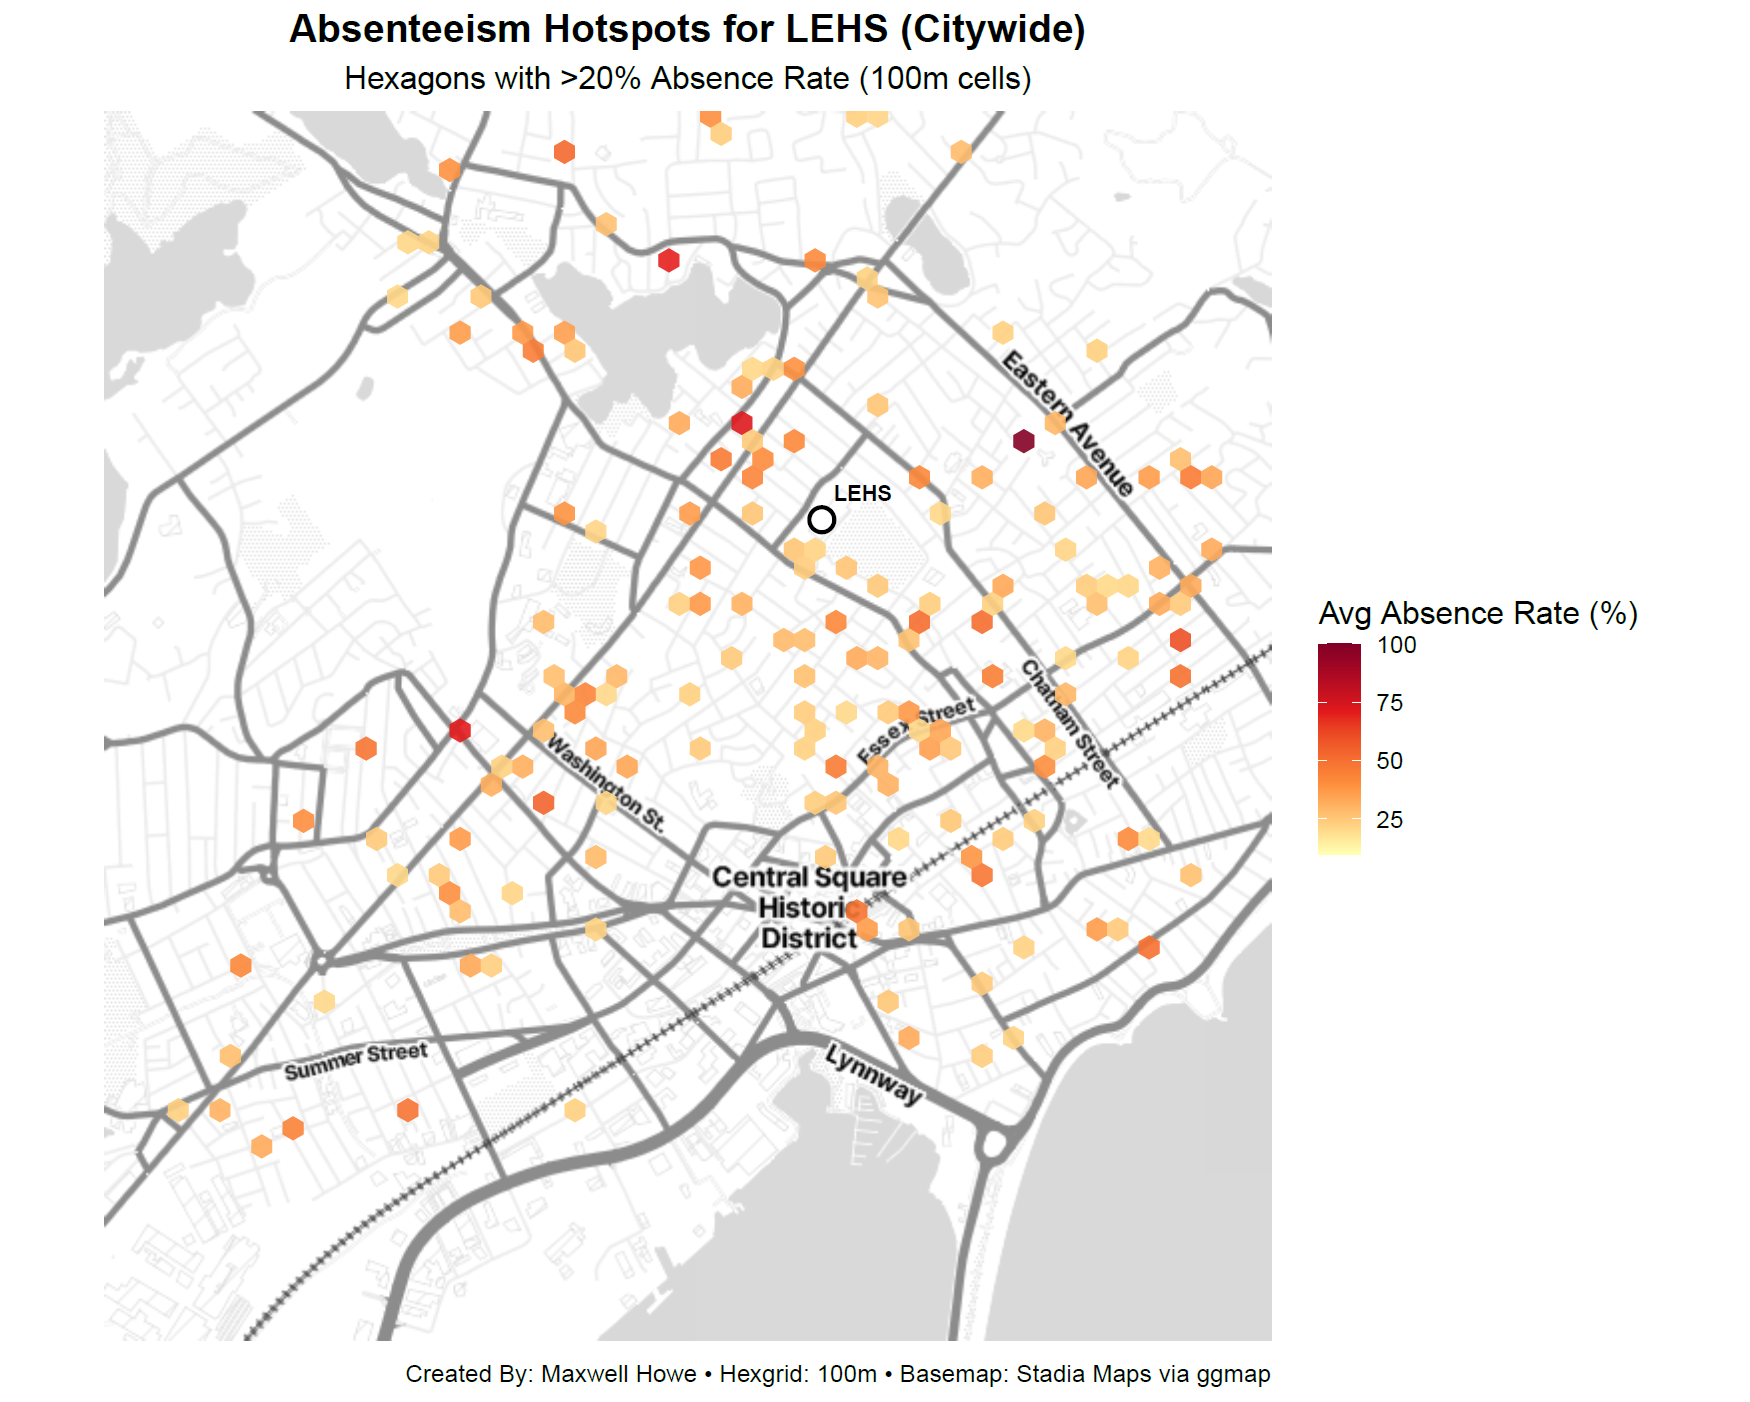
Citywide absenteeism hotspots — 100 m hexbins above 20%
Fig. 8Citywide absenteeism hotspots — 100 m hexbins above 20%
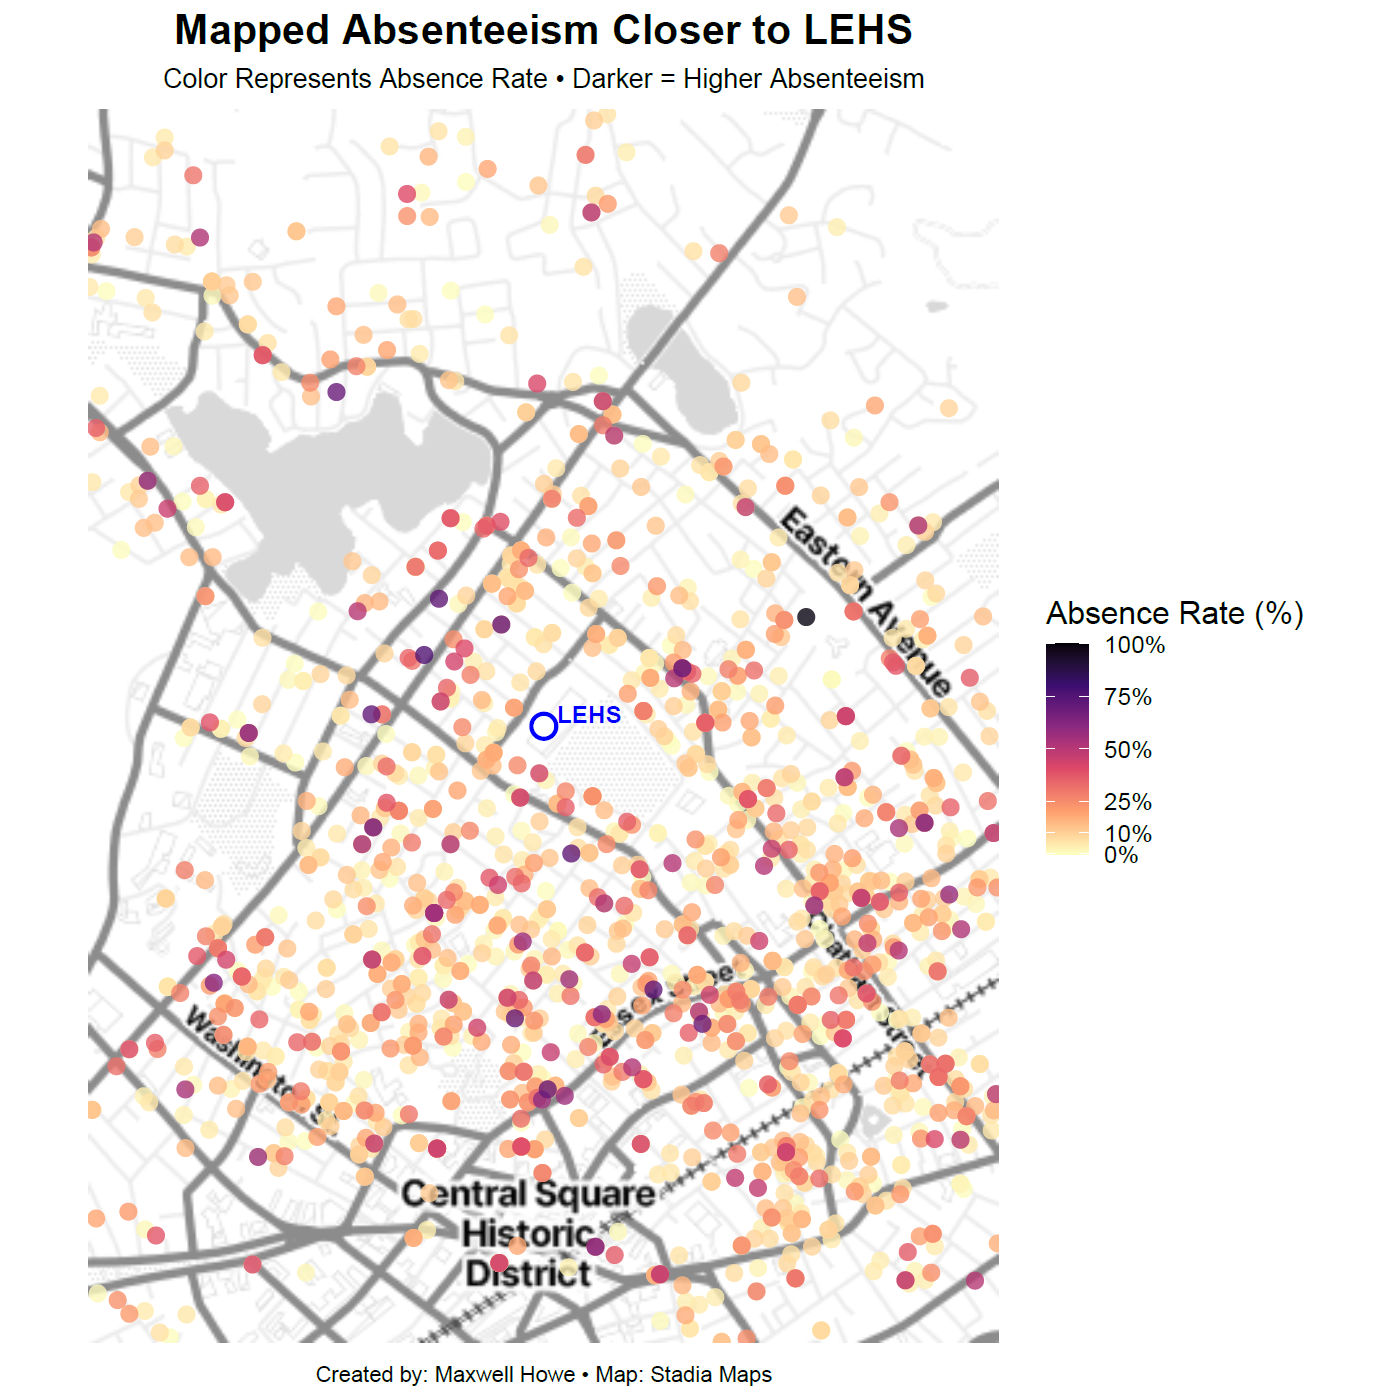
Close-up dot map — absence rate around Central Square
Fig. 9Close-up dot map — absence rate around Central Square
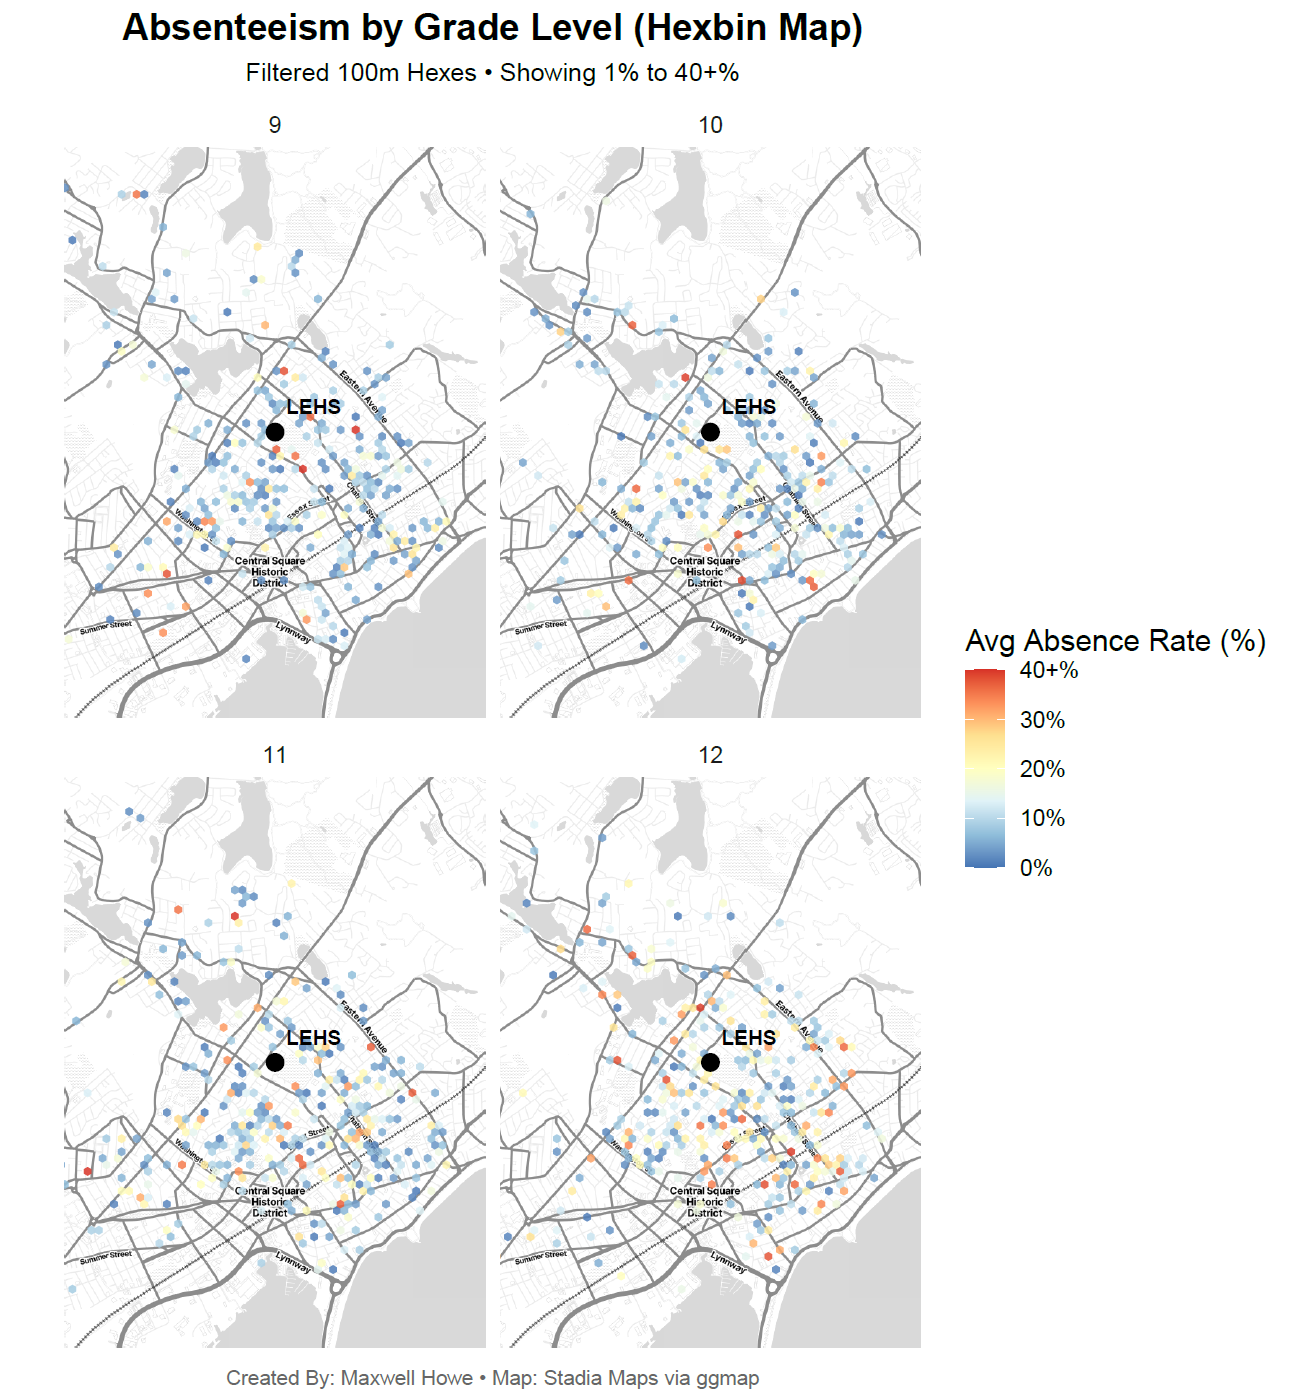
Absenteeism by grade level — four-panel small multiples (9–12)
Fig. 10Absenteeism by grade level — four-panel small multiples (9–12)
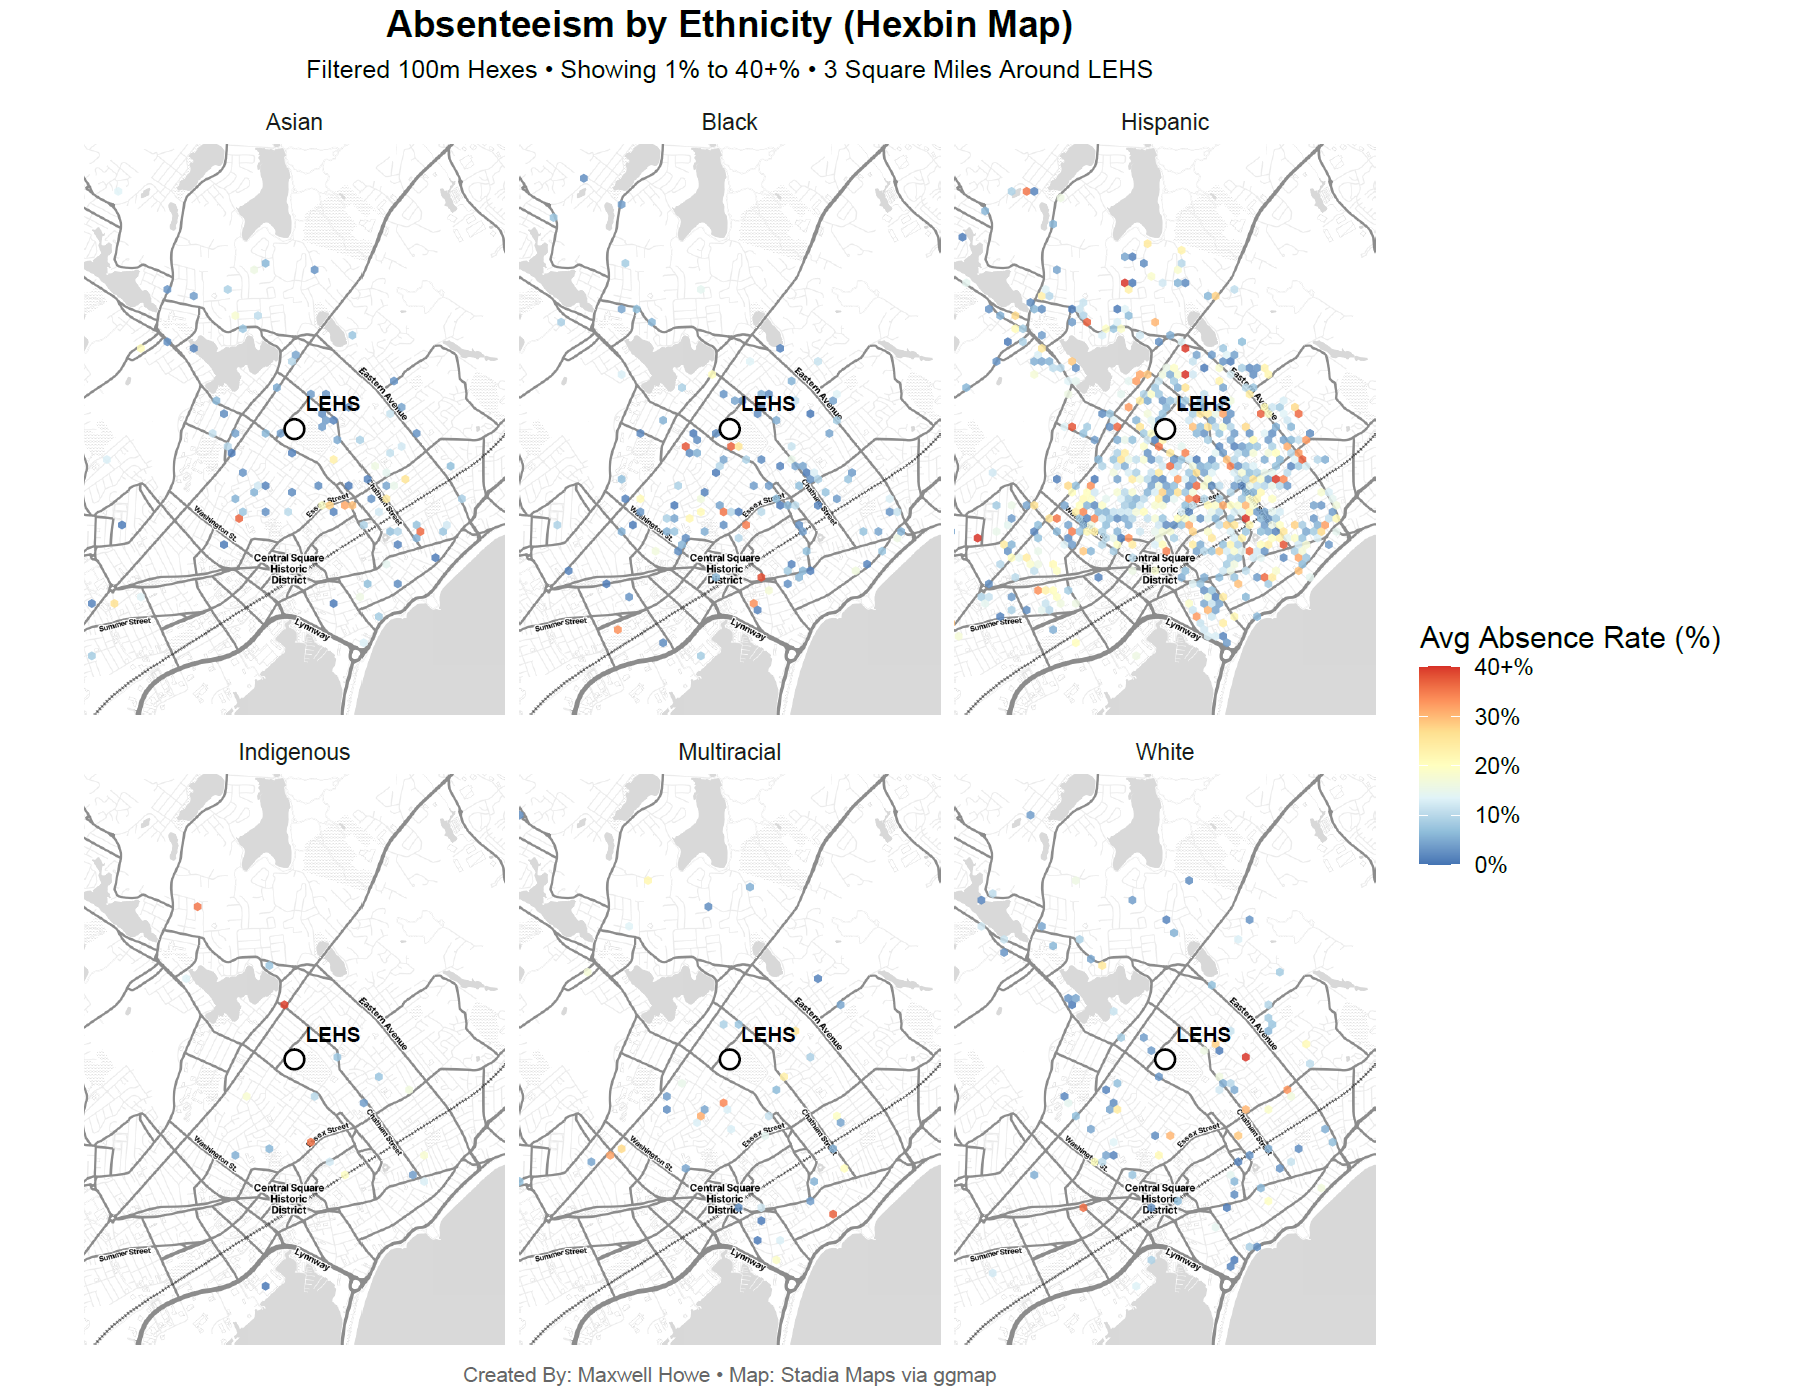
Absenteeism by ethnicity — six-panel small multiples
Fig. 11Absenteeism by ethnicity — six-panel small multiples
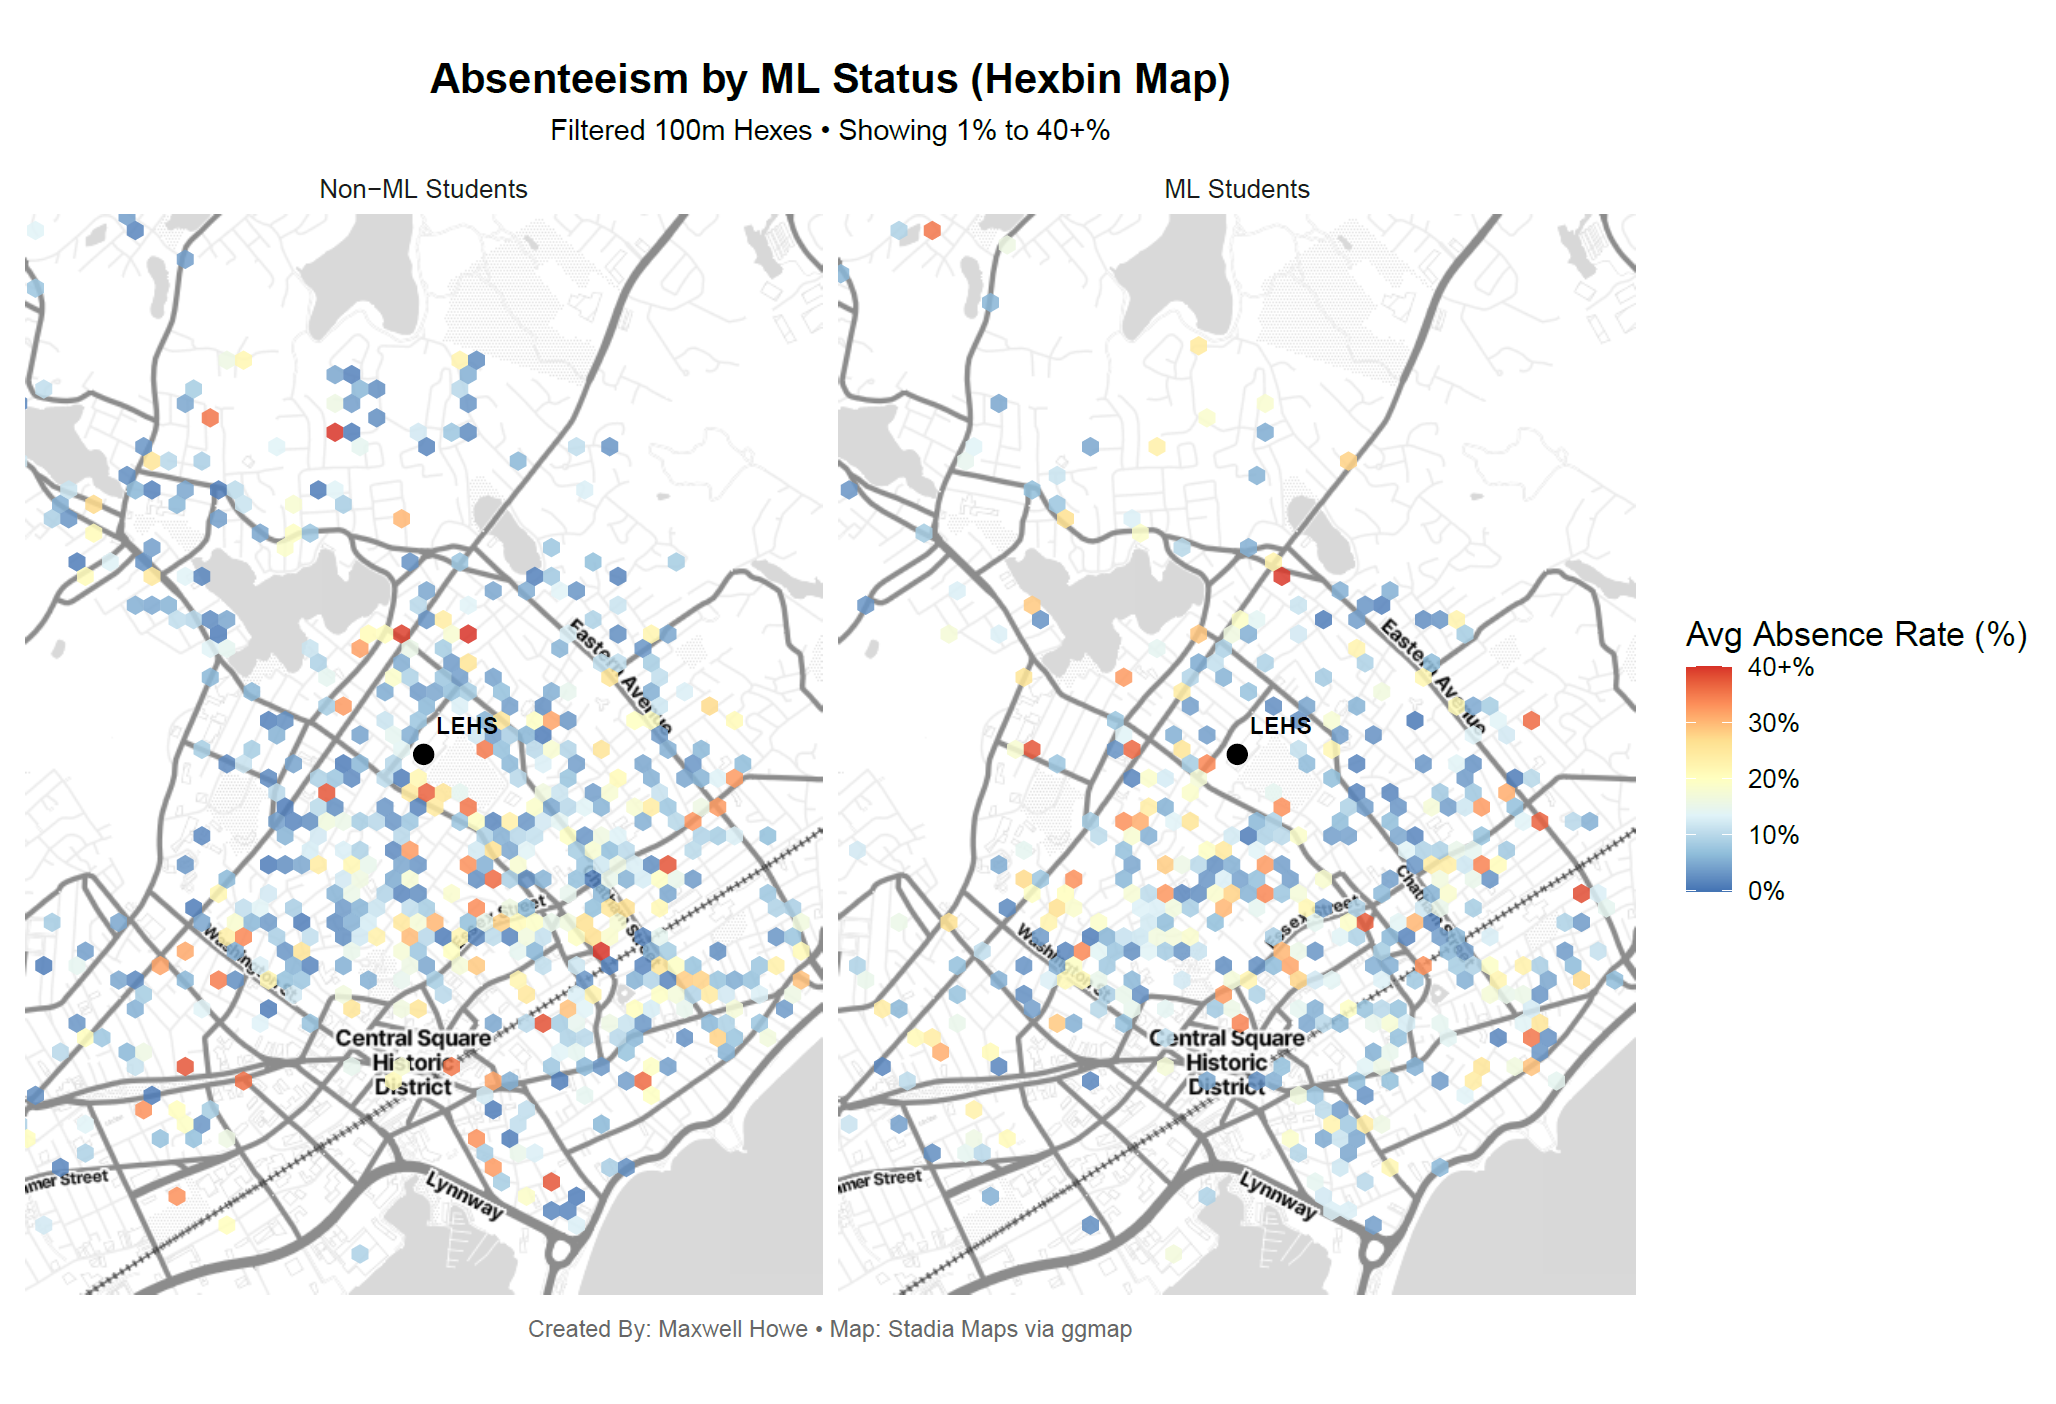
Absenteeism by Multilingual Learner status — ML vs non-ML
Fig. 12Absenteeism by Multilingual Learner status — ML vs non-ML
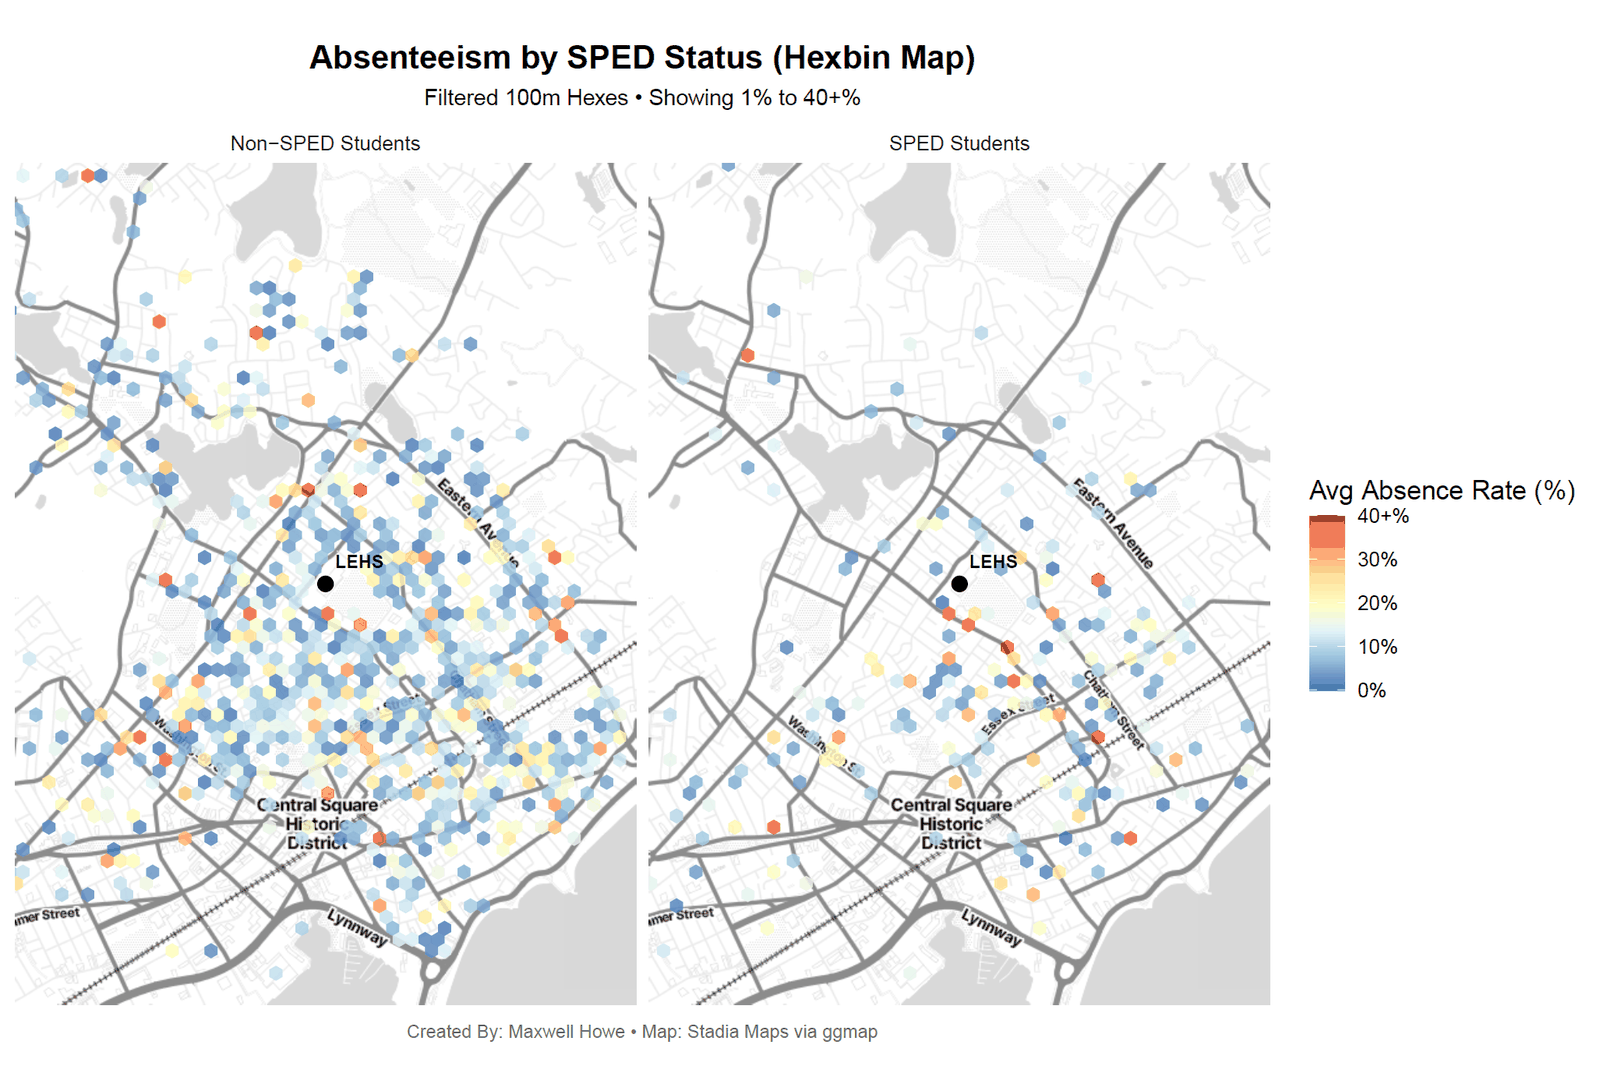
Absenteeism by SPED status — hexbin comparison
Fig. 13Absenteeism by SPED status — hexbin comparison