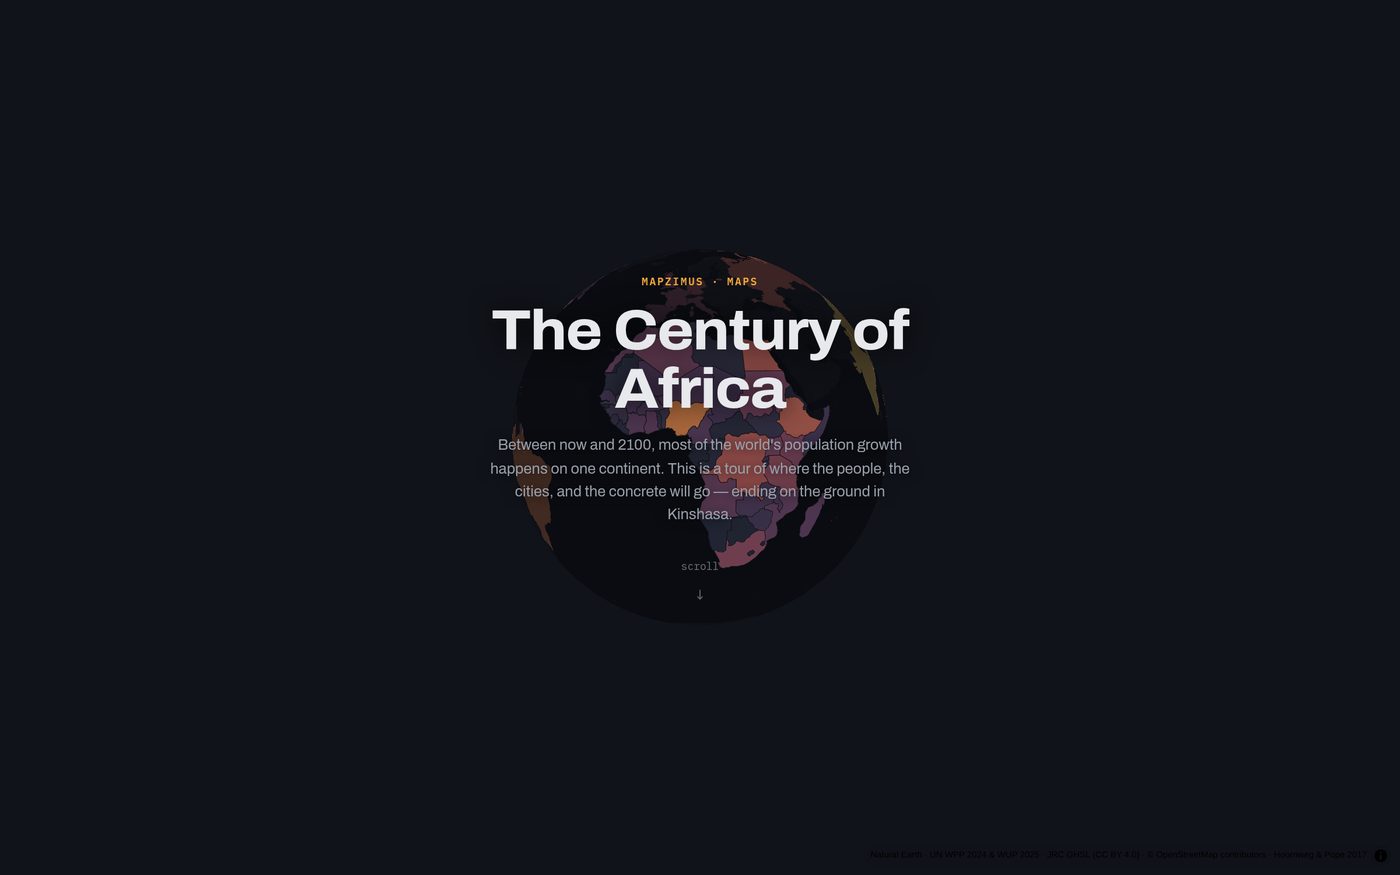
The Century of Africa
A scroll-driven MapLibre tour of Africa's population century: UN projections to 2100, megacities rising past every Western peer, the corridors they will need, and Kinshasa's growth on the ground from GHSL satellite epochs.
My role
I scoped the four-chapter story, built the Python data pipeline (countries, cities, corridors, Kinshasa GHSL and OSM context), designed the MapLibre globe layers and scroll-driven camera, and wrote the narrative copy and honesty notes that ship with the piece.
Approach
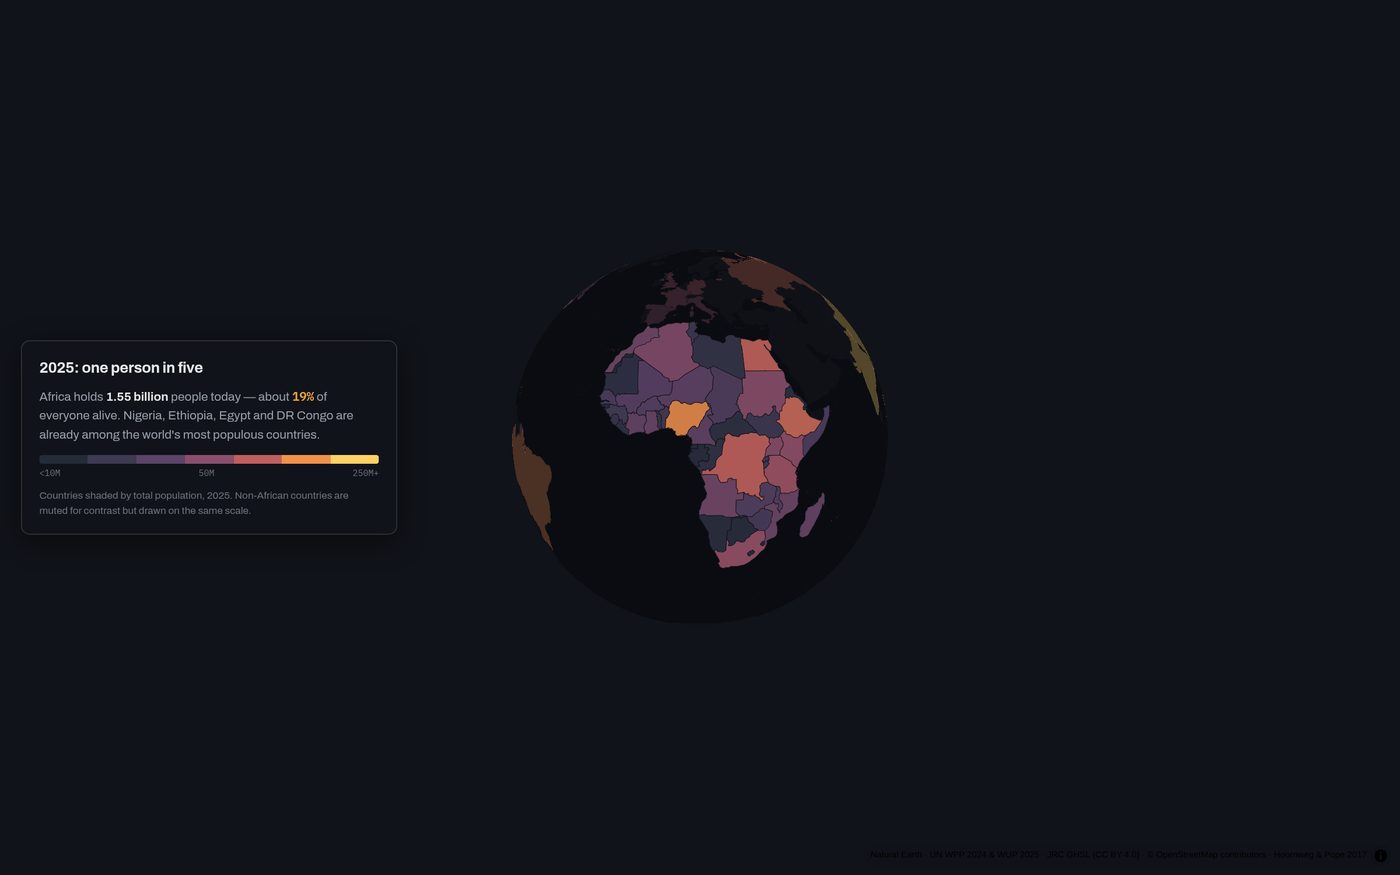
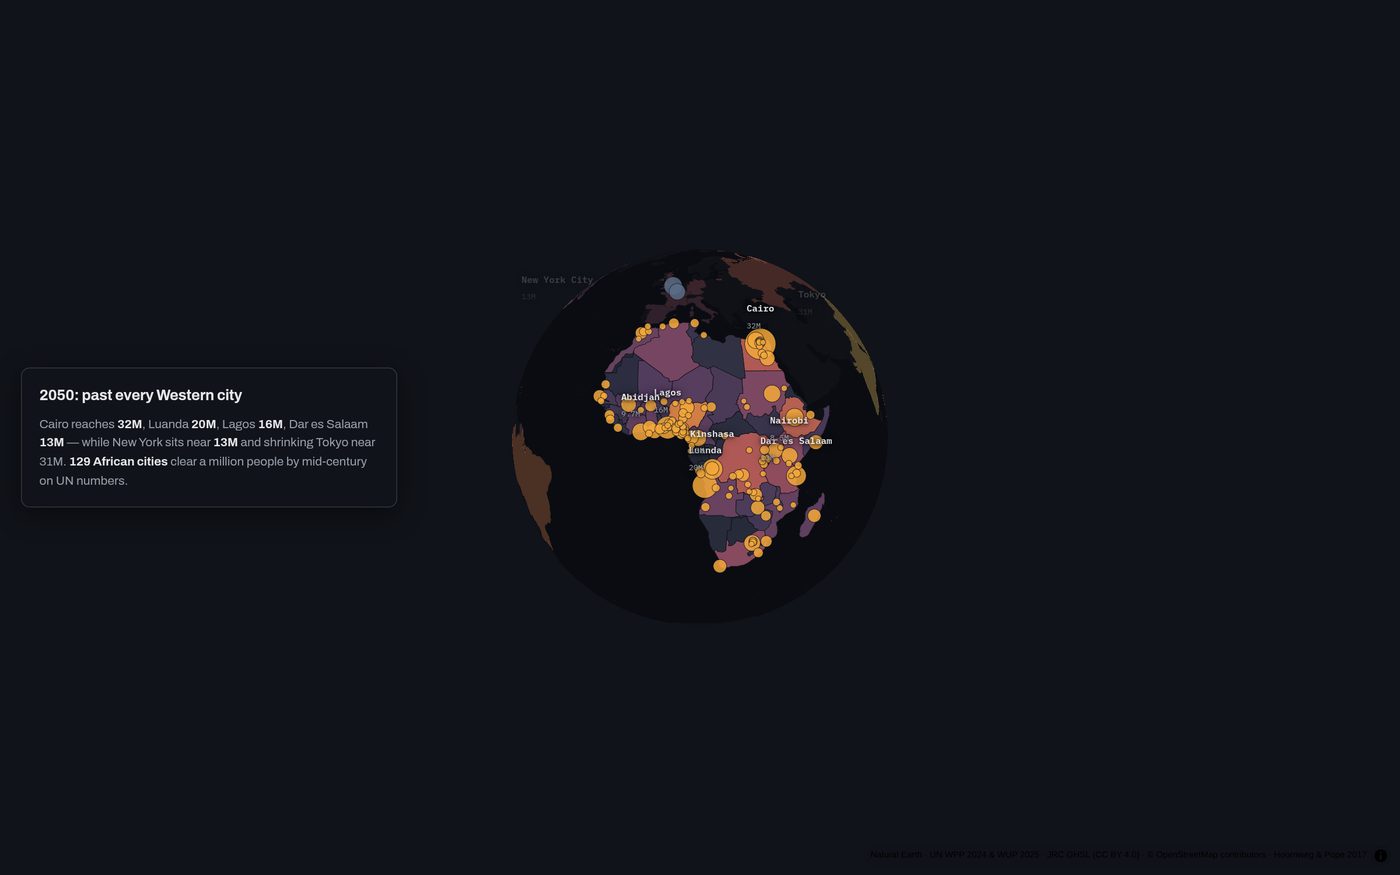
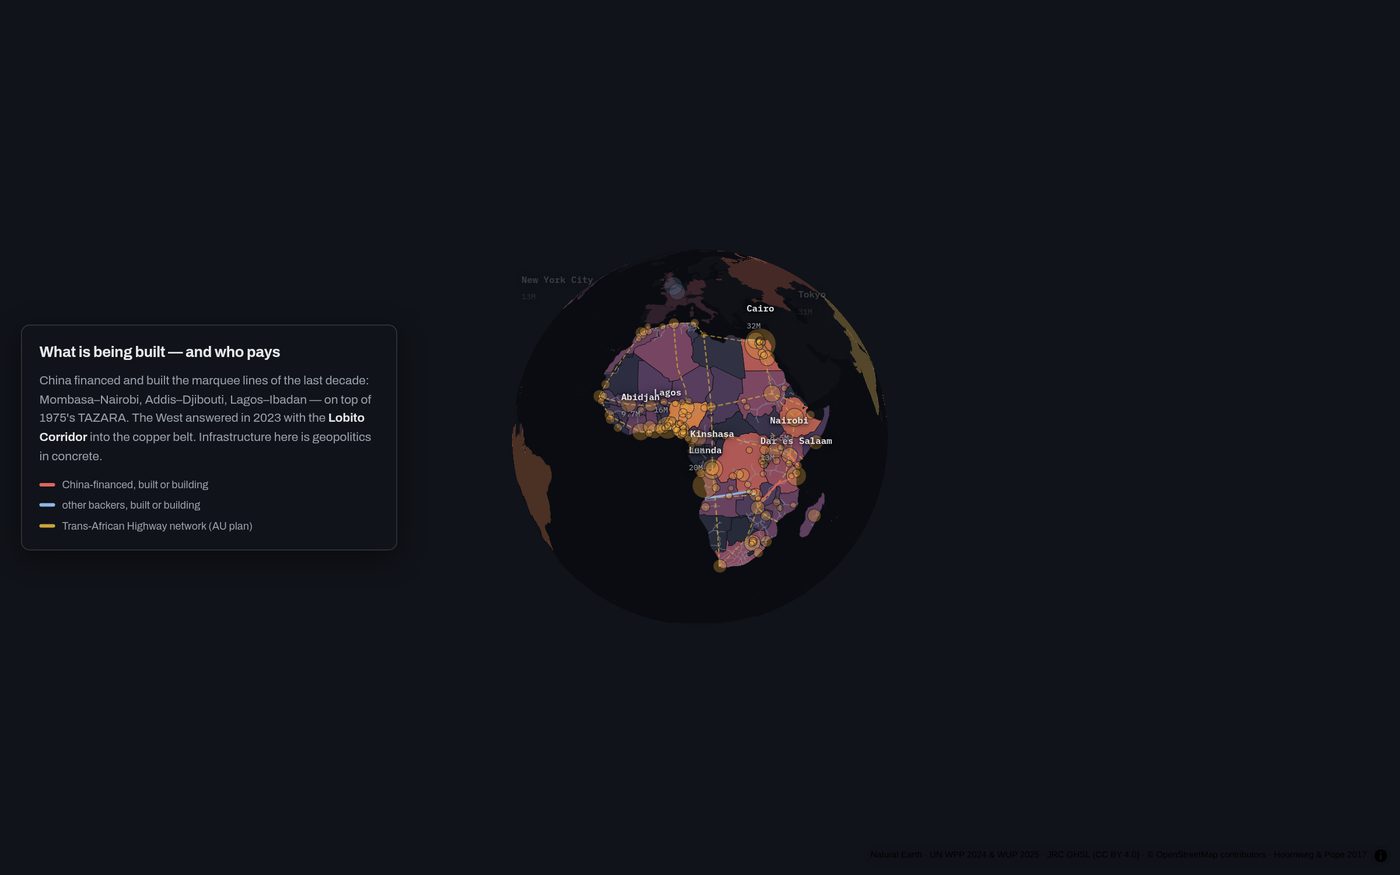
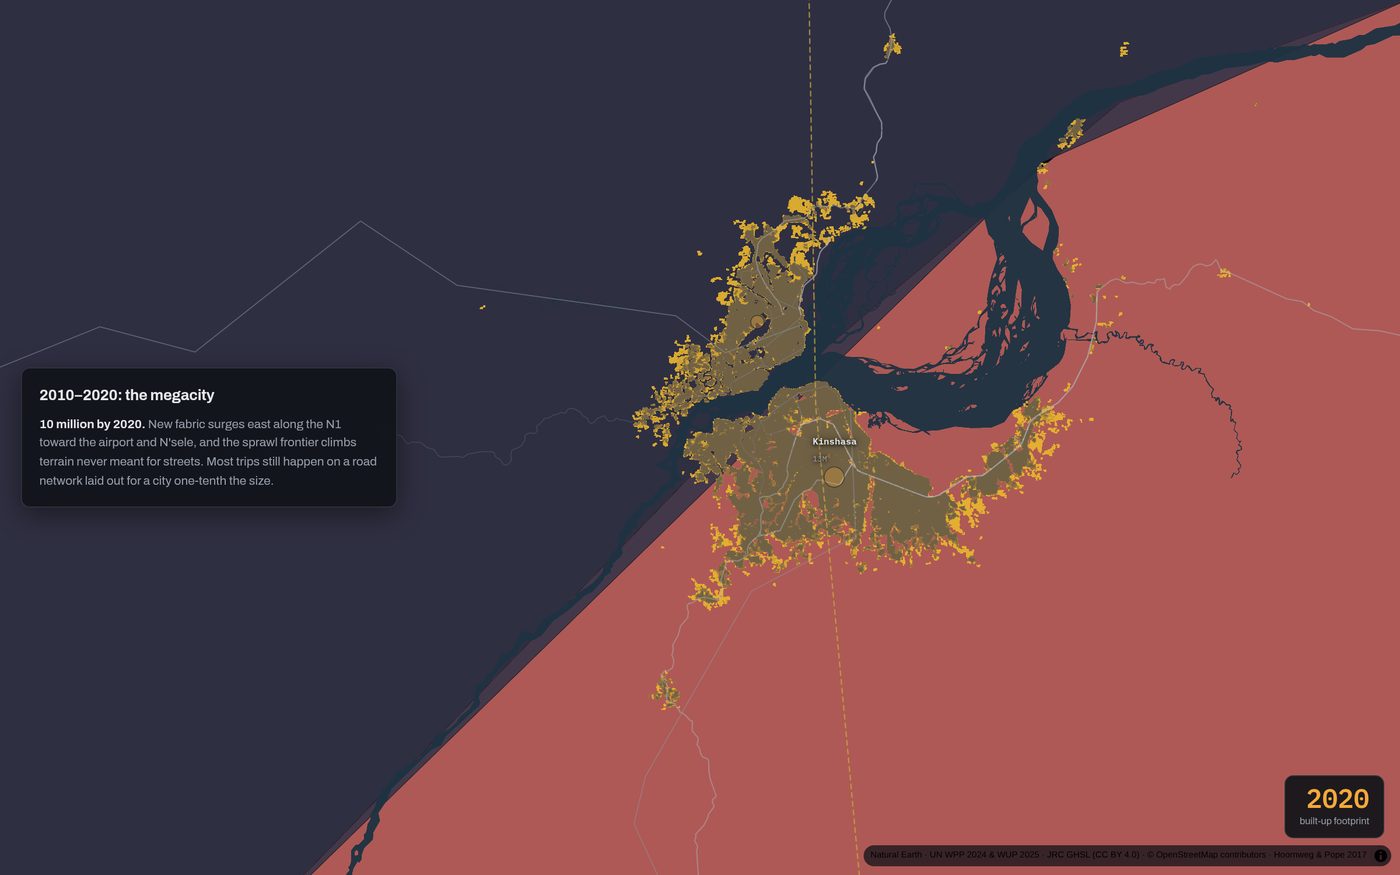
Between now and 2100, most of the world's population growth happens on one continent. The Century of Africa is a four-chapter scrollytelling globe with no backend and no tiles — index.html and app.js drive MapLibre over about 2 MB of committed GeoJSON. Chapter 1 steps a country choropleth from 2025 to 2100 to growth multiple, with an SVG regional-totals chart and computed overtaking years (the year an African country's population passes a Western peer on the UN medium variant). Chapter 2 animates every African agglomeration of a million or more by 2050 as proportional circles against New York, Tokyo, Paris, and London on the same scale, with 2100 outlooks drawn as hollow rings and flagged as academic projections. Chapter 3 layers existing Natural Earth rail and roads, financed lines (China's SGR/BRI railways versus the Lobito Corridor, plus the AU Trans-African Highway network), and a gravity model over the top-30 2050 cities sketching demanded corridors. Chapter 4 drops to Kinshasa: GHSL built-up epochs 1975–2030 stacked as growth-vintage rings over the Malebo Pool, with OSM river and roads. A five-script Python pipeline assembles the layers from Natural Earth, UN WPP/WUP, curated corridor projects, JRC GHS-BUILT-S, and Overpass — and the story states its honesty notes up front: medium-variant paths, schematic corridor geometry, and model-derived built footprints.
Result
A self-contained scrollytelling map that walks from continental population change to megacity growth, infrastructure geopolitics, and street-level Kinshasa fabric — live at mapzimus.com/lab with every layer reproducible from open sources.
Figures