One map a day for November, each on a set theme. I’m keeping mine in New England. 7 of 30 are finished as of November 12. Click any map for the full-size version.
Numbered in red: finished, links to the map. Grey: not posted yet.
Day 1 · Points
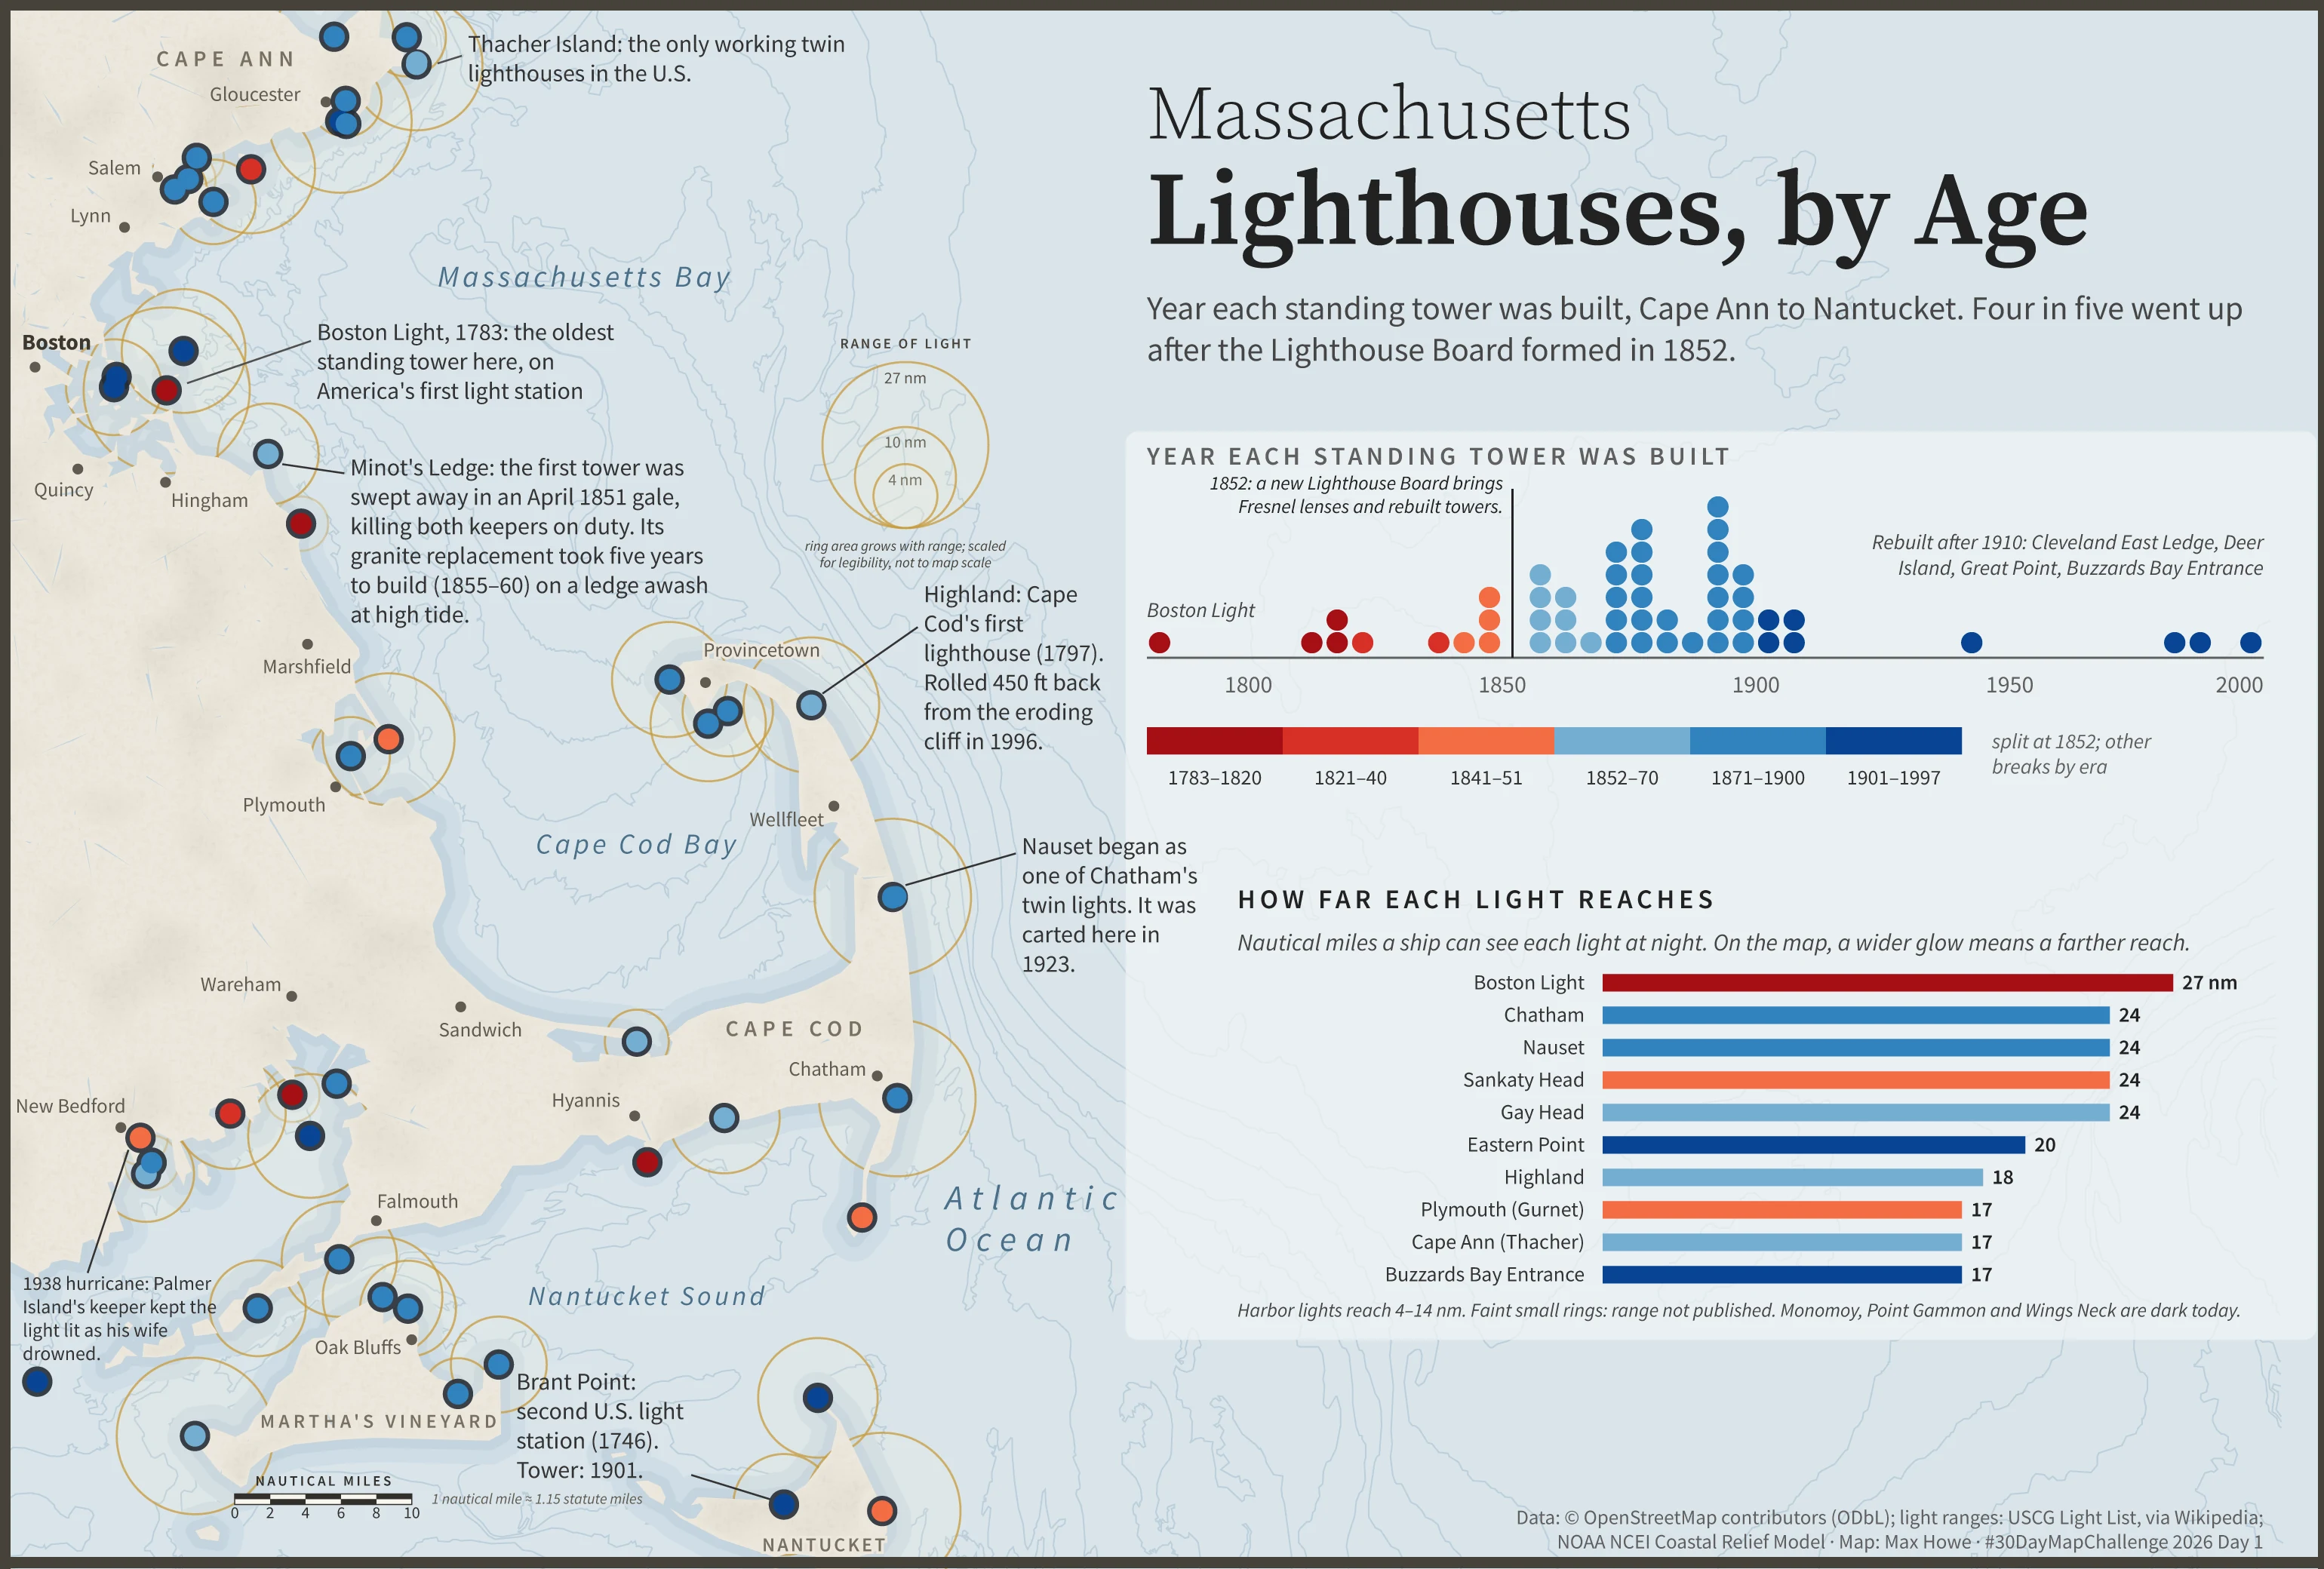
Massachusetts Lighthouses, by Age
Every standing lighthouse tower on the Massachusetts coast, Cape Ann to Nantucket, colored by the year it was built. Four in five went up after the Lighthouse Board formed in 1852. The glow around each light is how far it reaches.
Data: OpenStreetMap contributors (ODbL), USCG Light List Made with: QGIS, Illustrator
Day 2 · Lines
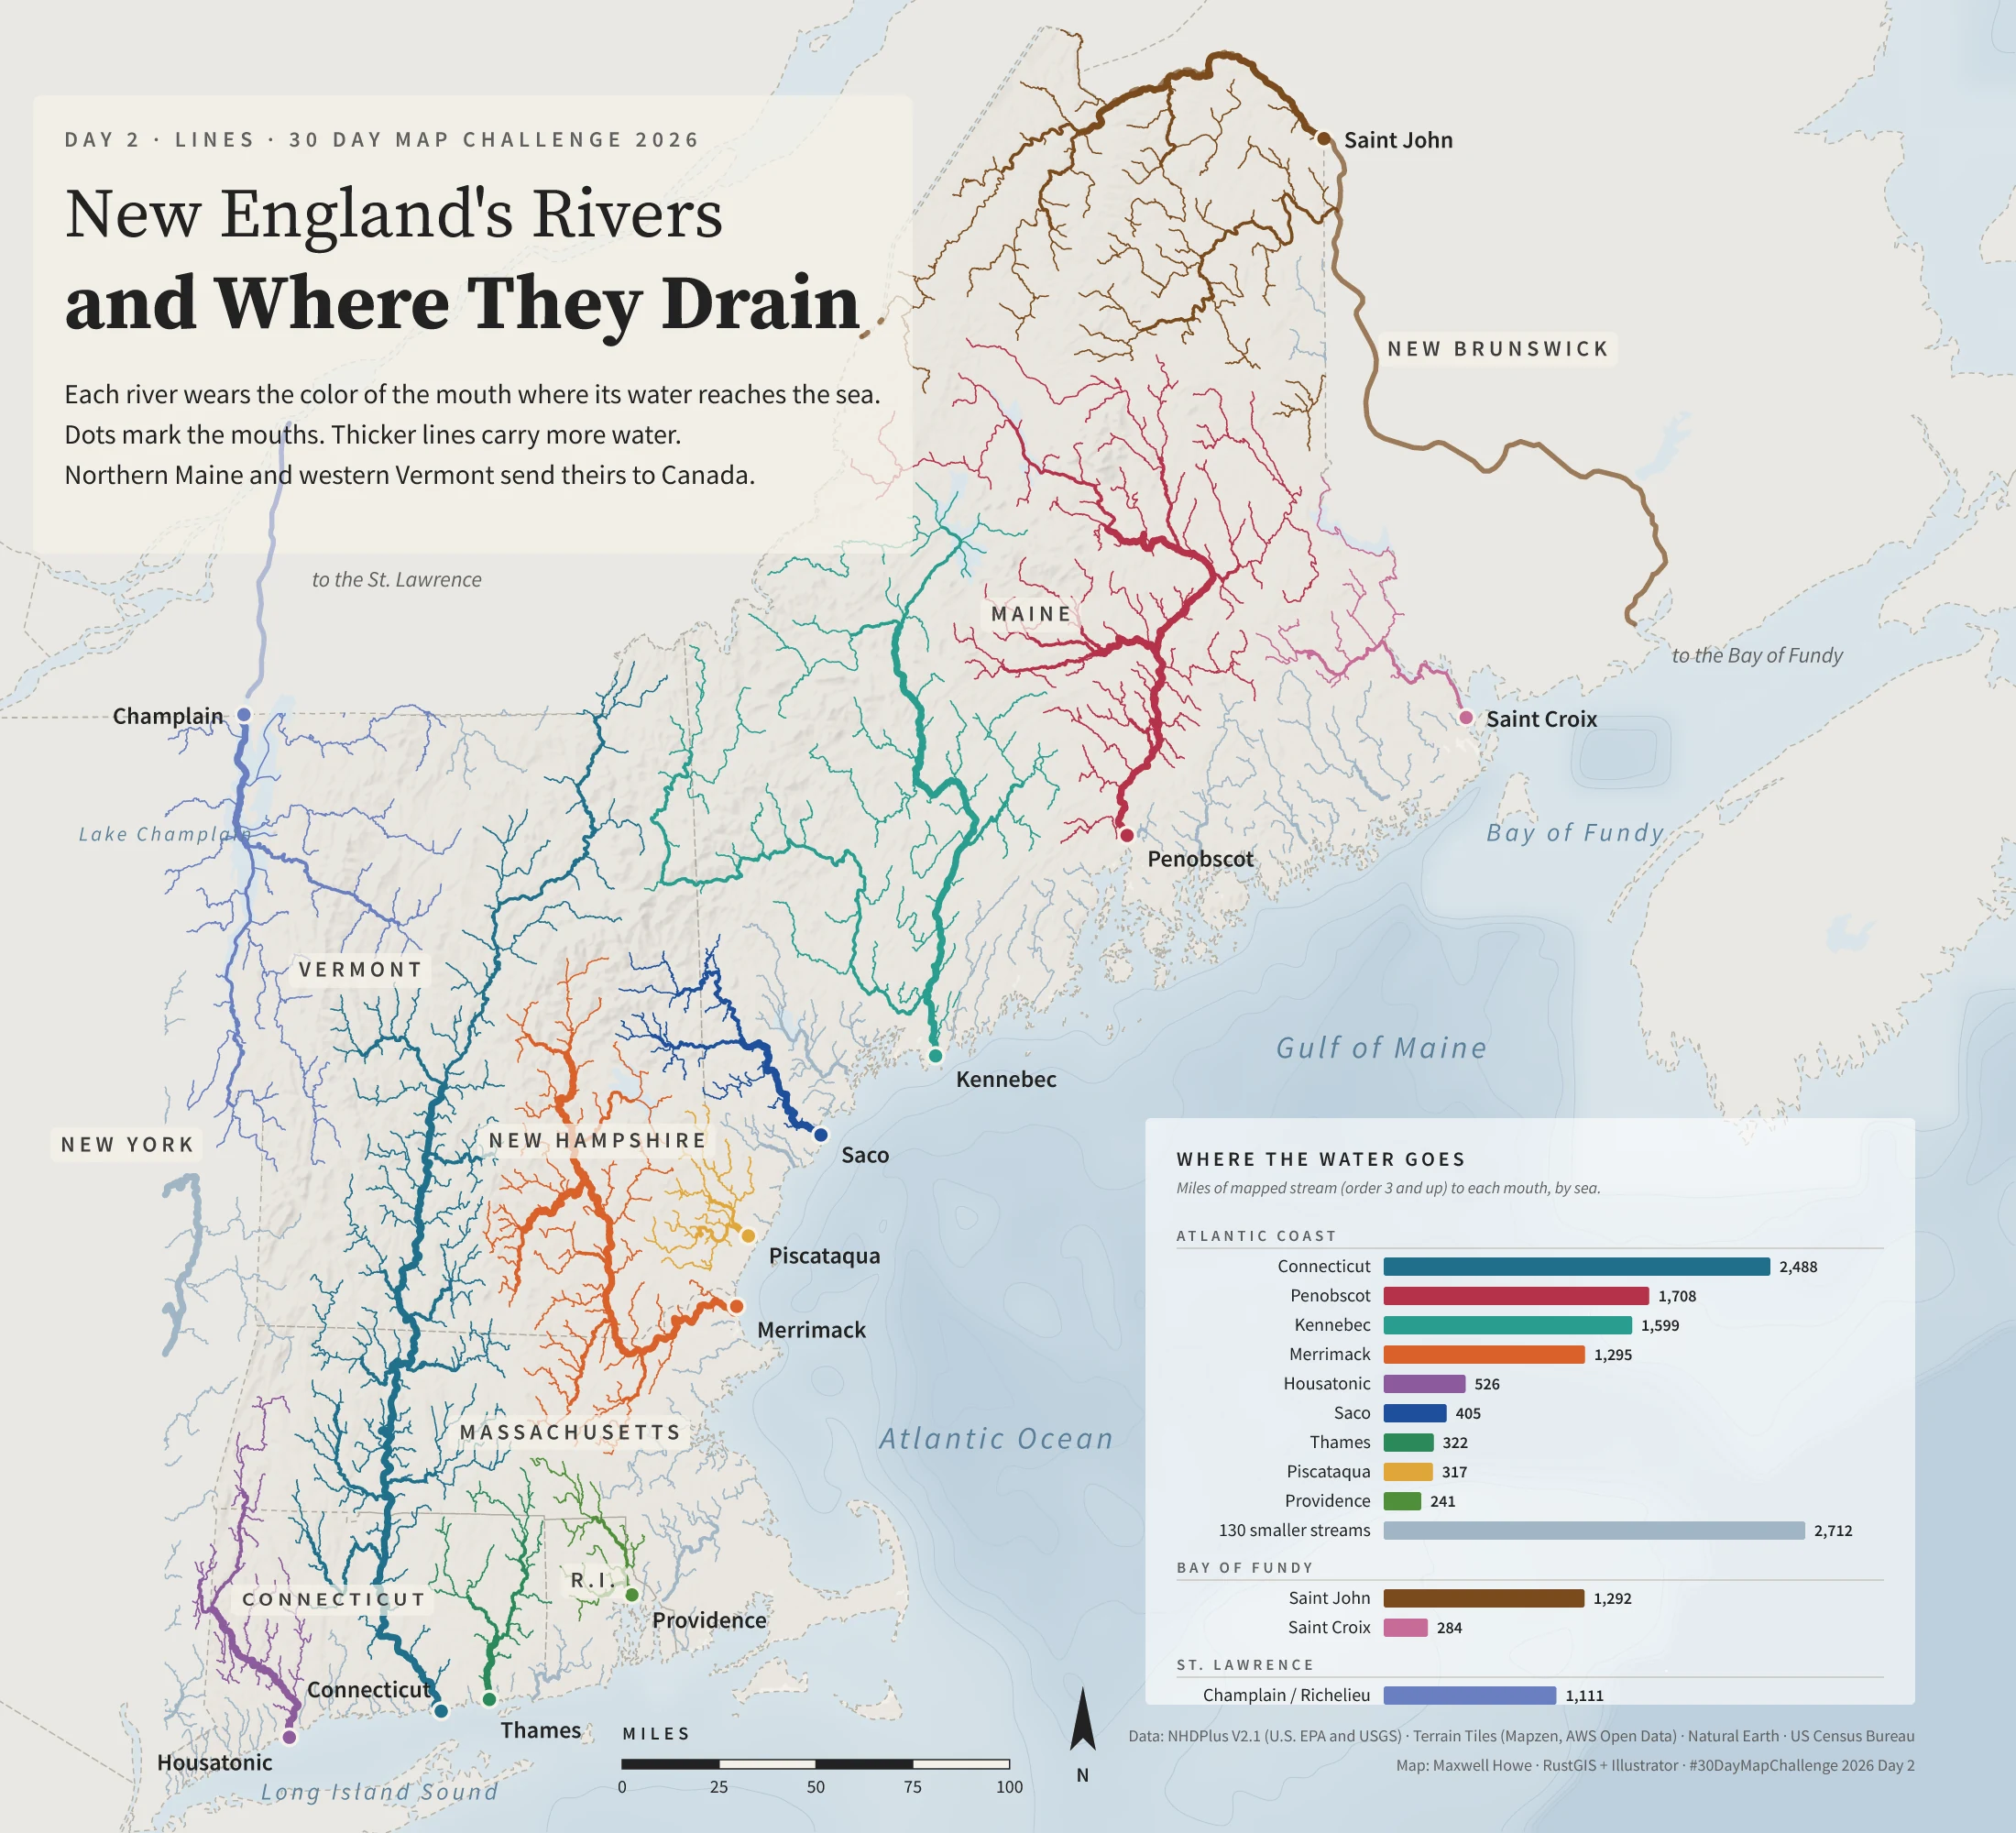
New England’s Rivers and Where They Drain
Every stream of Strahler order 3 and up, colored by the river system it belongs to. The 12 biggest networks get a color each, and about 130 small coastal streams share one pale blue. Line width follows stream order. The Saint John and Champlain networks cross into Canada before they reach the sea.
Data: NHDPlus V2.1 (U.S. EPA and USGS), Terrain Tiles, Natural Earth, US Census Bureau Made with: RustGIS, Python, Illustrator
Day 3 · Polygons
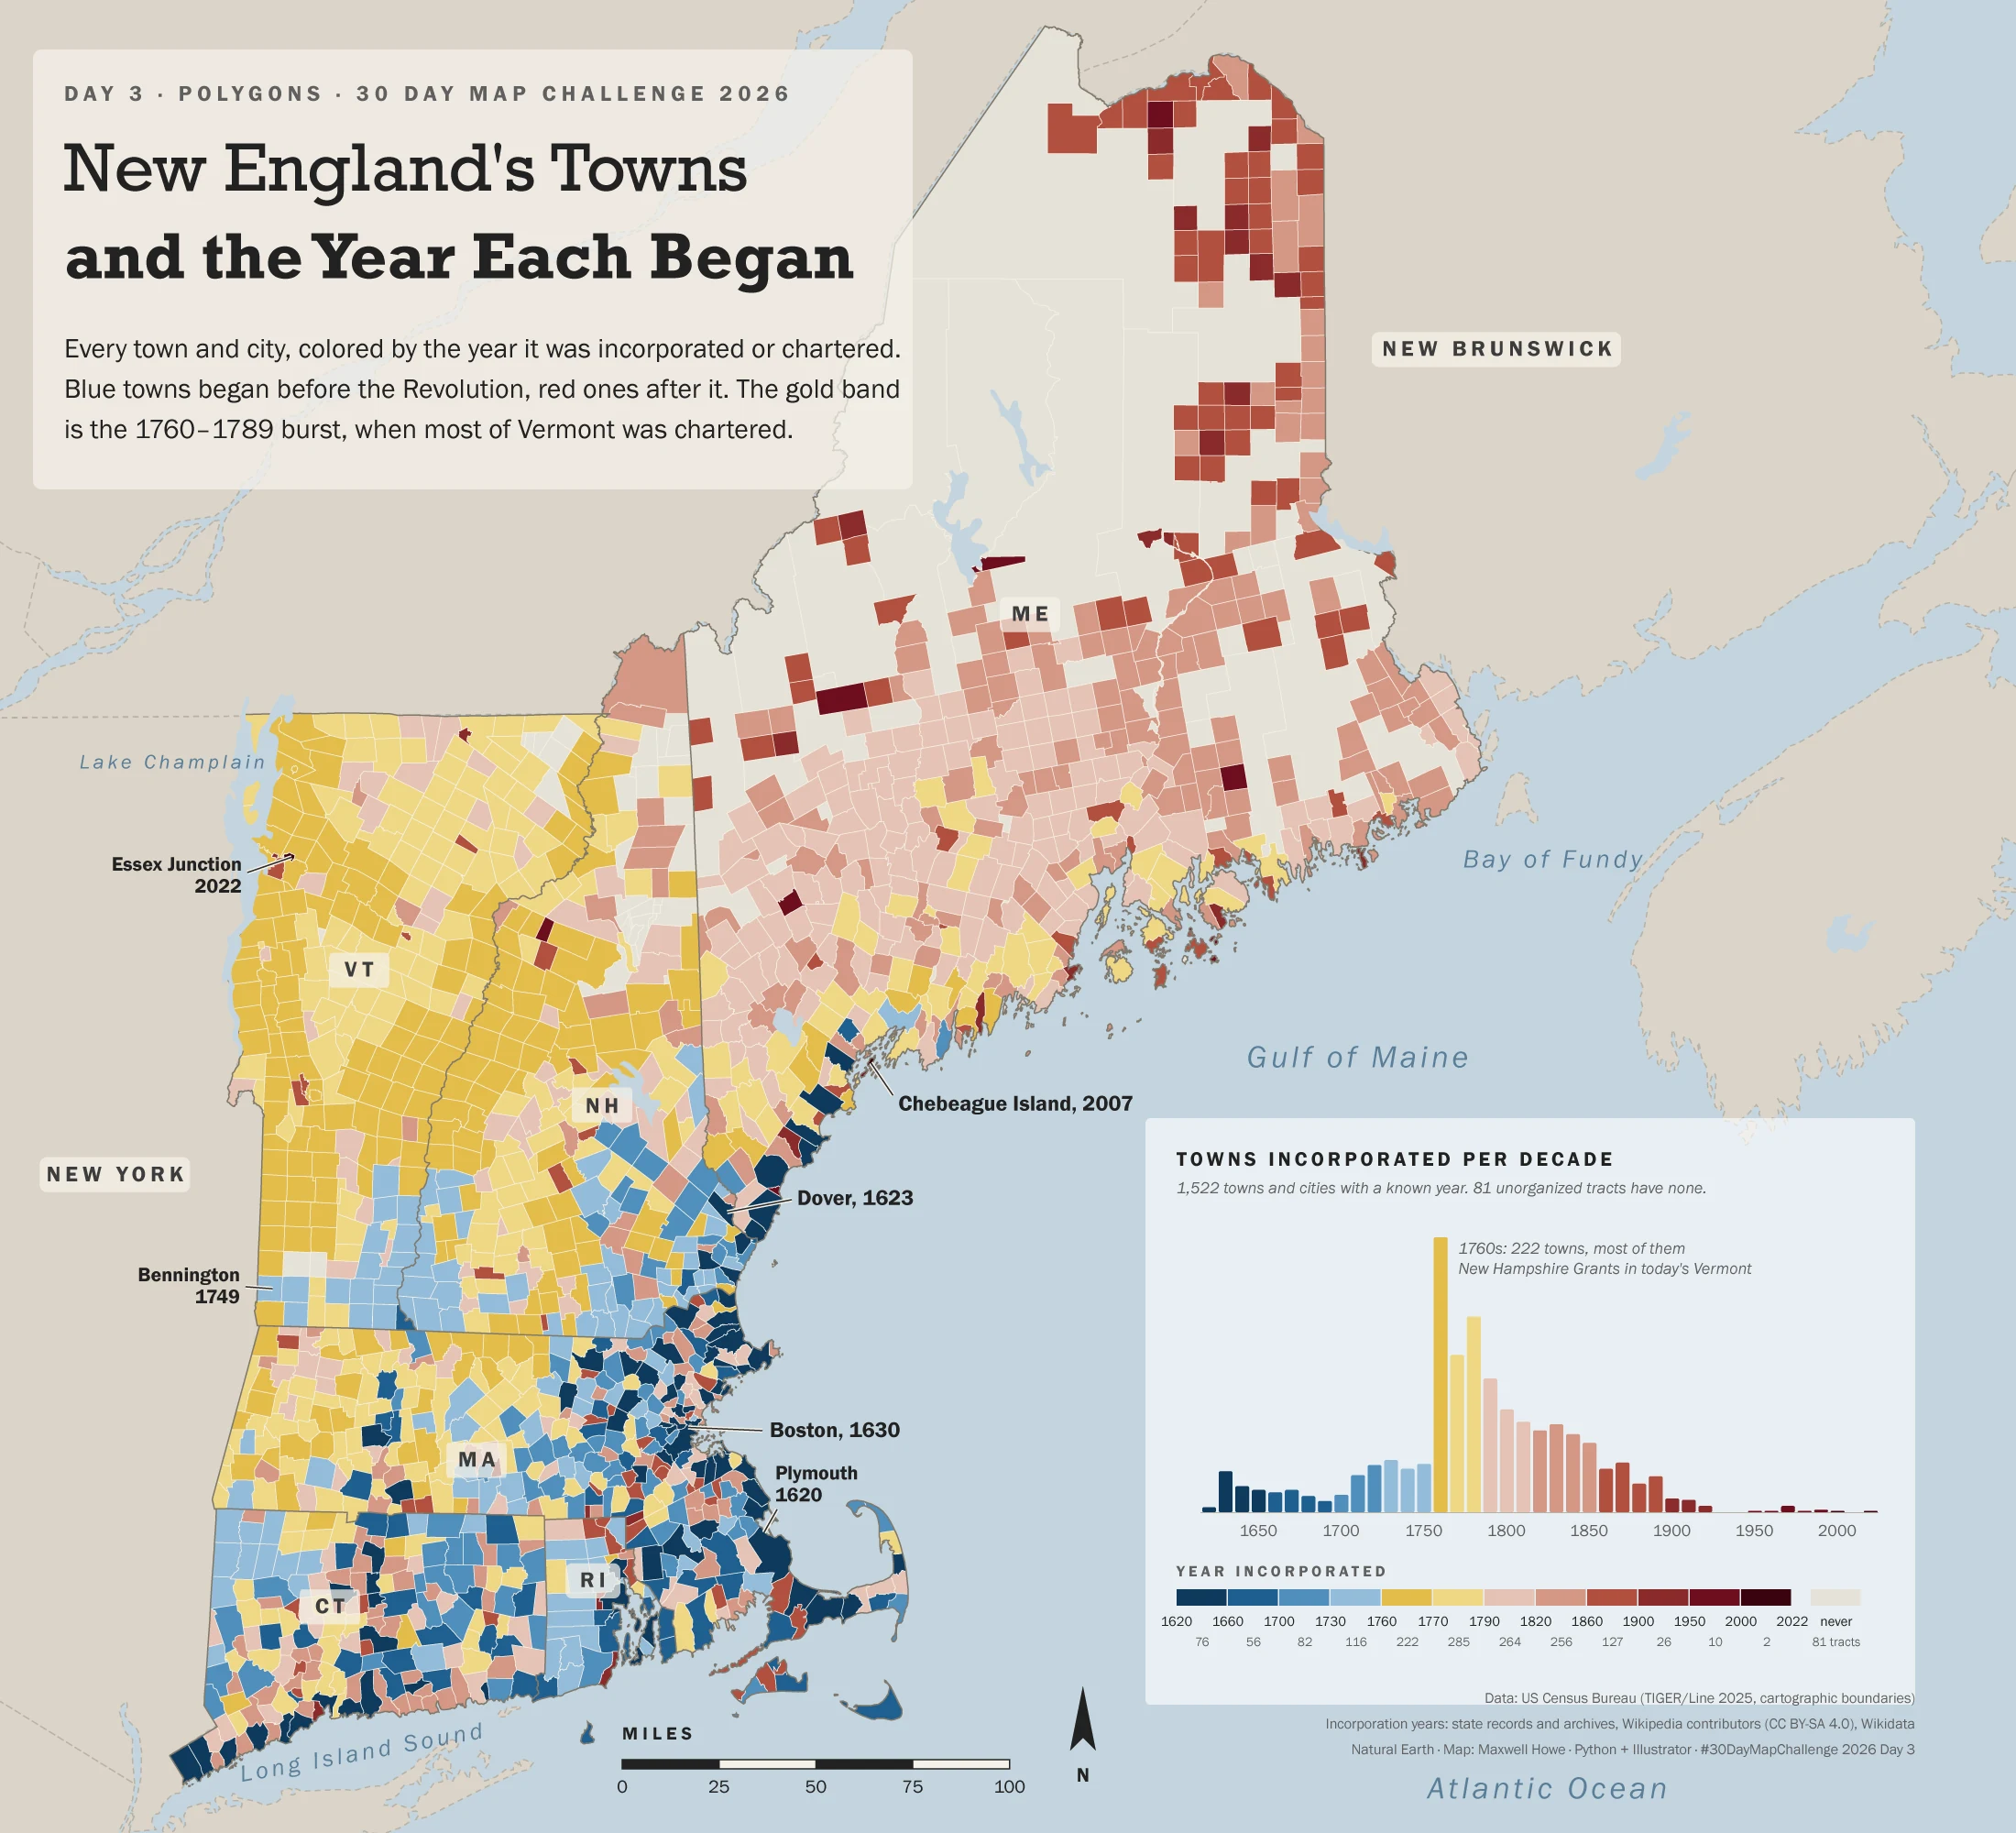
New England’s Towns and the Year Each Began
1,522 towns and cities colored by the year each was first chartered or incorporated. Blue towns came before the Revolution and red ones after. Gold is 1760 to 1789, when most of Vermont was chartered. The 81 grey areas are townships and gores that never incorporated. A commenter caught Providence showing its 1832 city charter, so I checked every date against a second source and fixed the ones using the wrong definition.
Data: US Census TIGER/Line 2025, Wikipedia municipality lists (CC BY-SA), Vermont charter records Made with: Python, Illustrator
Day 4 · Clusters
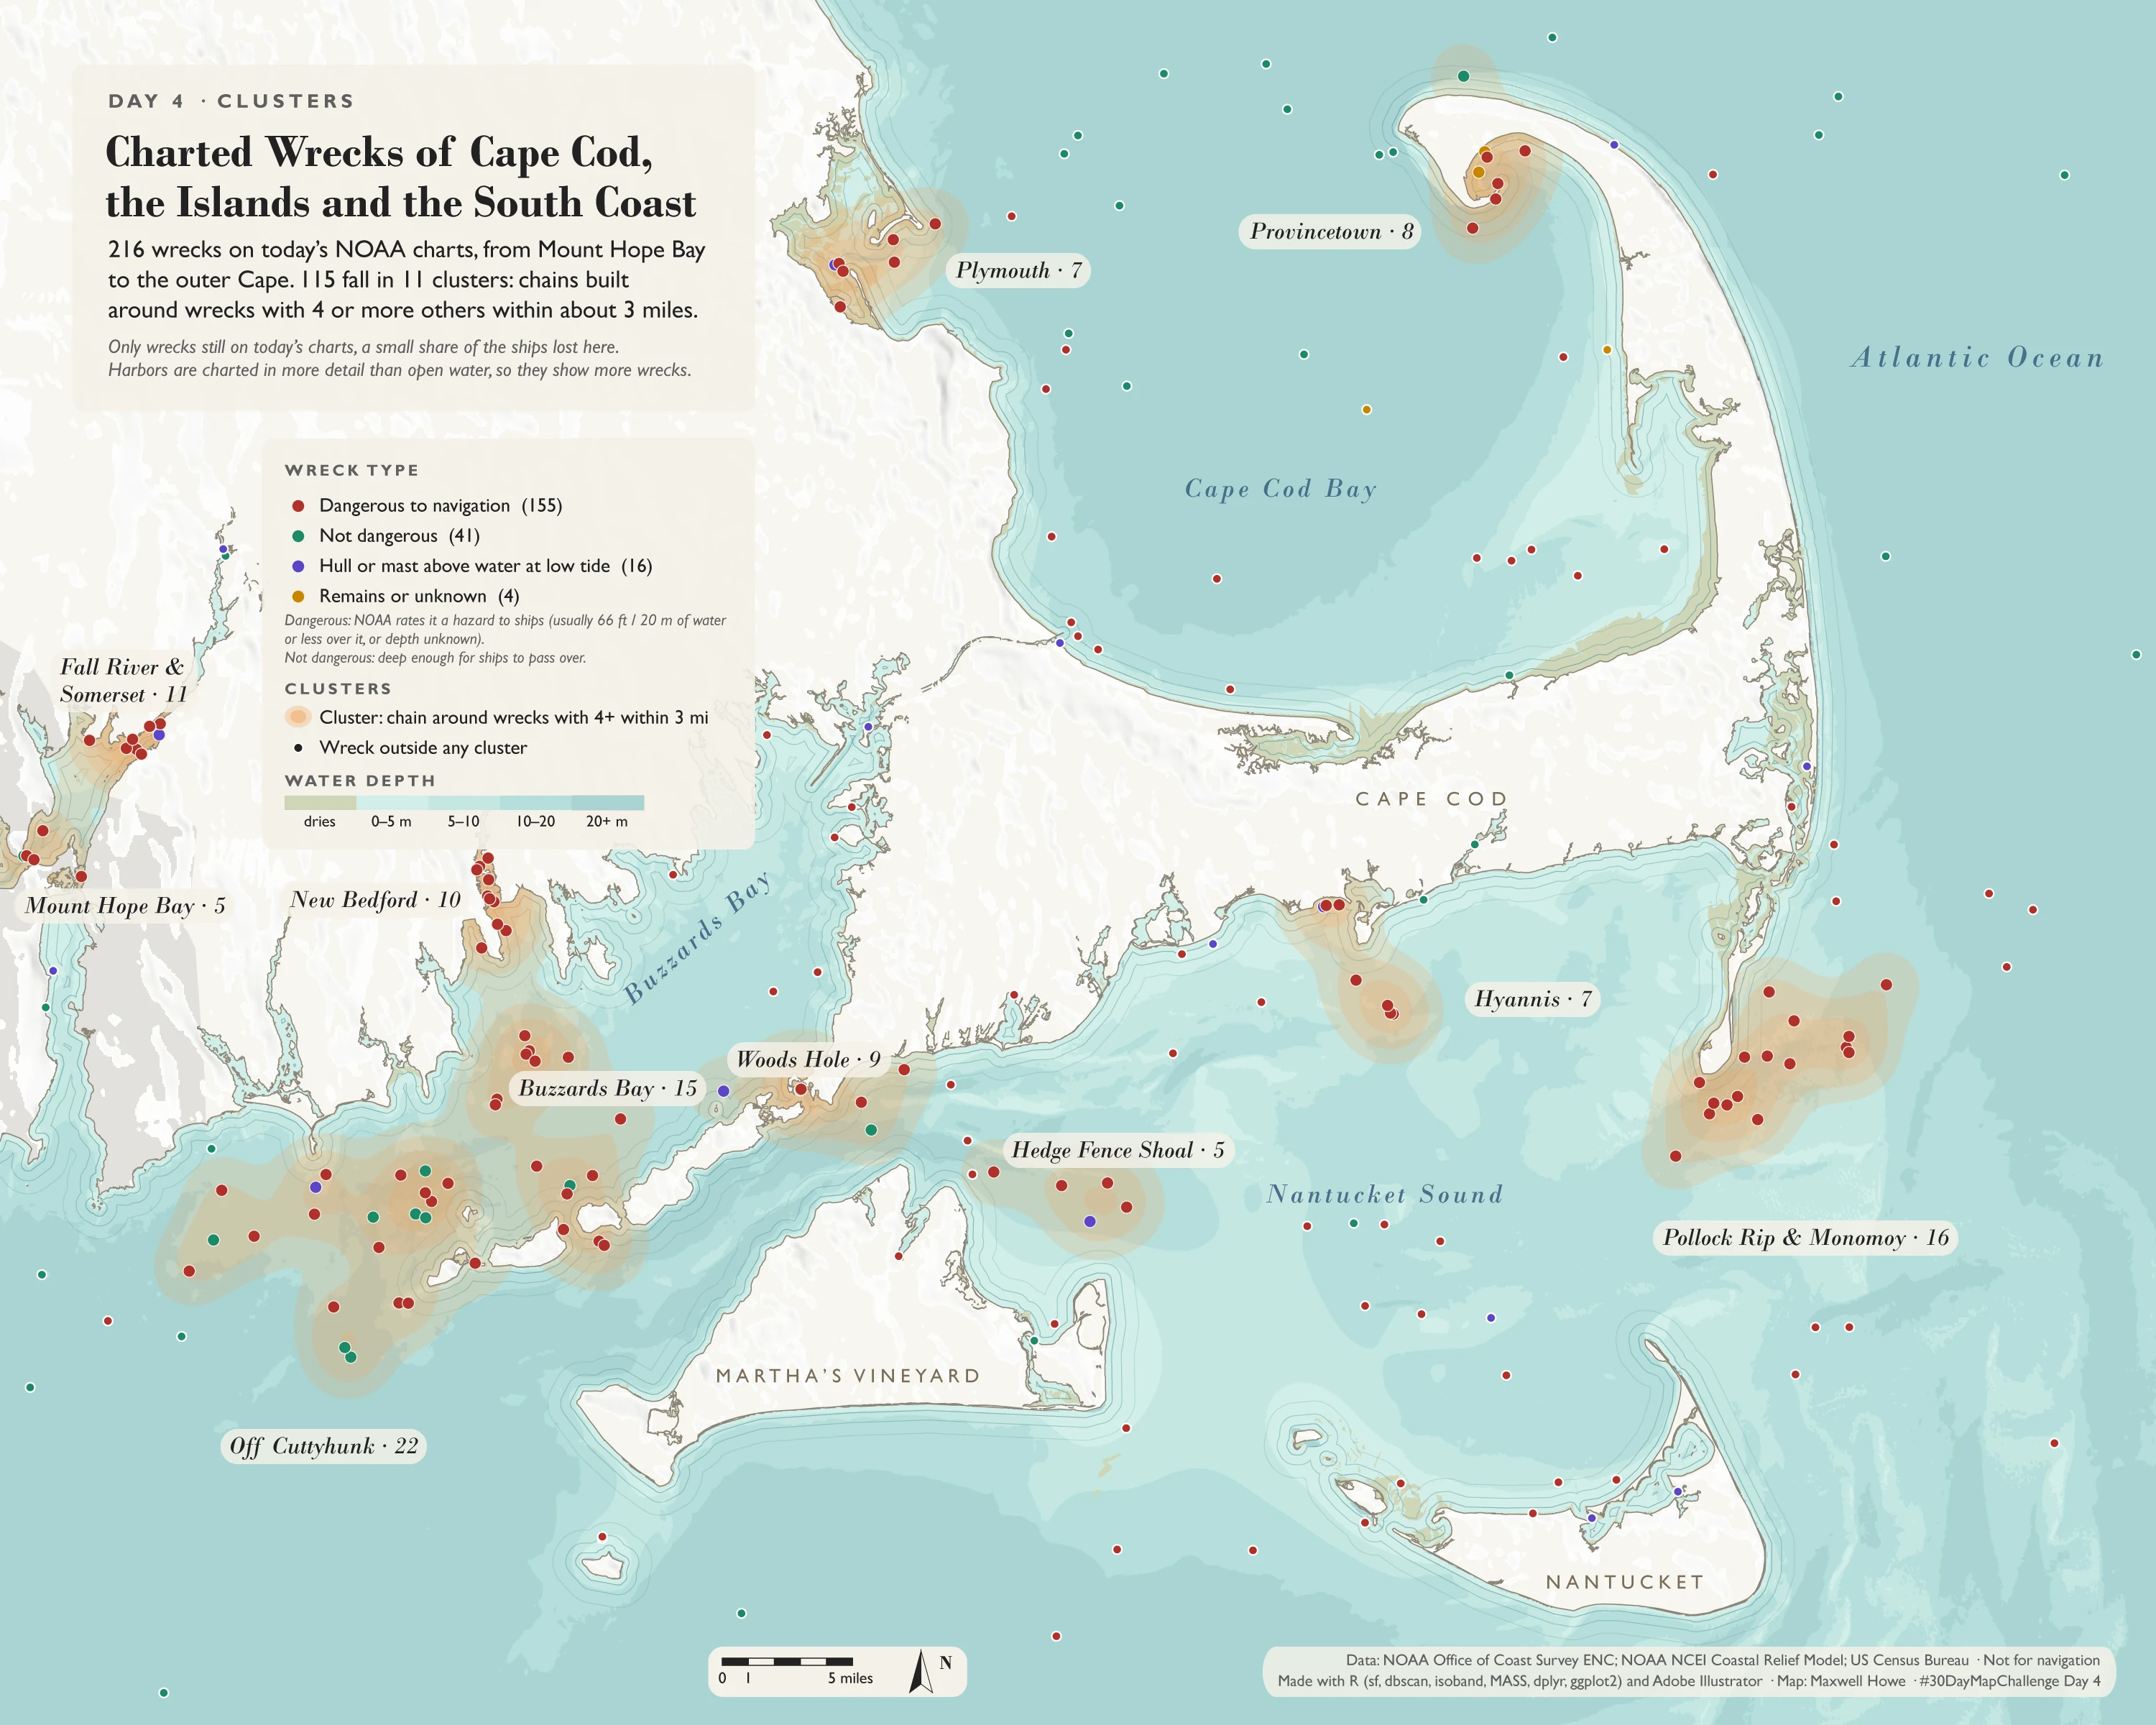
Charted Wrecks of Cape Cod, the Islands and the South Coast
216 wrecks on today’s NOAA navigational charts, from Mount Hope Bay to the outer Cape. DBSCAN (5 km radius, 5 wreck minimum) puts 115 of them into 11 clusters. These are charted wrecks only. The number of ships actually lost here runs into the thousands, and most are broken up, buried, or not on a chart.
Data: NOAA Office of Coast Survey ENC, NOAA NCEI Coastal Relief Model, US Census Bureau Made with: R (sf, dbscan, ggplot2), Illustrator
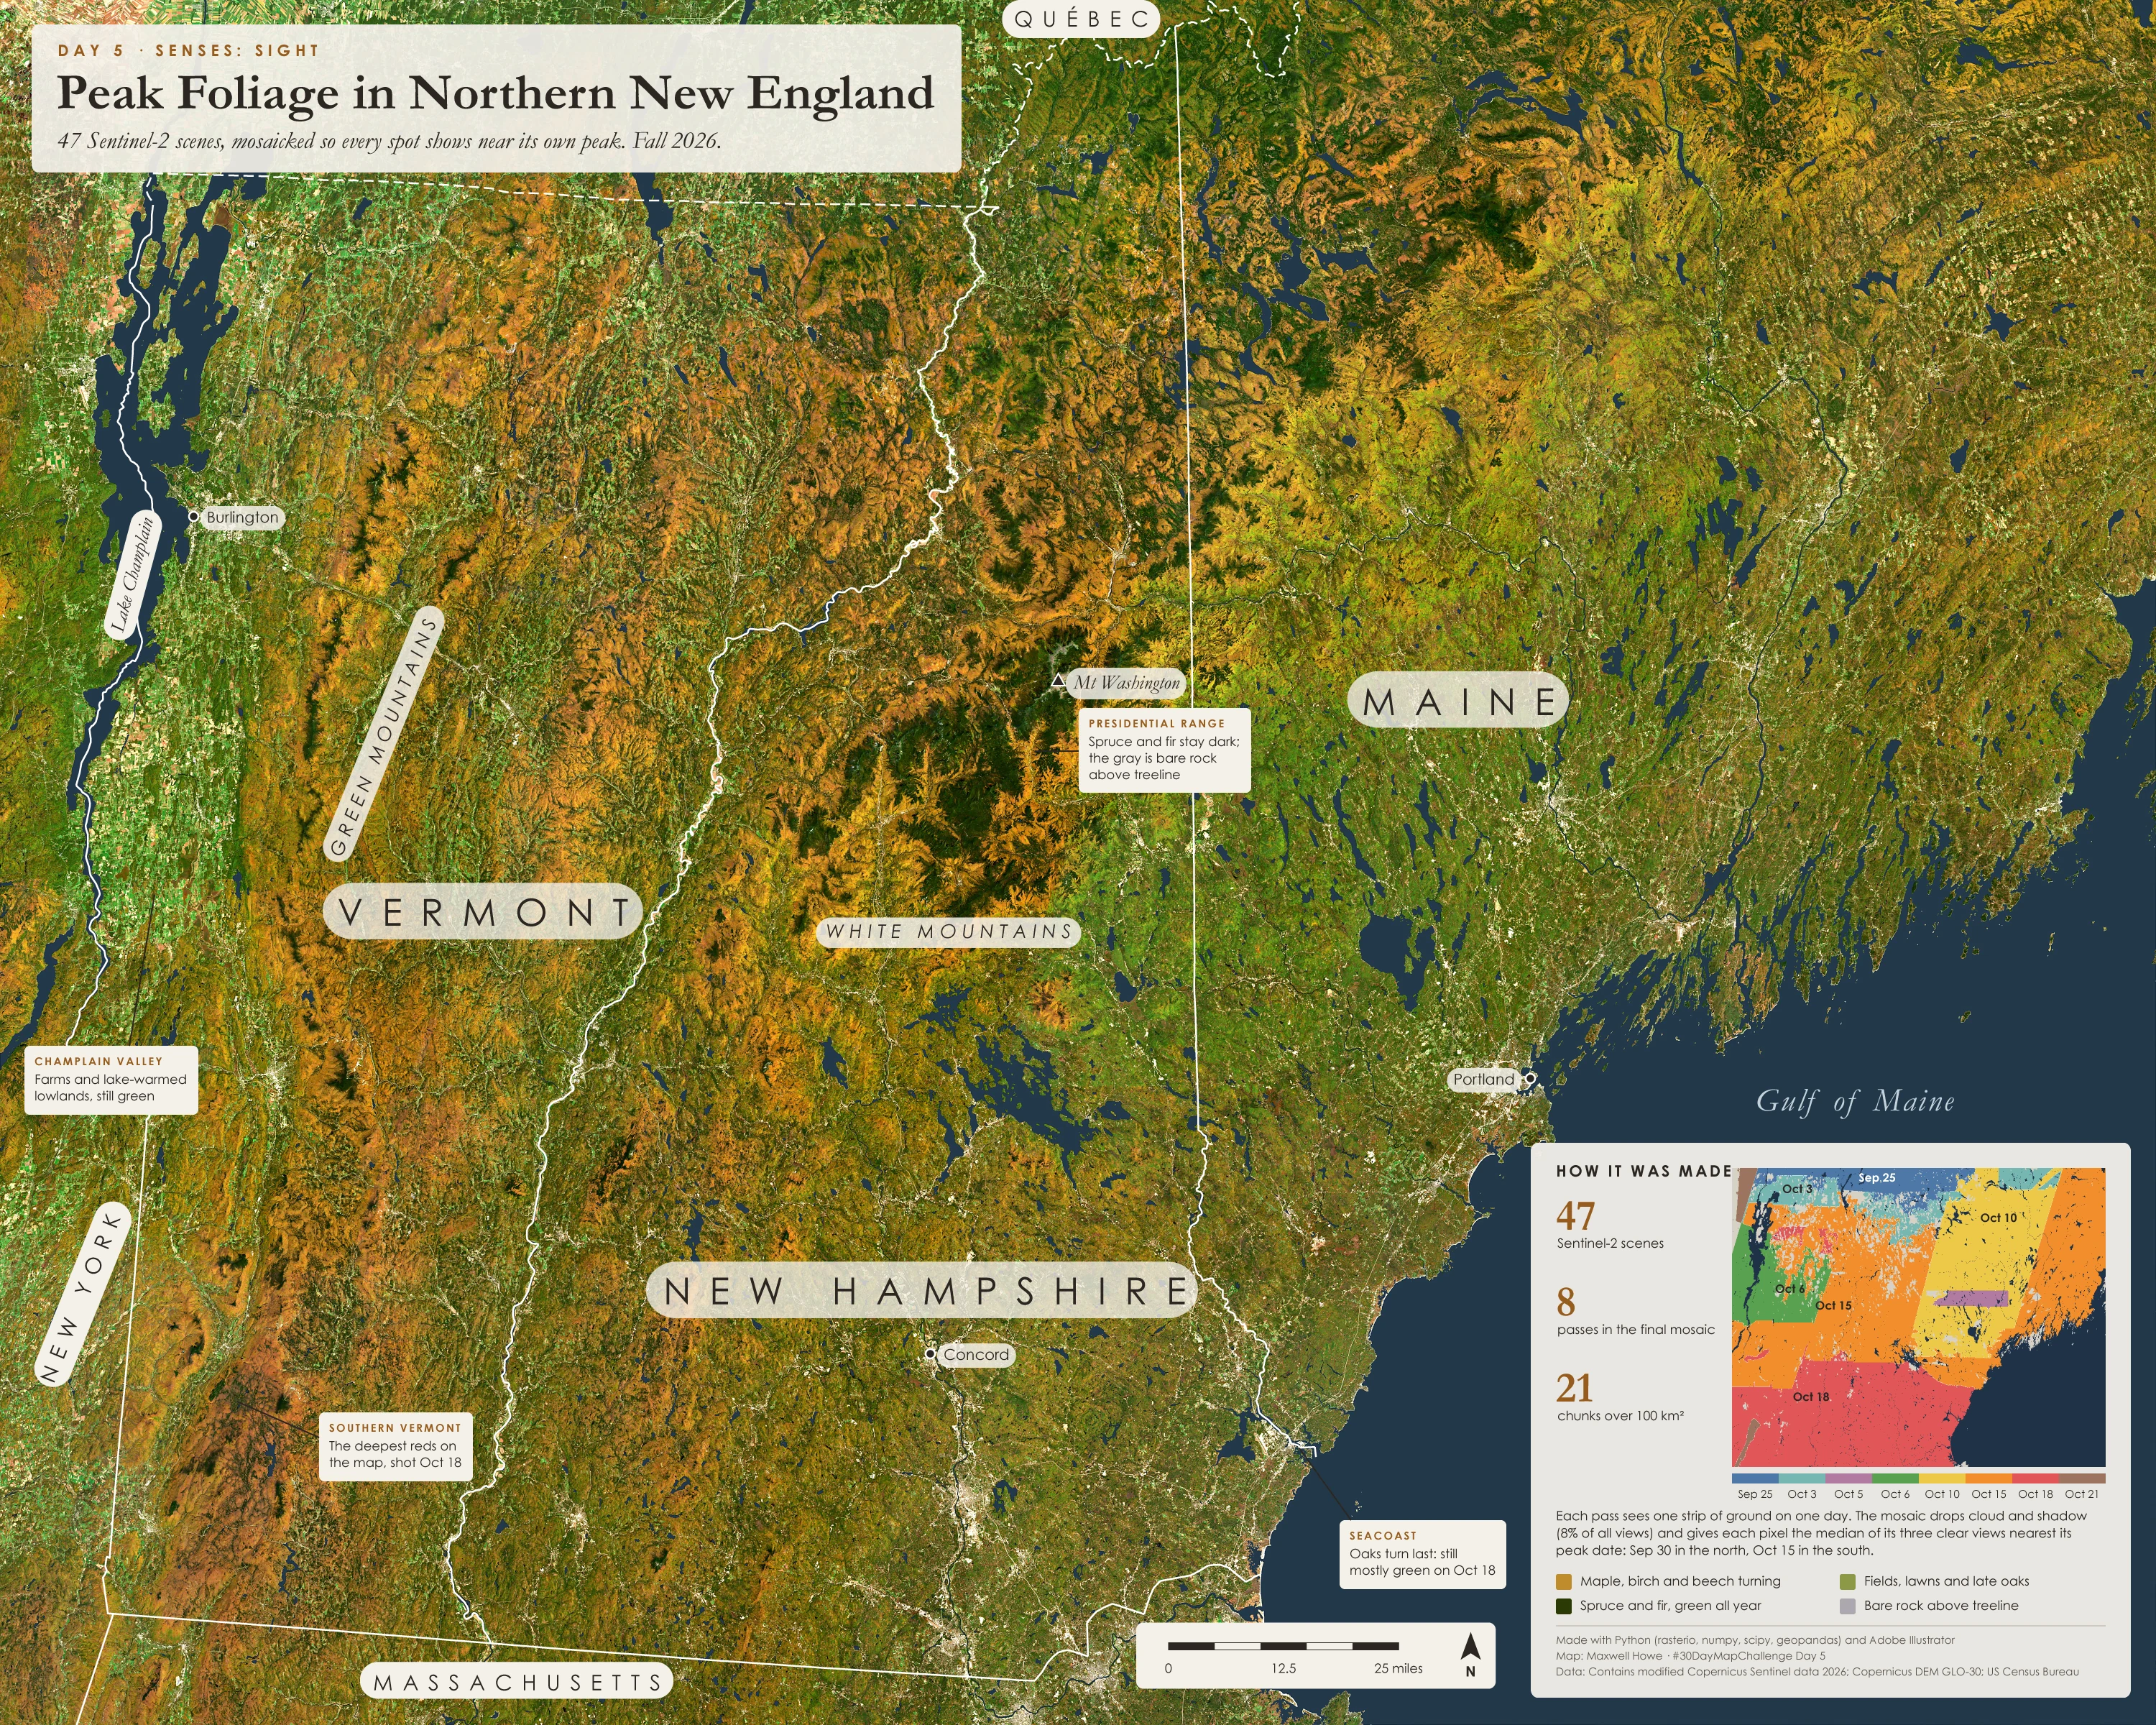
Day 5 · Senses: Sight
Peak Foliage in Northern New England
A cloud-free fall mosaic from 47 Sentinel-2 scenes across 8 satellite passes. Each pixel is the median of the three clear views closest to that spot’s expected peak, which comes about five days earlier for every degree north. The inset shows which pass each patch came from.
Data: Contains modified Copernicus Sentinel data 2026 Made with: Python (rasterio, numpy, scipy), Illustrator
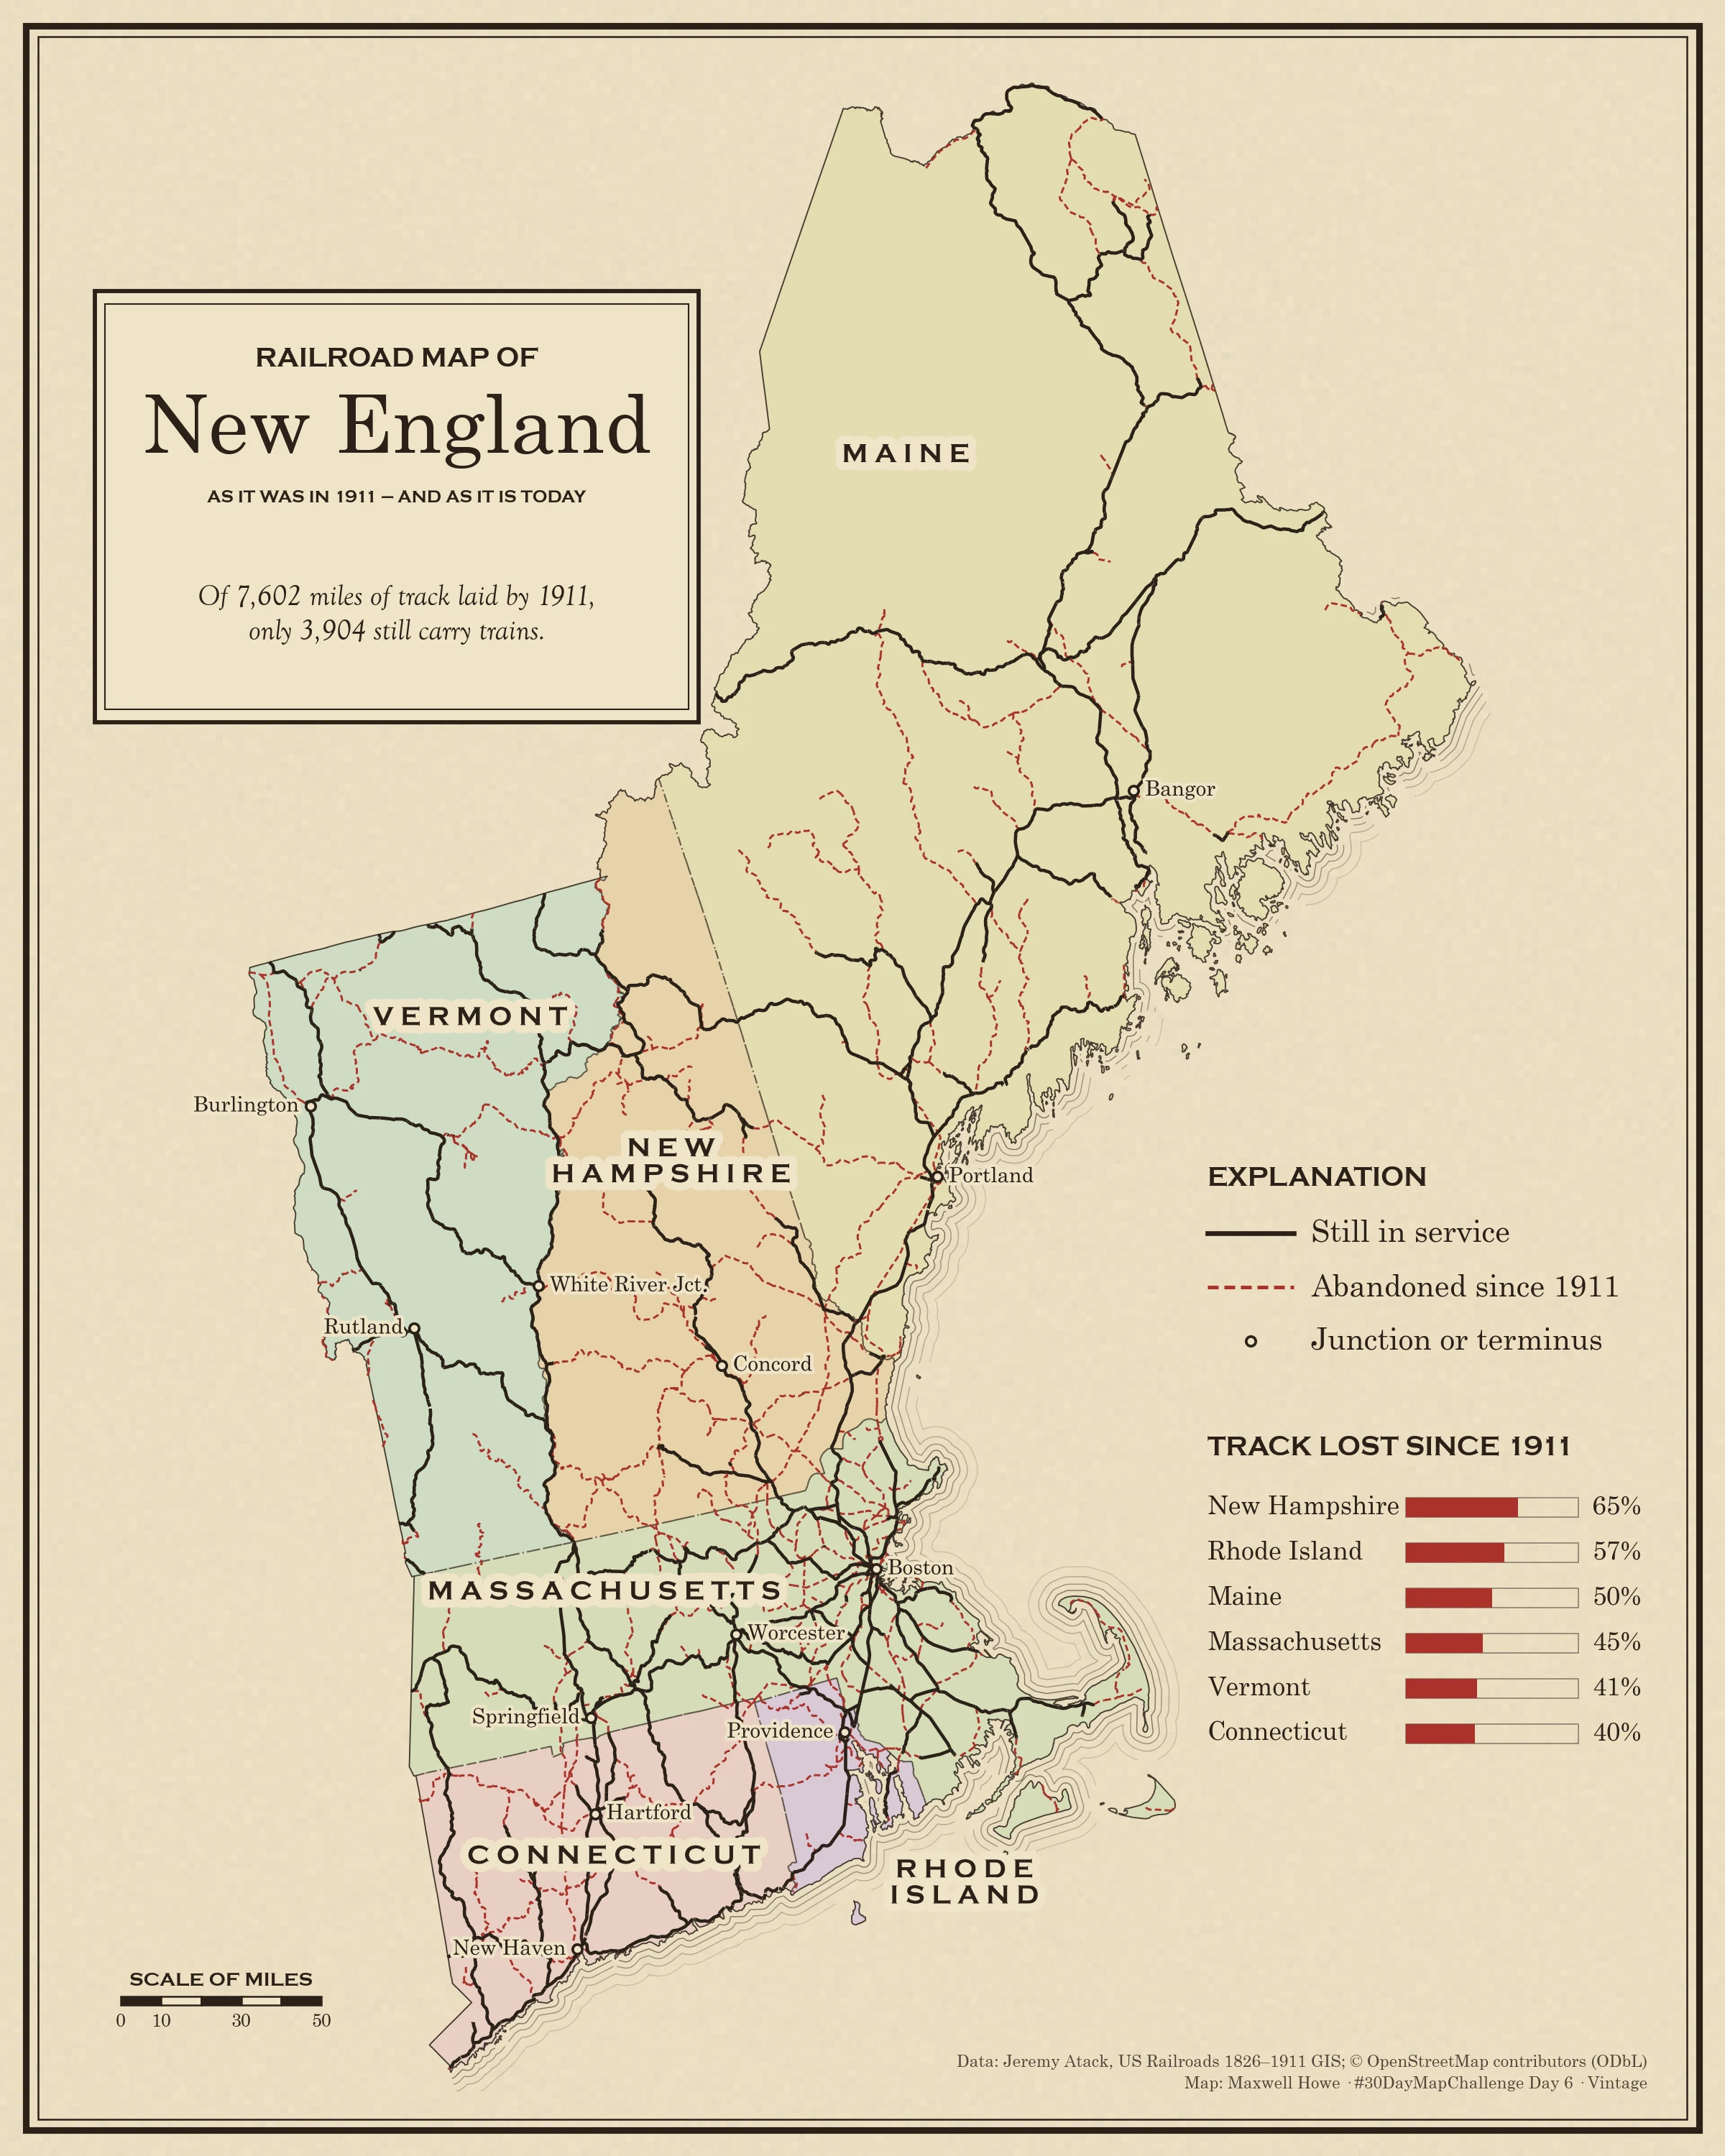
Day 6 · Vintage
Railroad Map of New England, 1911 and Today
New England had 7,602 miles of railroad at its 1911 peak. 3,904 miles, 51 percent, still carry trains. New Hampshire lost the most (65 percent) and Connecticut the least (40 percent). A 1911 segment counts as in service if a running OpenStreetMap rail line lies within 150 meters. Drawn as a page from a 1911 railroad atlas.
Data: Jeremy Atack, US Railroads 1826–1911 GIS; OpenStreetMap contributors (ODbL) Made with: Python (geopandas, matplotlib)
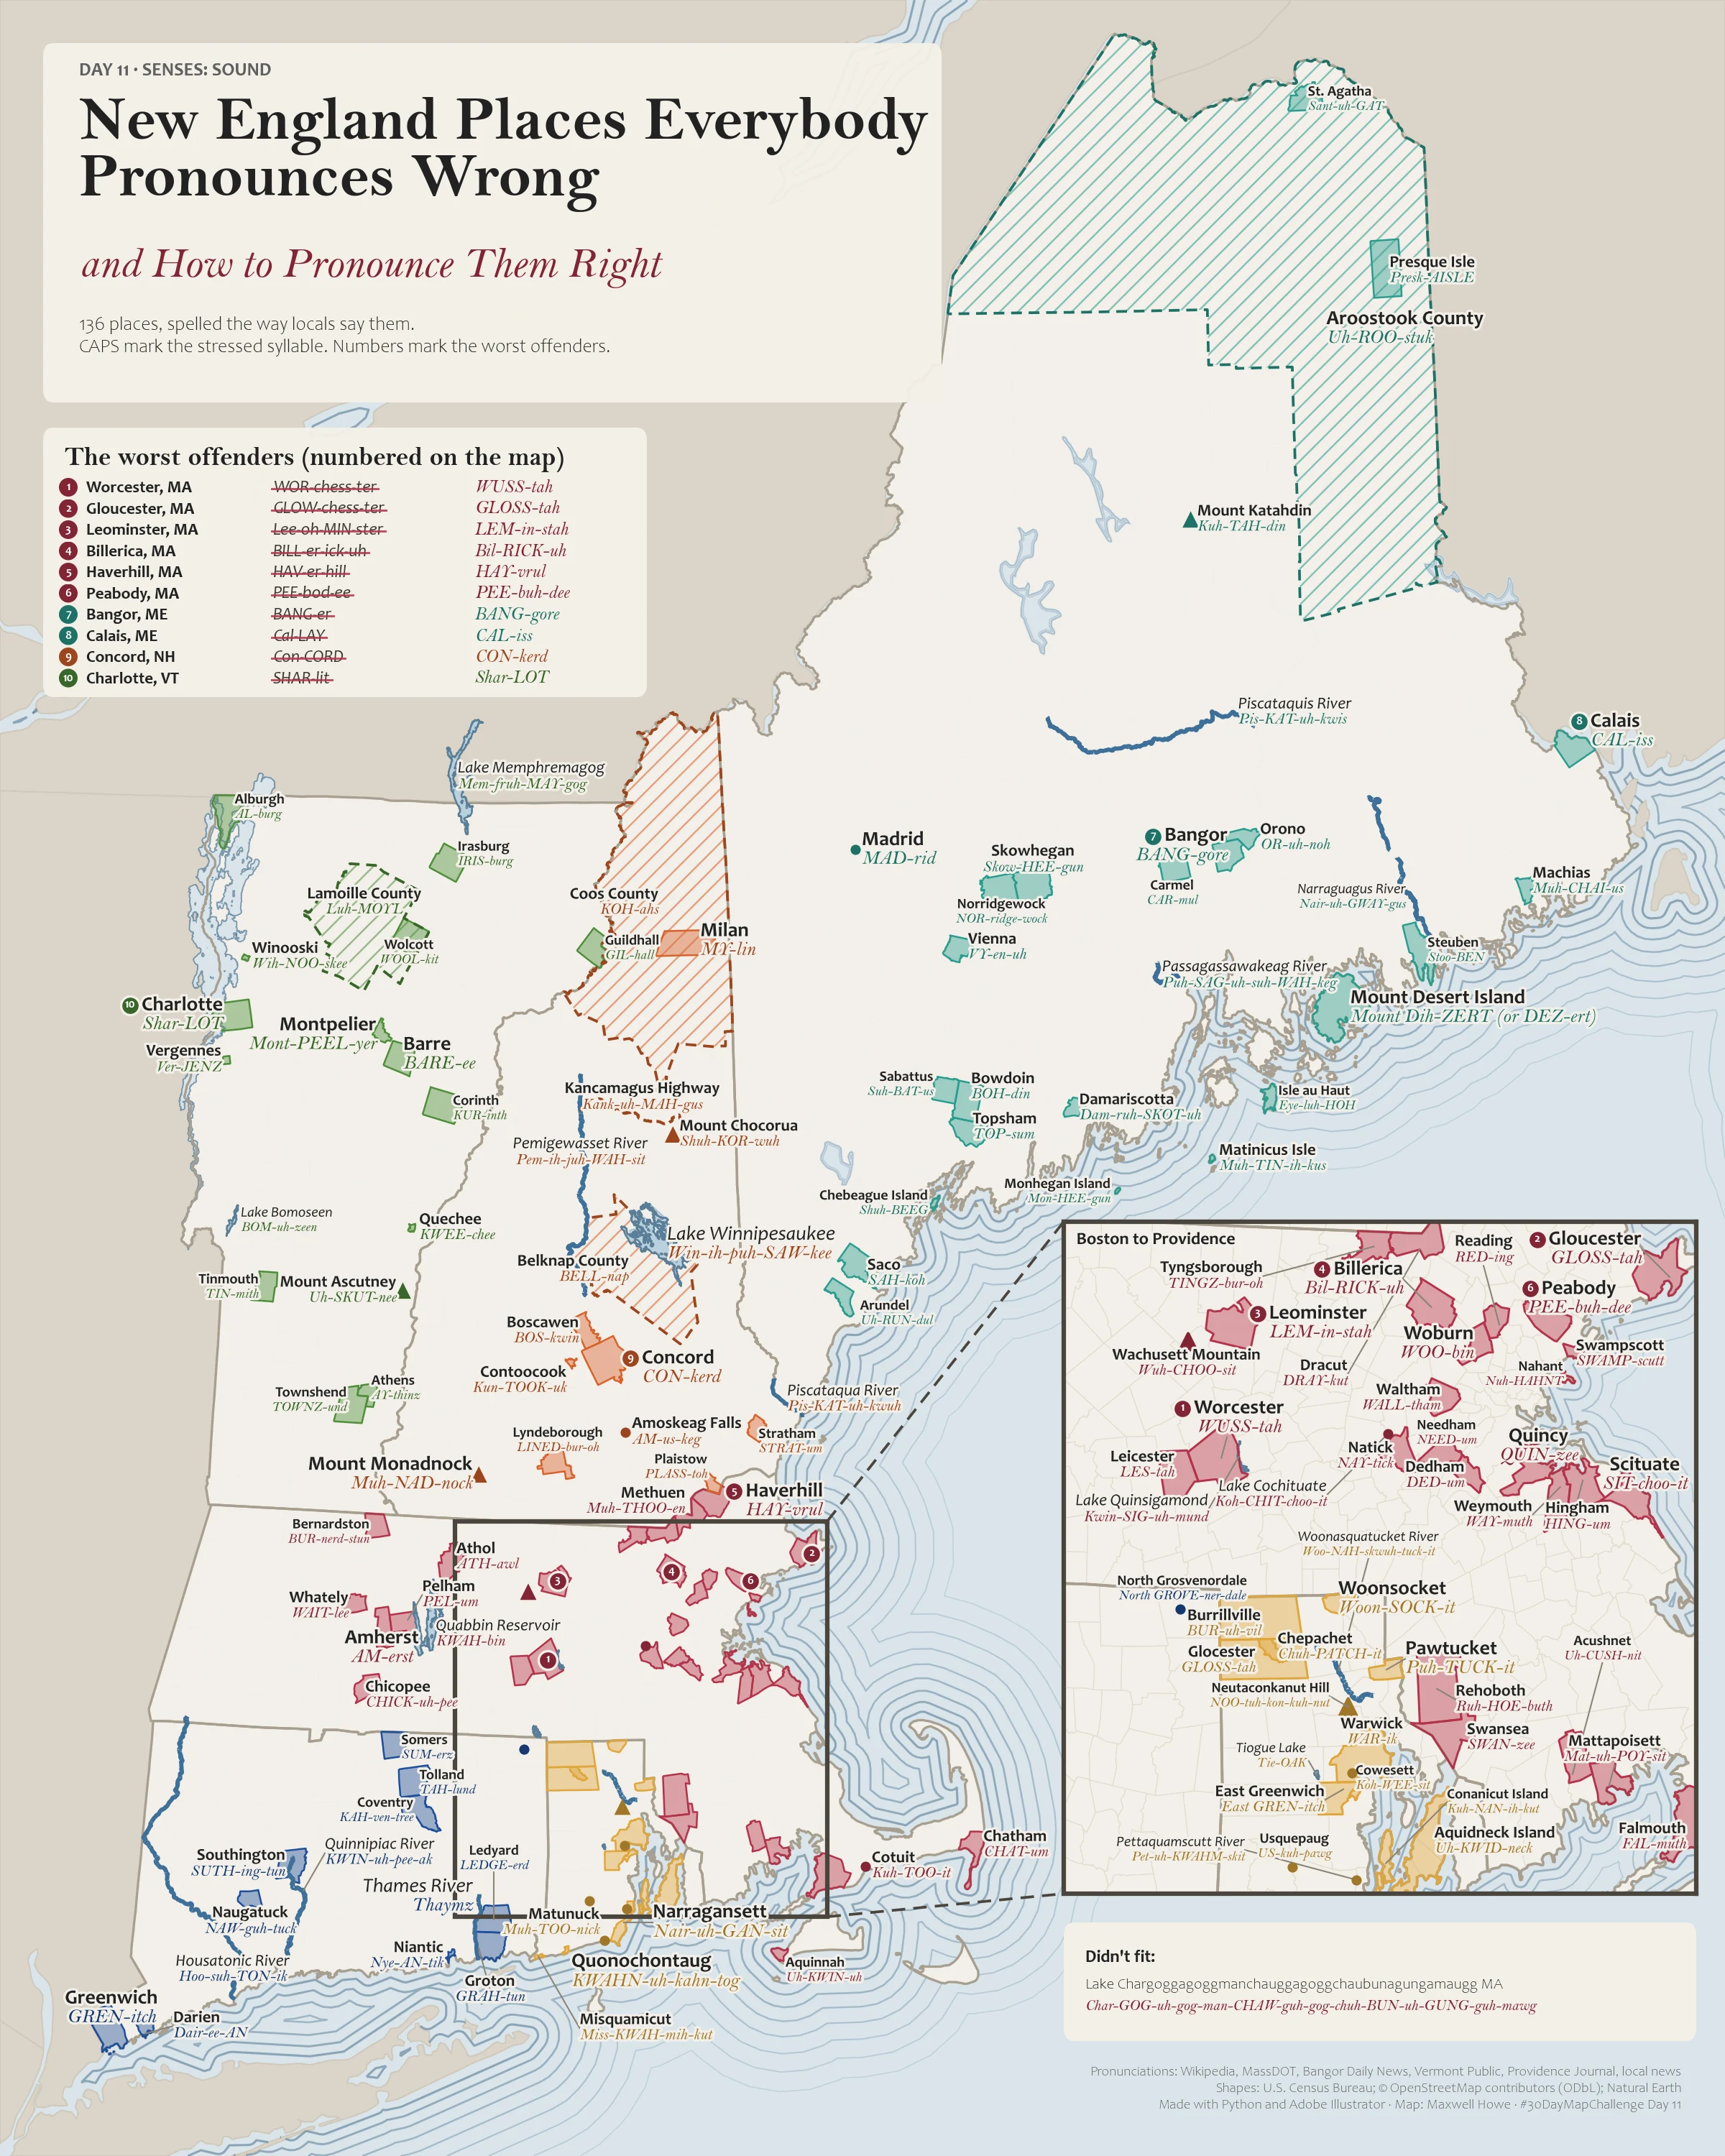
Day 11 · Senses: Sound
New England Places Everybody Pronounces Wrong
136 towns, rivers, lakes and mountains spelled the way locals say them: WUSS-tah, GLOSS-tah, LEM-in-stah. Capitals mark the stressed syllable and the worst offenders are numbered. Every pronunciation has two sources.
Data: Wikipedia IPA, local news and town sources, US Census Bureau, OpenStreetMap Made with: Python (geopandas, matplotlib), Illustrator