Veins of the Commonwealth
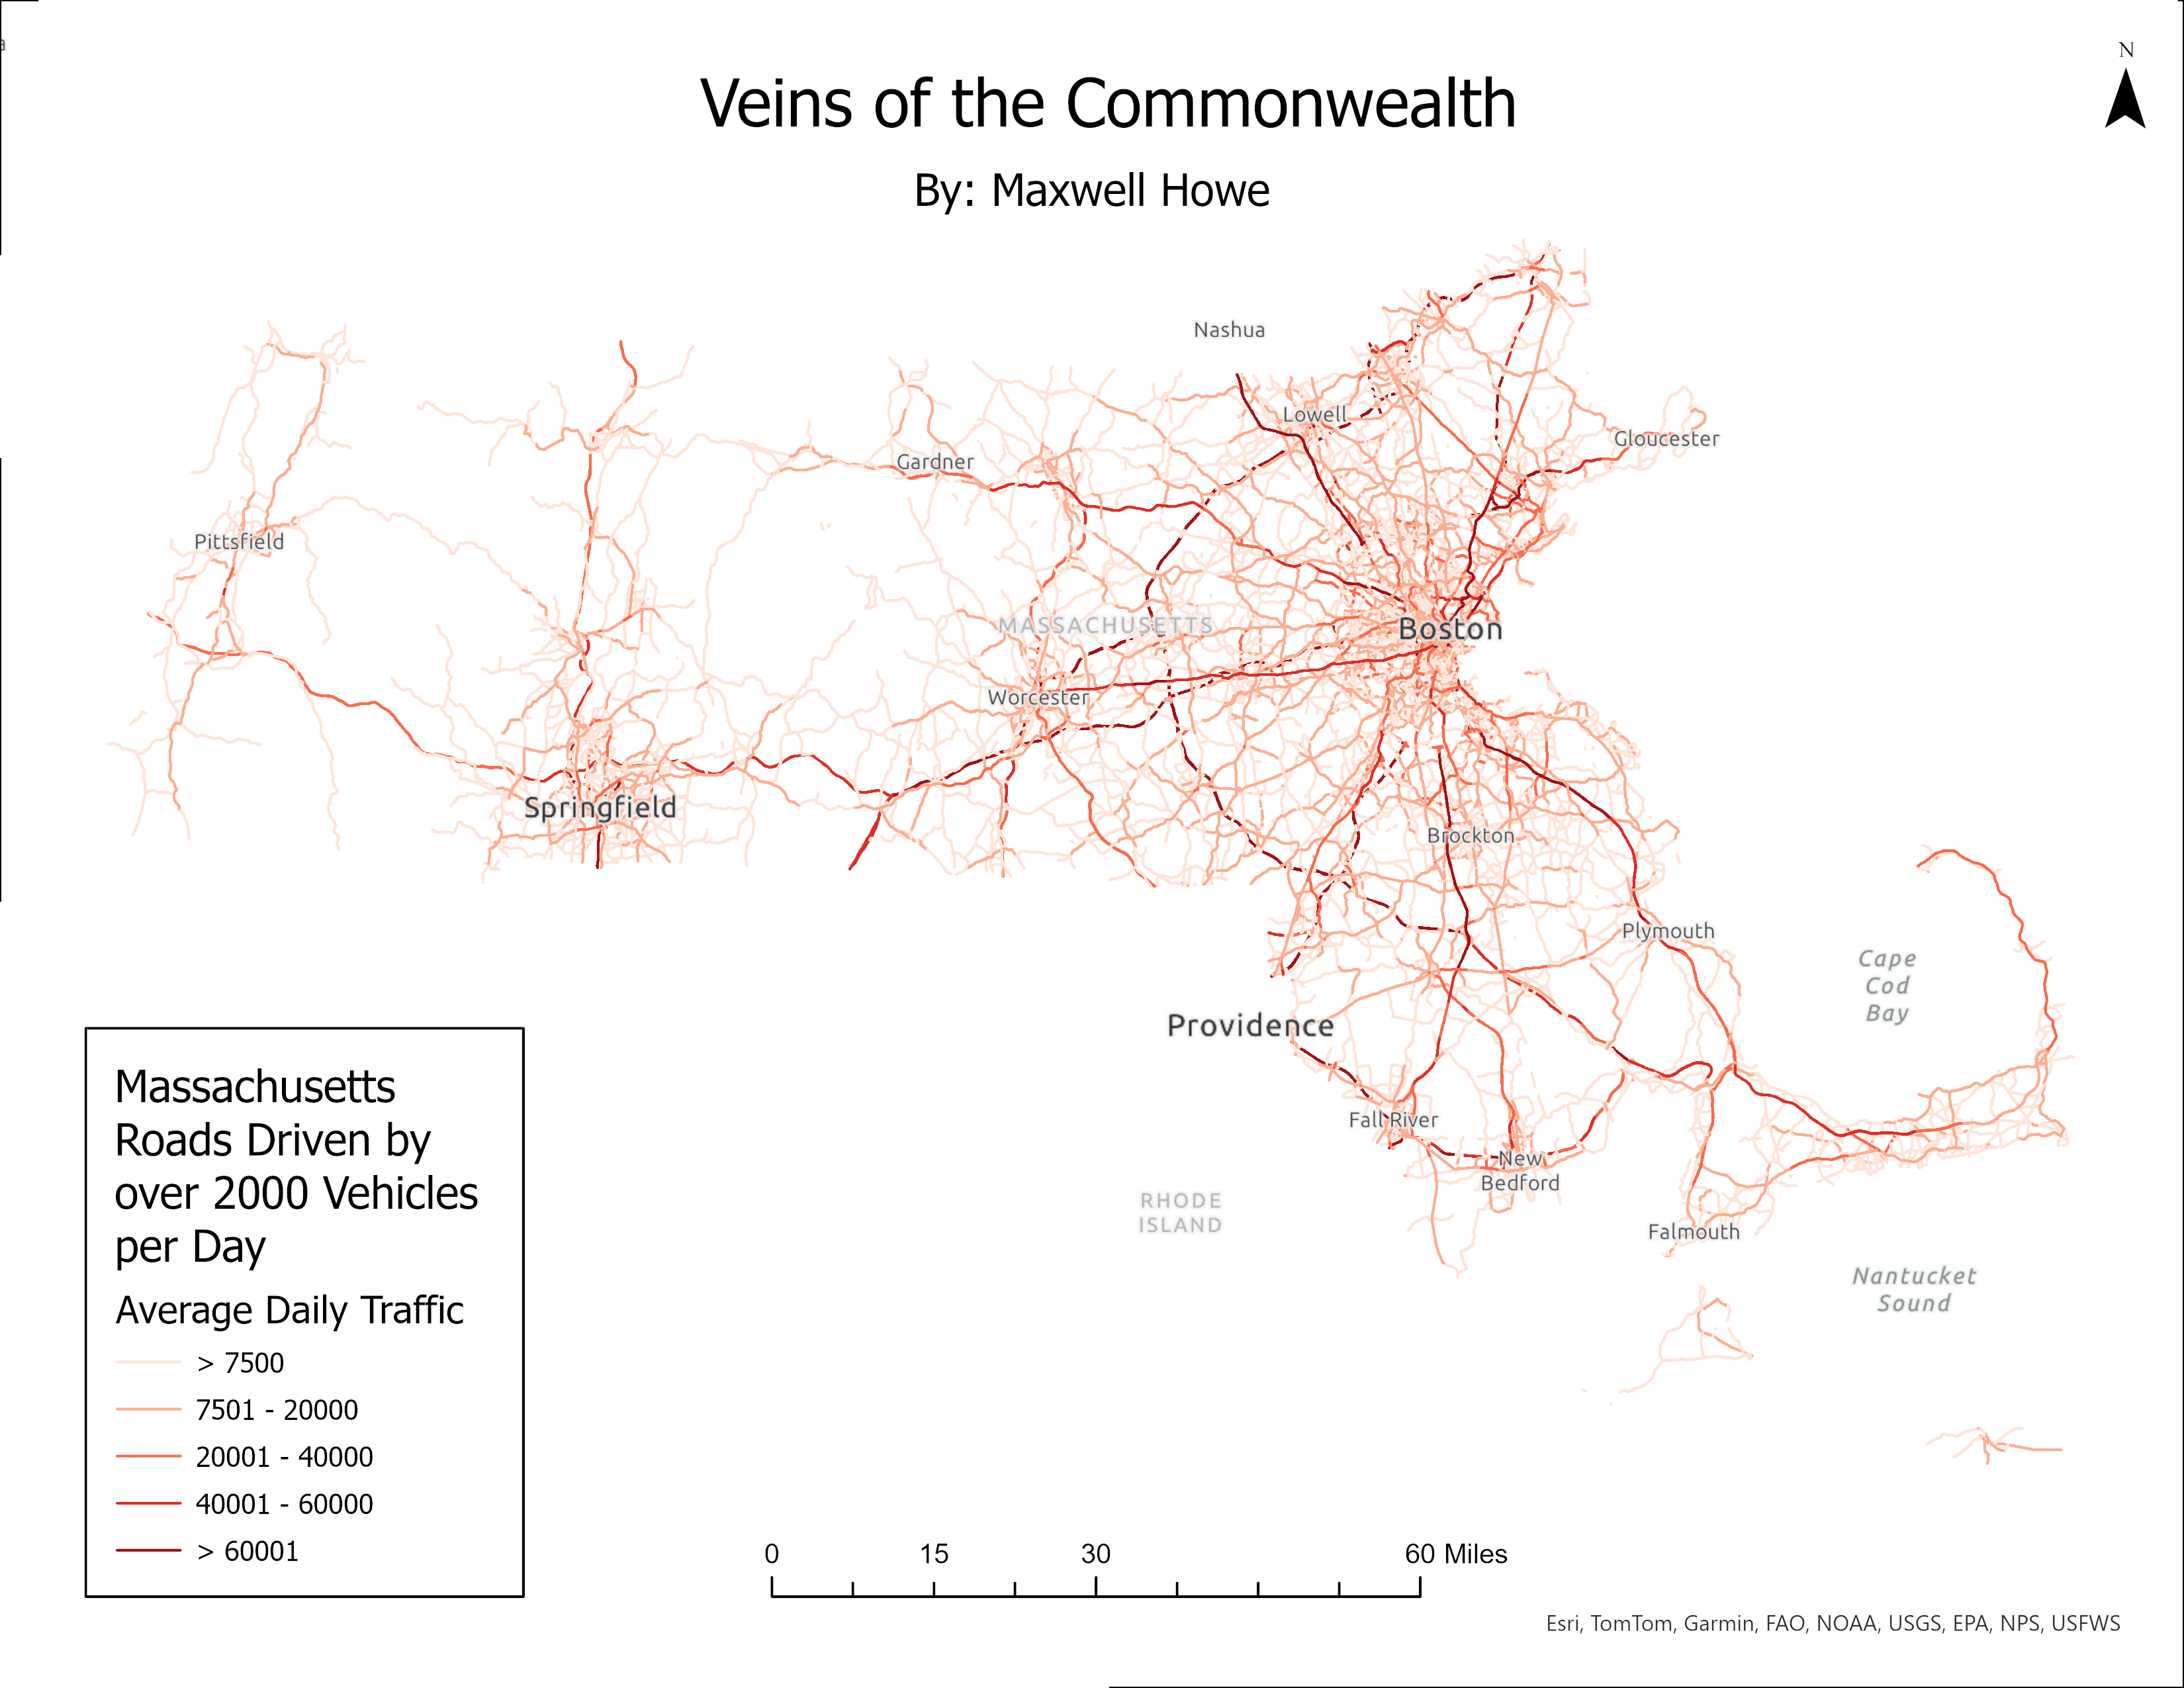
Veins of the Commonwealth
MA transportation network as a circulatory system — roads, rail, and waterways layered to reveal how the state moves.
ArcGIS Pro
Cartography
GPH946
Chronic Absenteeism — Lynn
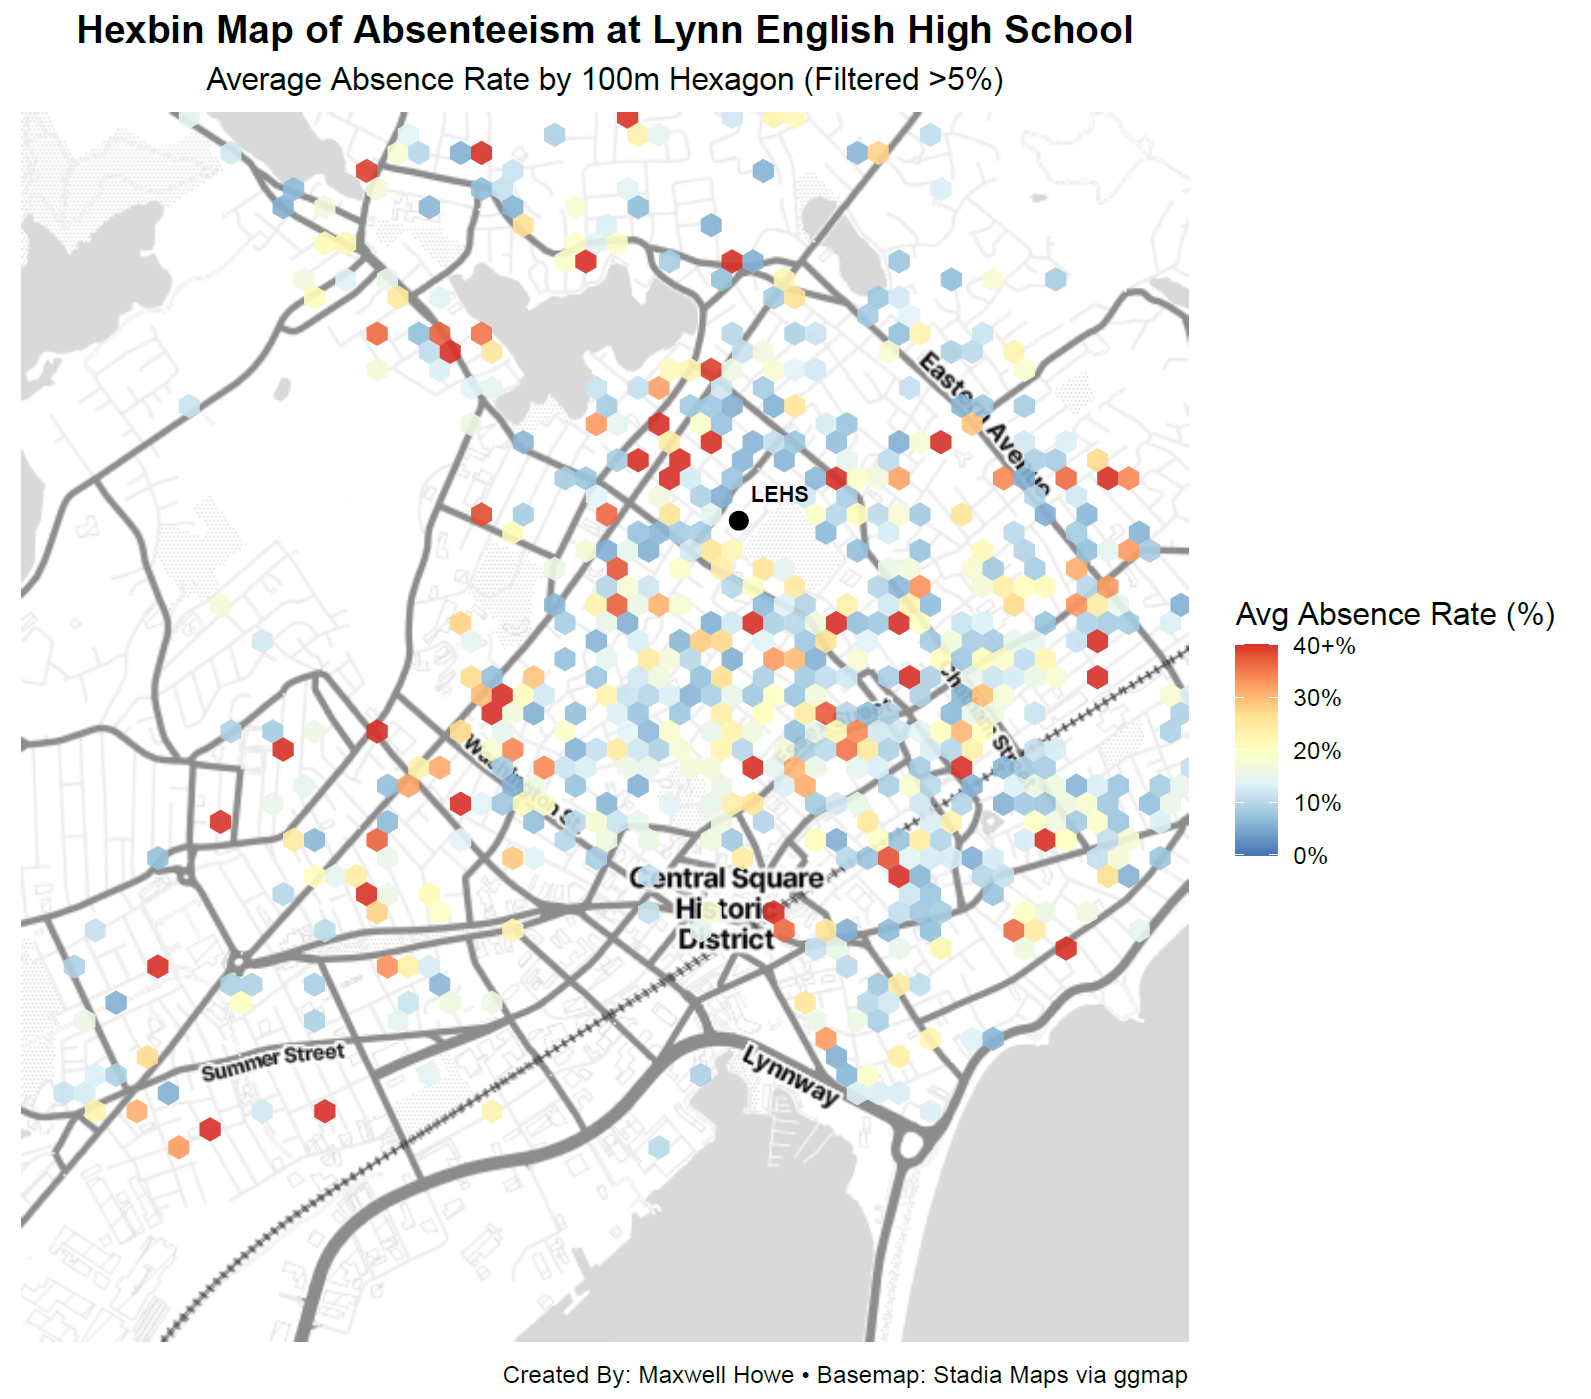
Chronic Absenteeism — Lynn Public Schools
One of 20 maps from my MS capstone. Geocoded student addresses, hexbin grids, KDE heatmaps, and subgroup breakdowns.
R
ggplot2
Geocoding
Capstone
View full project →

Growth in the Granite State
Growth in the Granite State
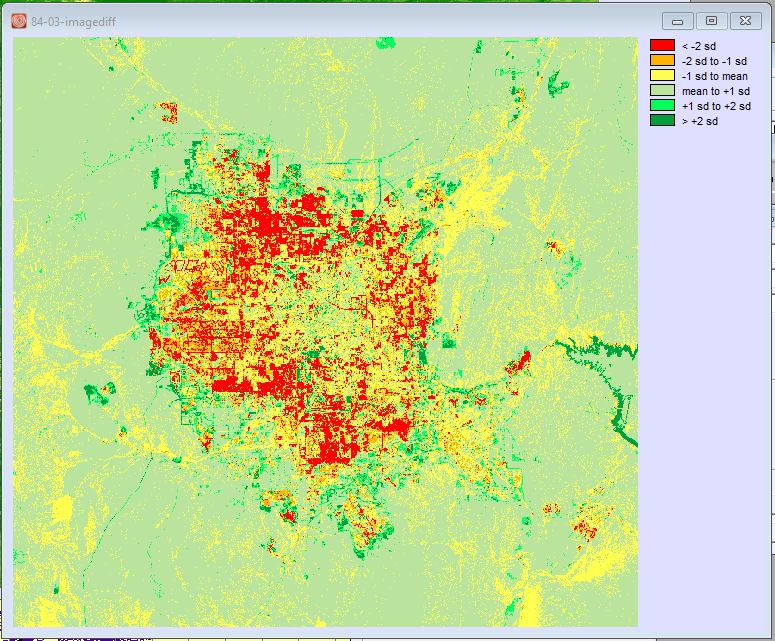
Landsat 8/9 multitemporal change detection over Concord, NH. Pansharpened to 15m resolution.
Landsat 8/9
TerrSet
Change Detection

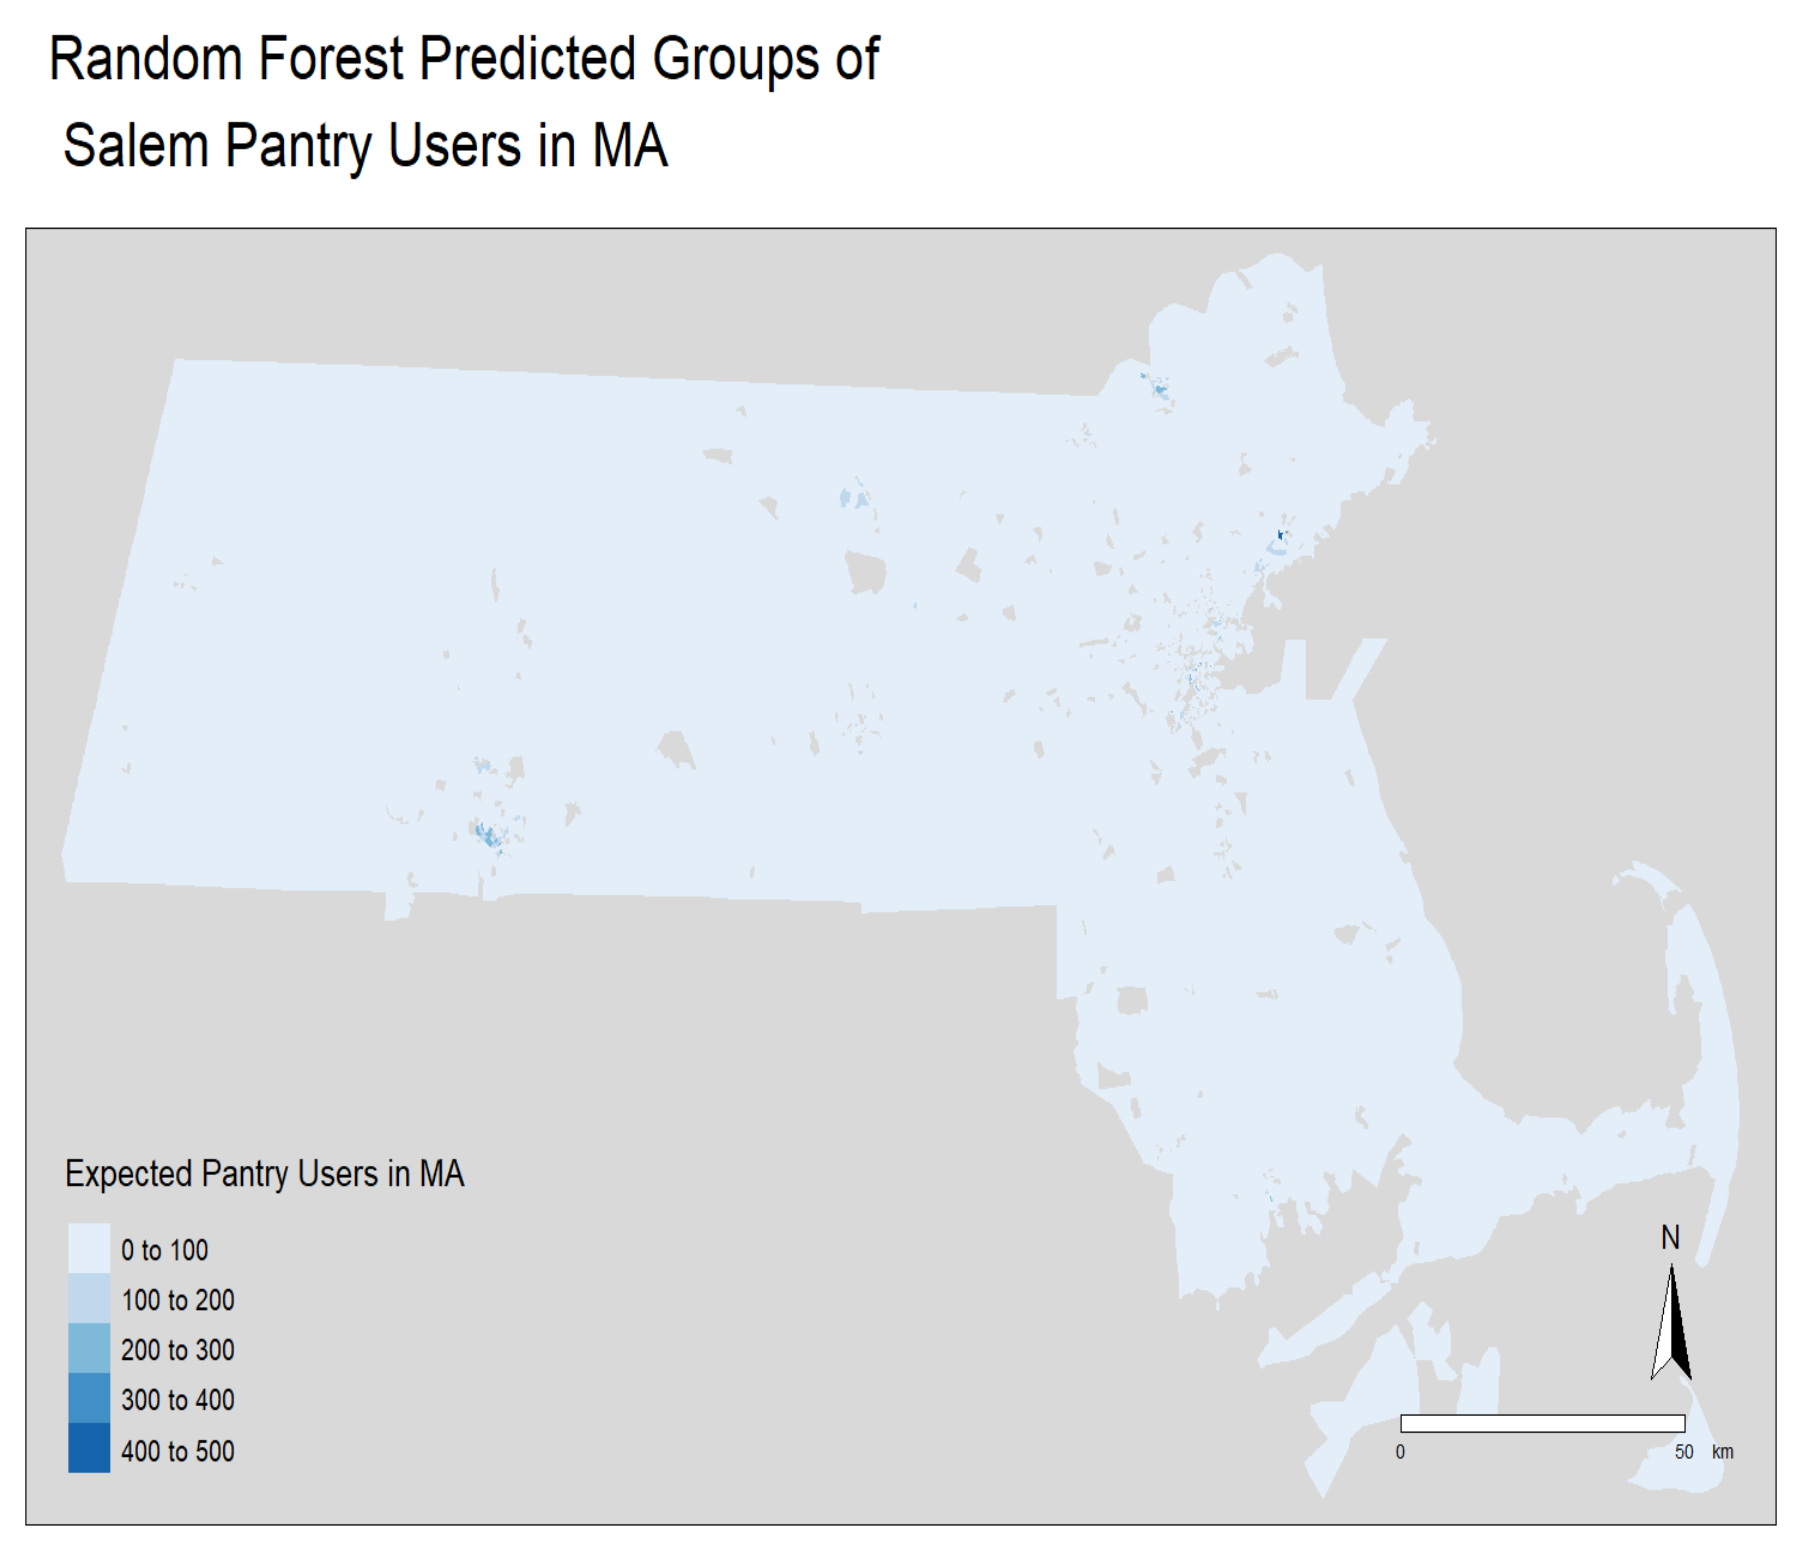
Salem Pantry: Food Access
Salem Pantry: Mapping Food Access
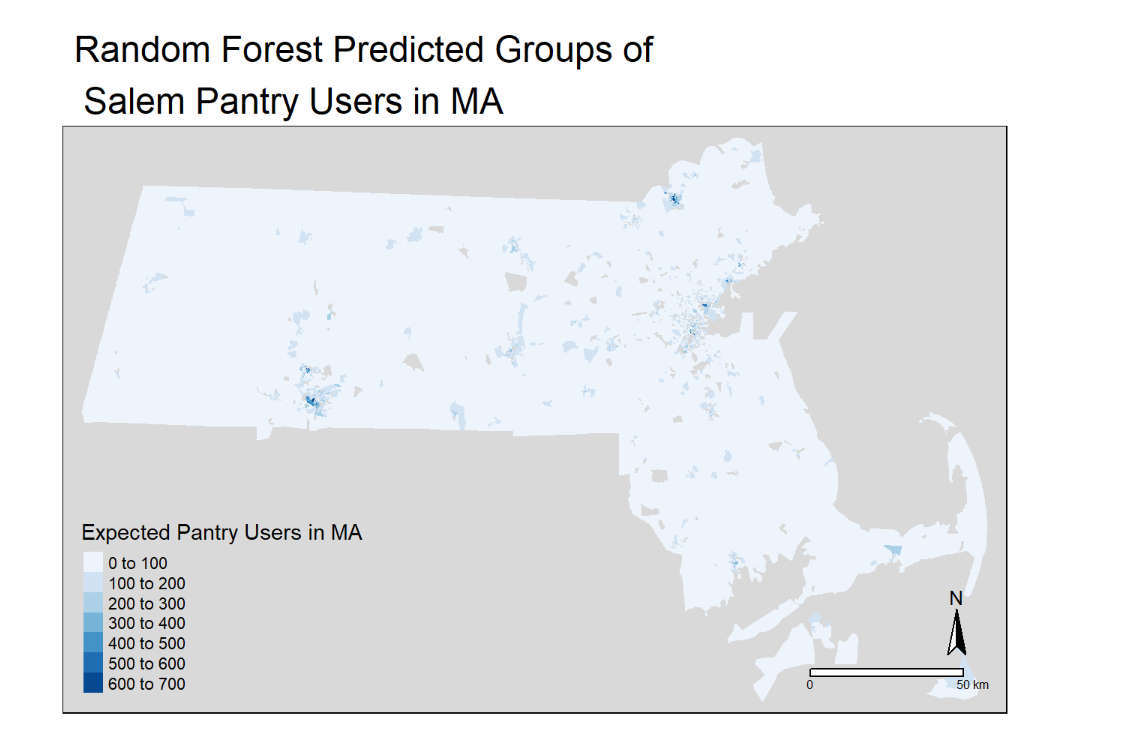
150,000+ client records analyzed. Coverage gaps mapped, statewide similarity modeled via random forest using Census ACS data.
R
Random Forest
Census ACS
Education & Wealth in MA
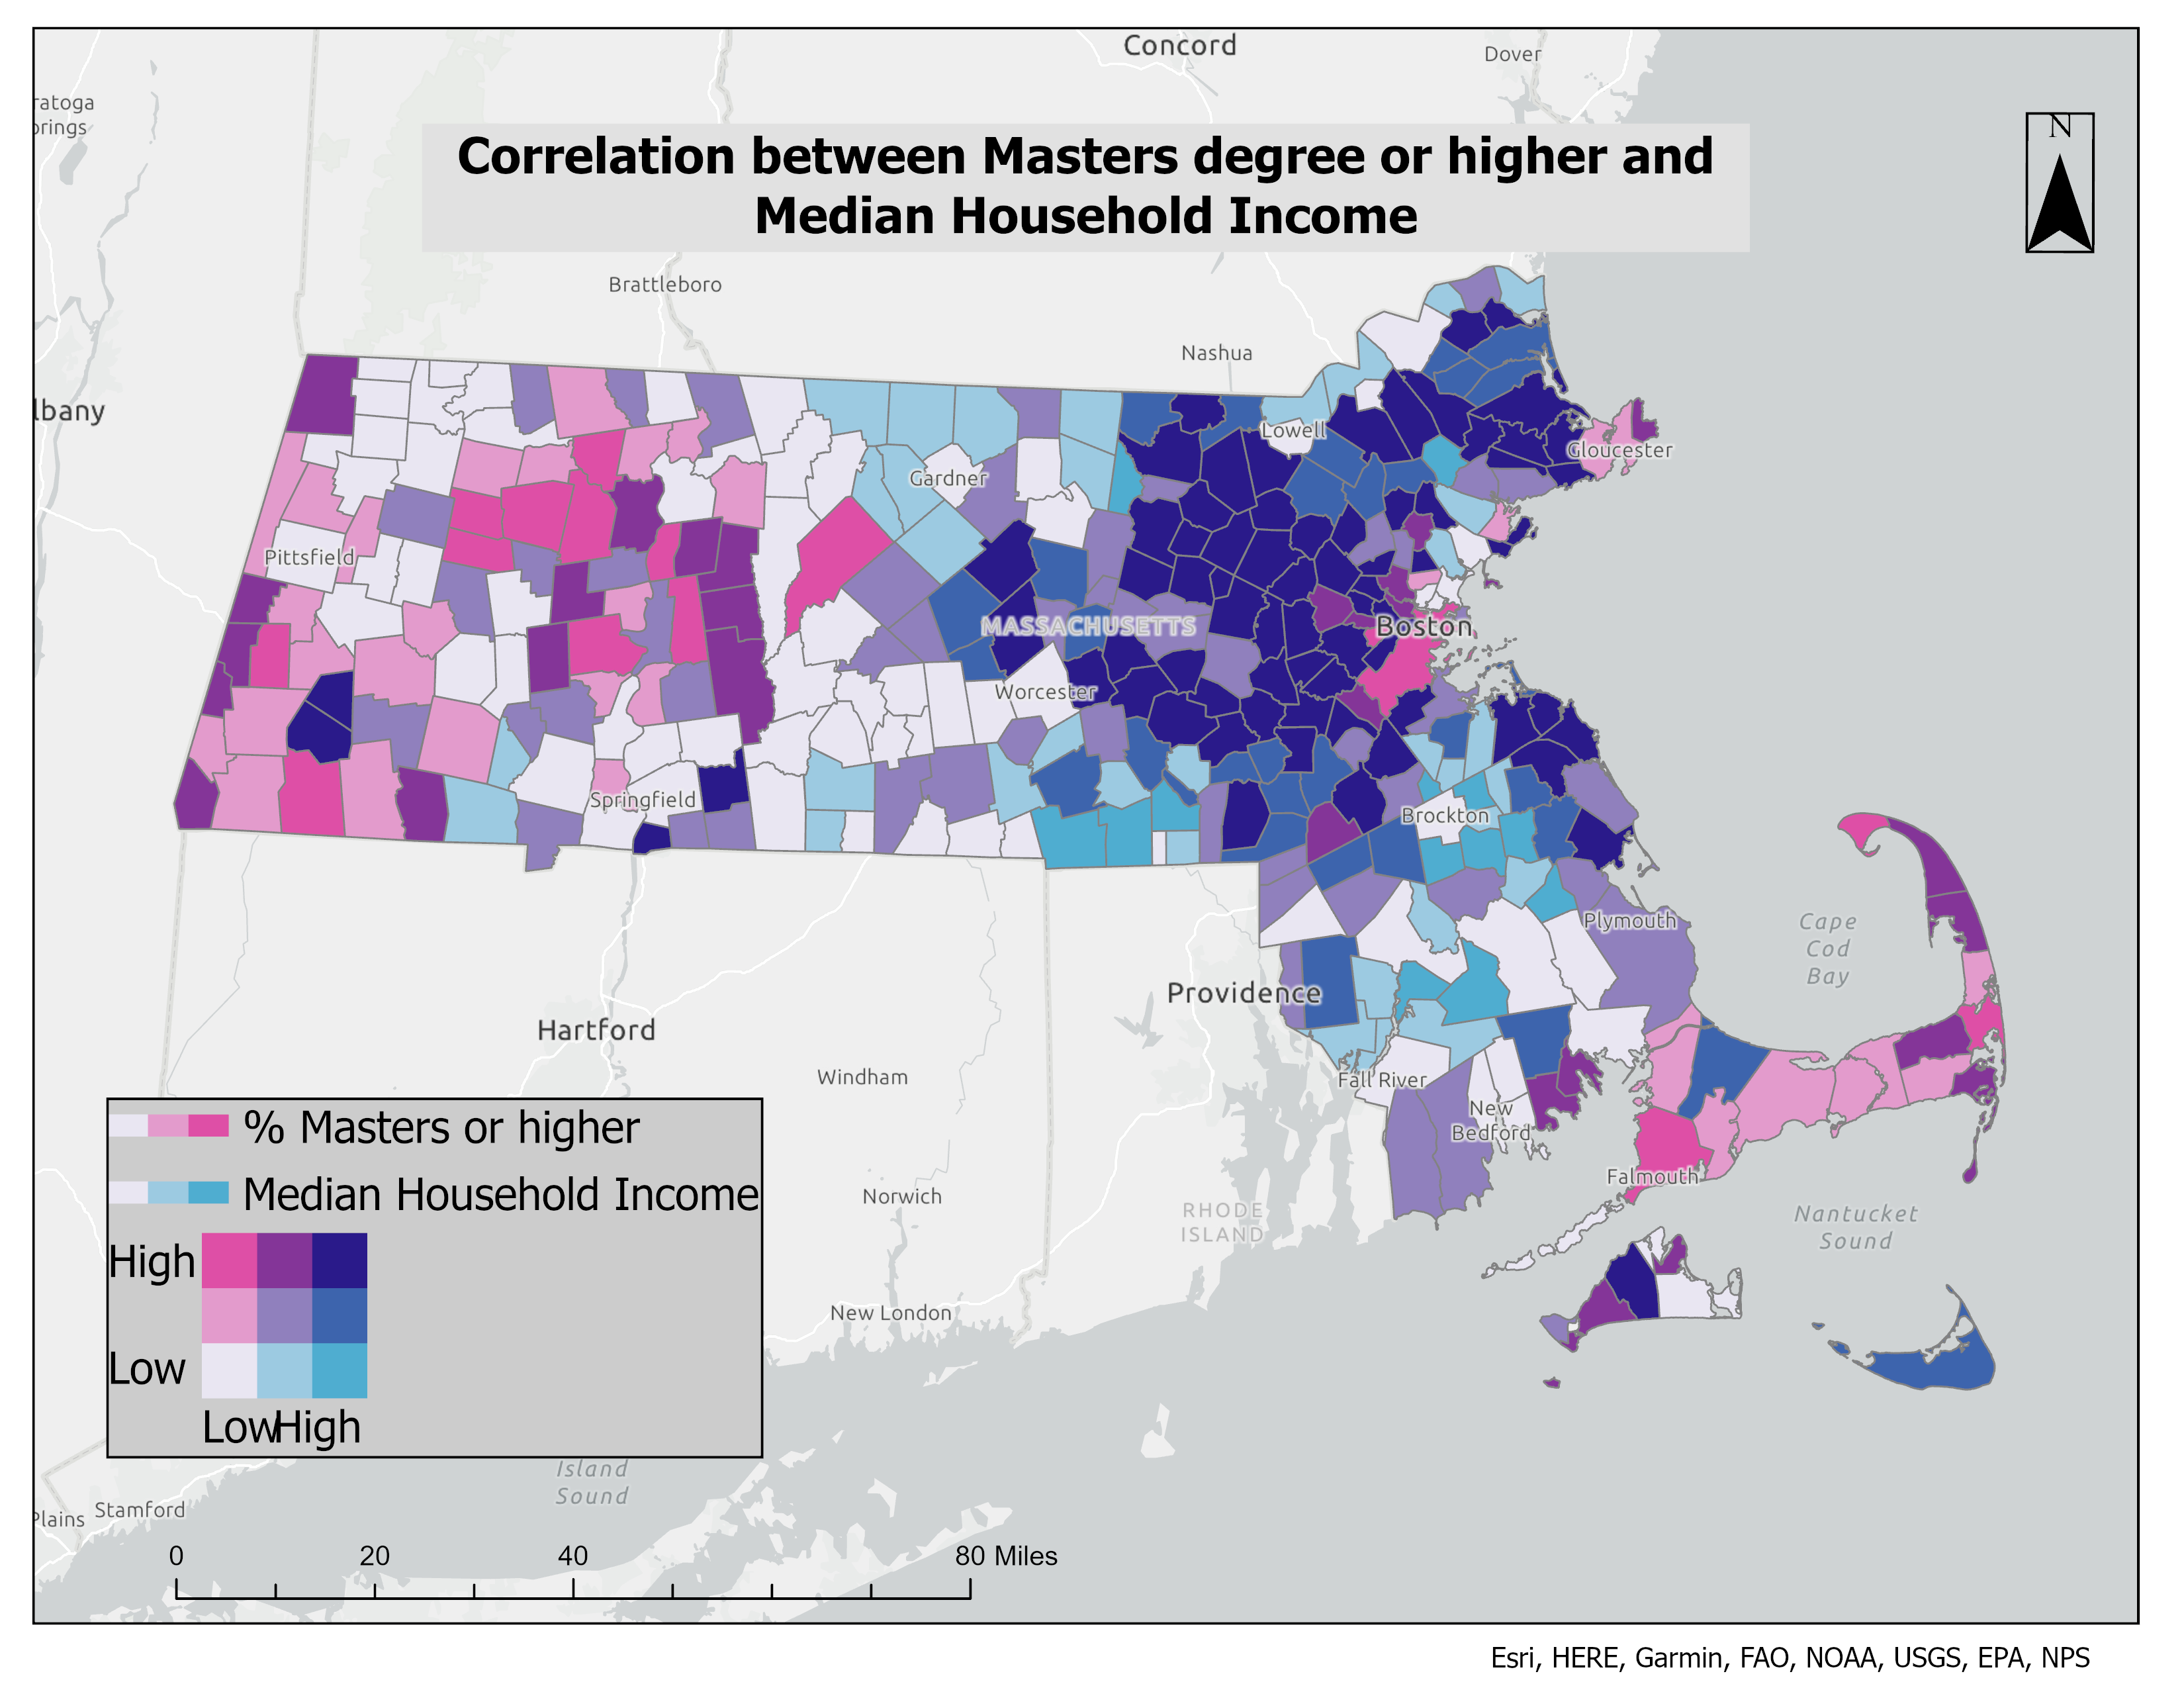
Education & Wealth in Massachusetts
Bivariate choropleth — median household income vs. educational attainment across MA municipalities. First GIS project.
ArcGIS Pro
Census ACS
Bivariate

Salem Evacuation Routes
Salem Emergency Evacuation Routes
arcpy network analysis weighted by FEMA flood zones and traffic volume — safest evacuation paths in a sea-rise scenario.
Python
arcpy
Network Analysis
FEMA
SSU Central Campus
SSU Central Campus Survey
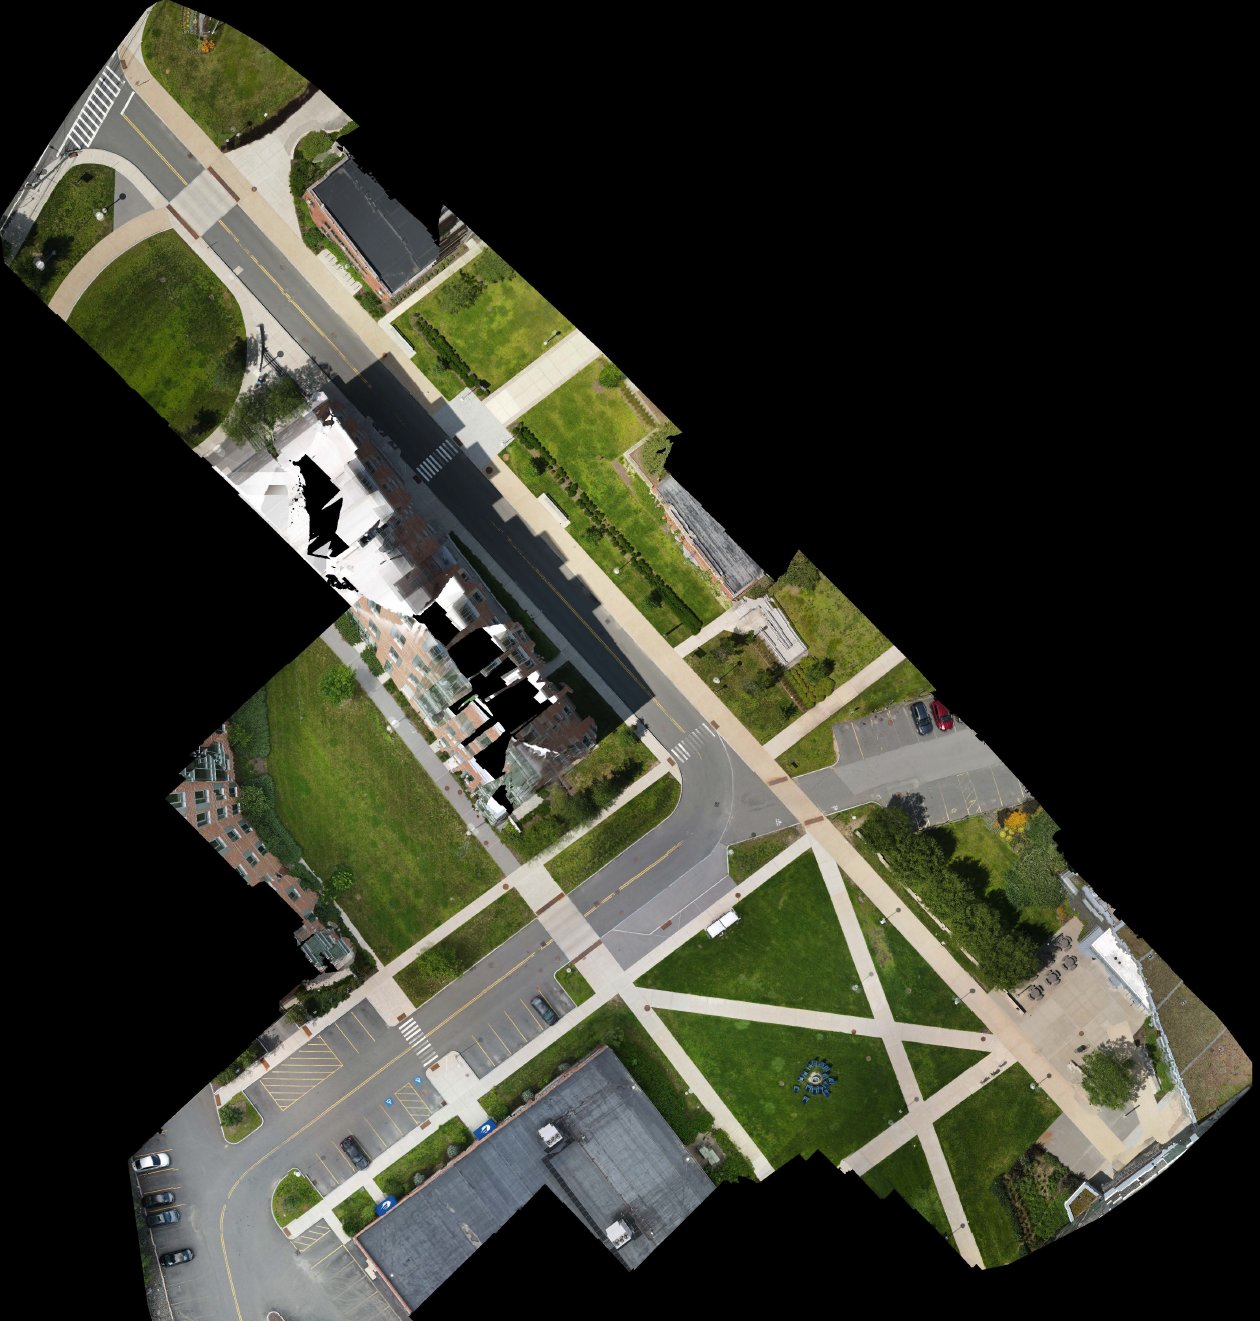
CAD drawings + drone orthomosaics + Trimble GPS ground-truthing combined into a single campus basemap.
UAV
Trimble GPS
CAD
ArcGIS Pro
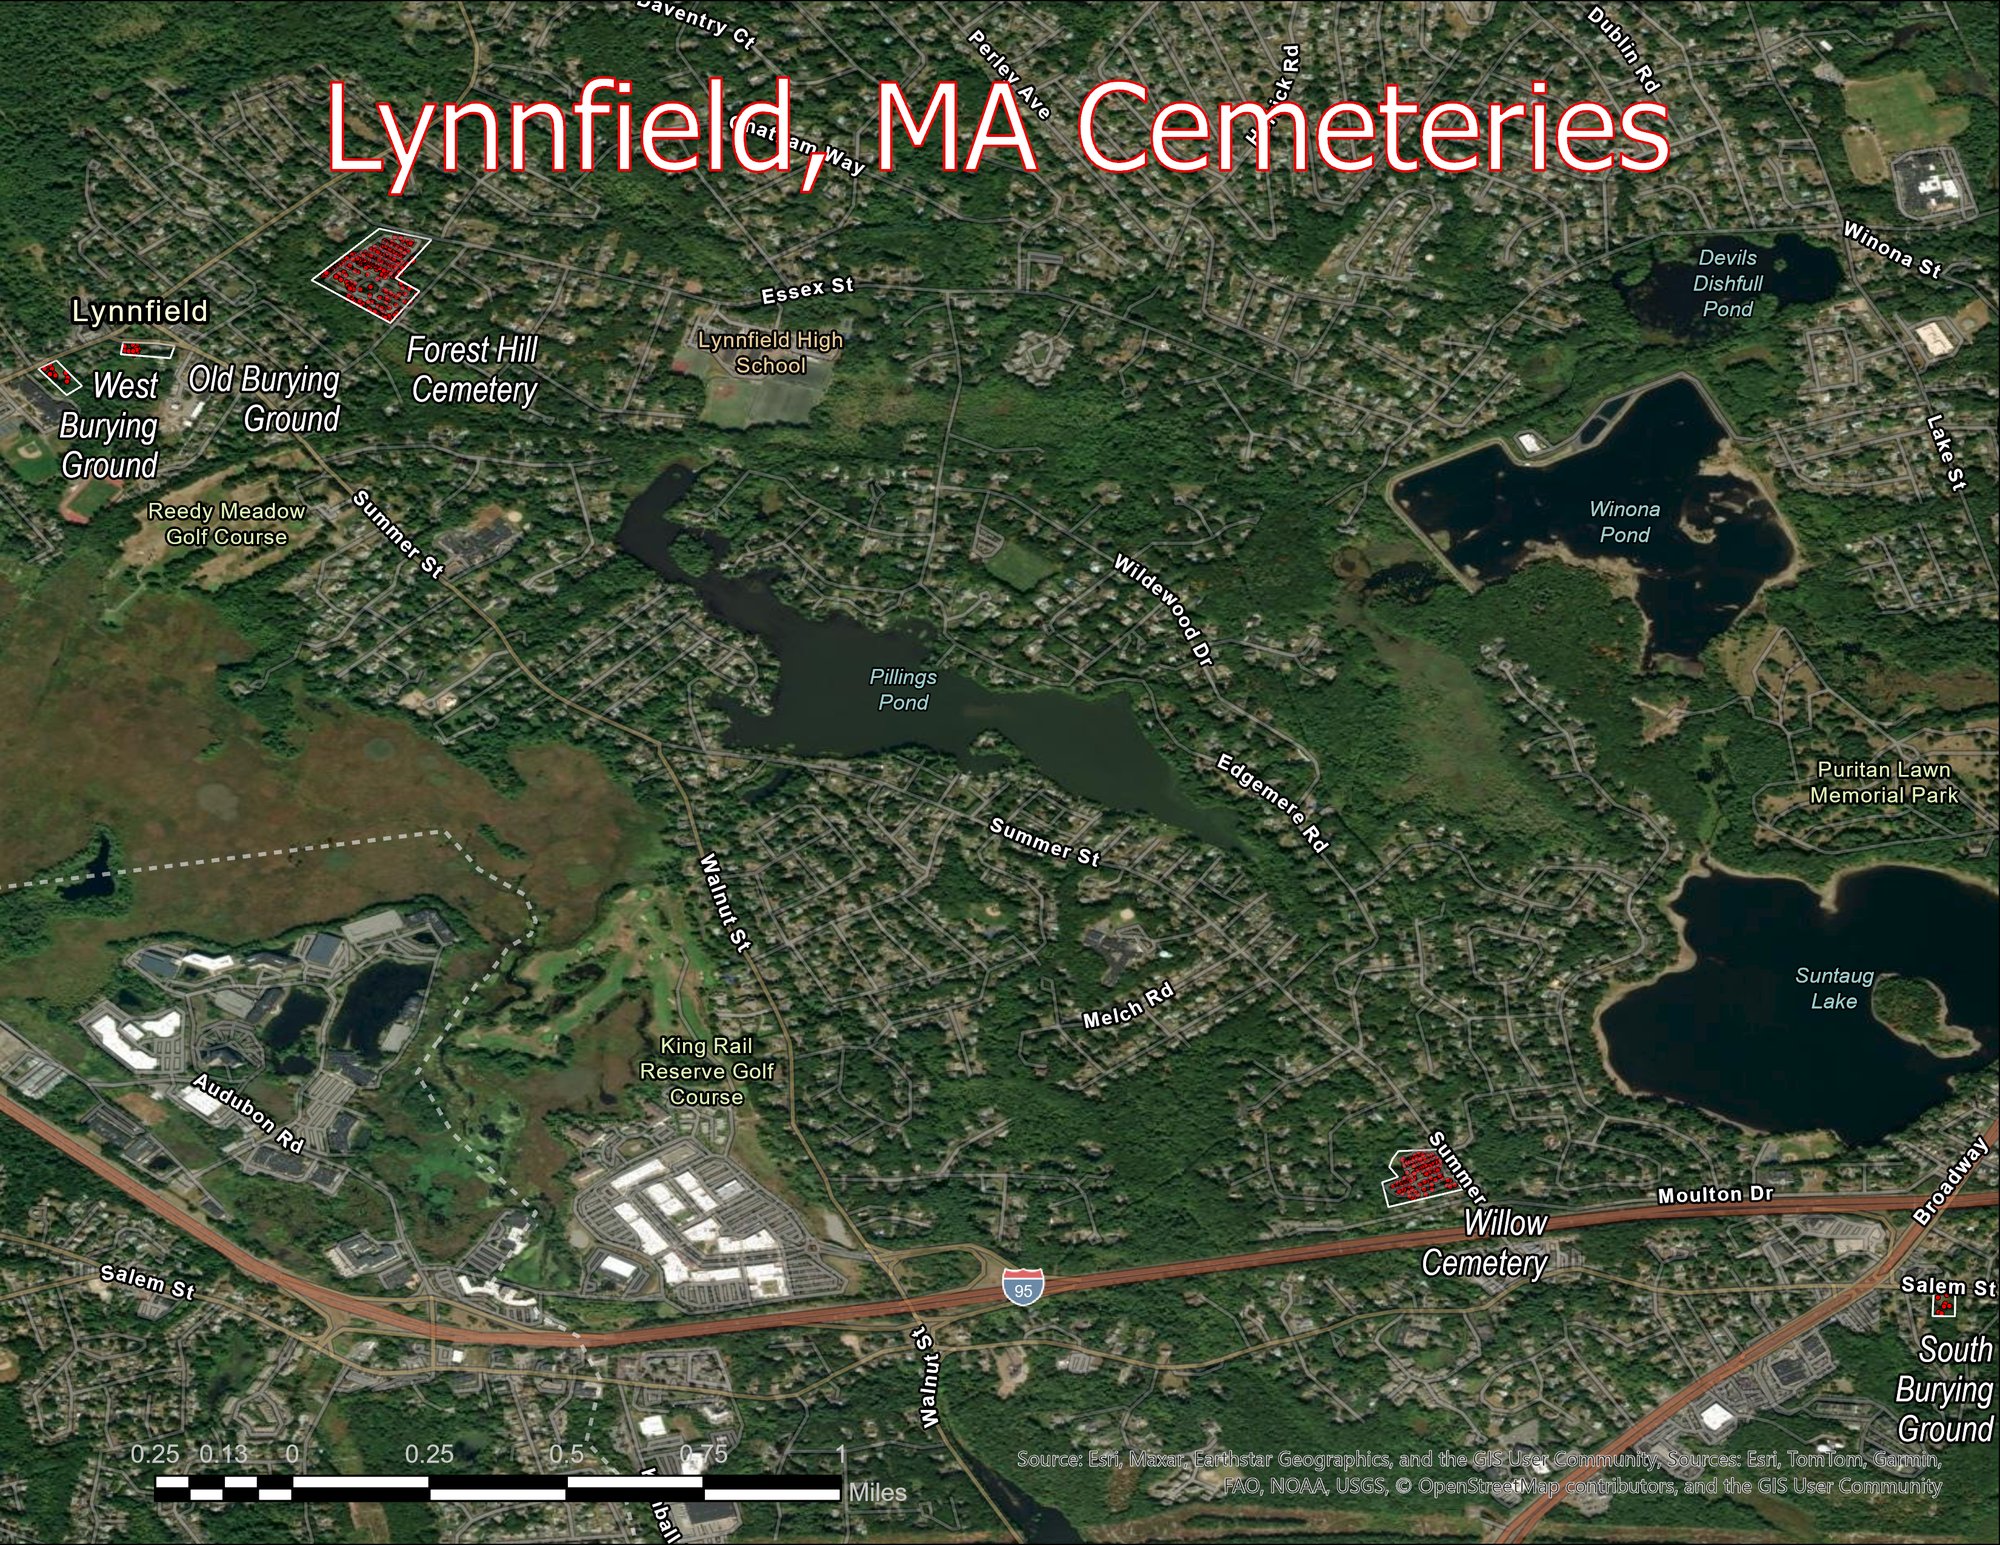
Lynnfield Cemetery Database
Lynnfield Cemetery Spatial Database
4,000+ grave cards digitized into a queryable SQL geodatabase. Historic cemetery maps georeferenced in ArcGIS Pro.
SQL
Geodatabase
Georeferencing

EV Charging Station Siting
Optimal EV Charging Station Siting
GIS-AHP MCDM framework for MA EV deployment — reviewing global literature and proposing an equity-aware spatial methodology.
GIS-AHP
MCDM
Network Analysis
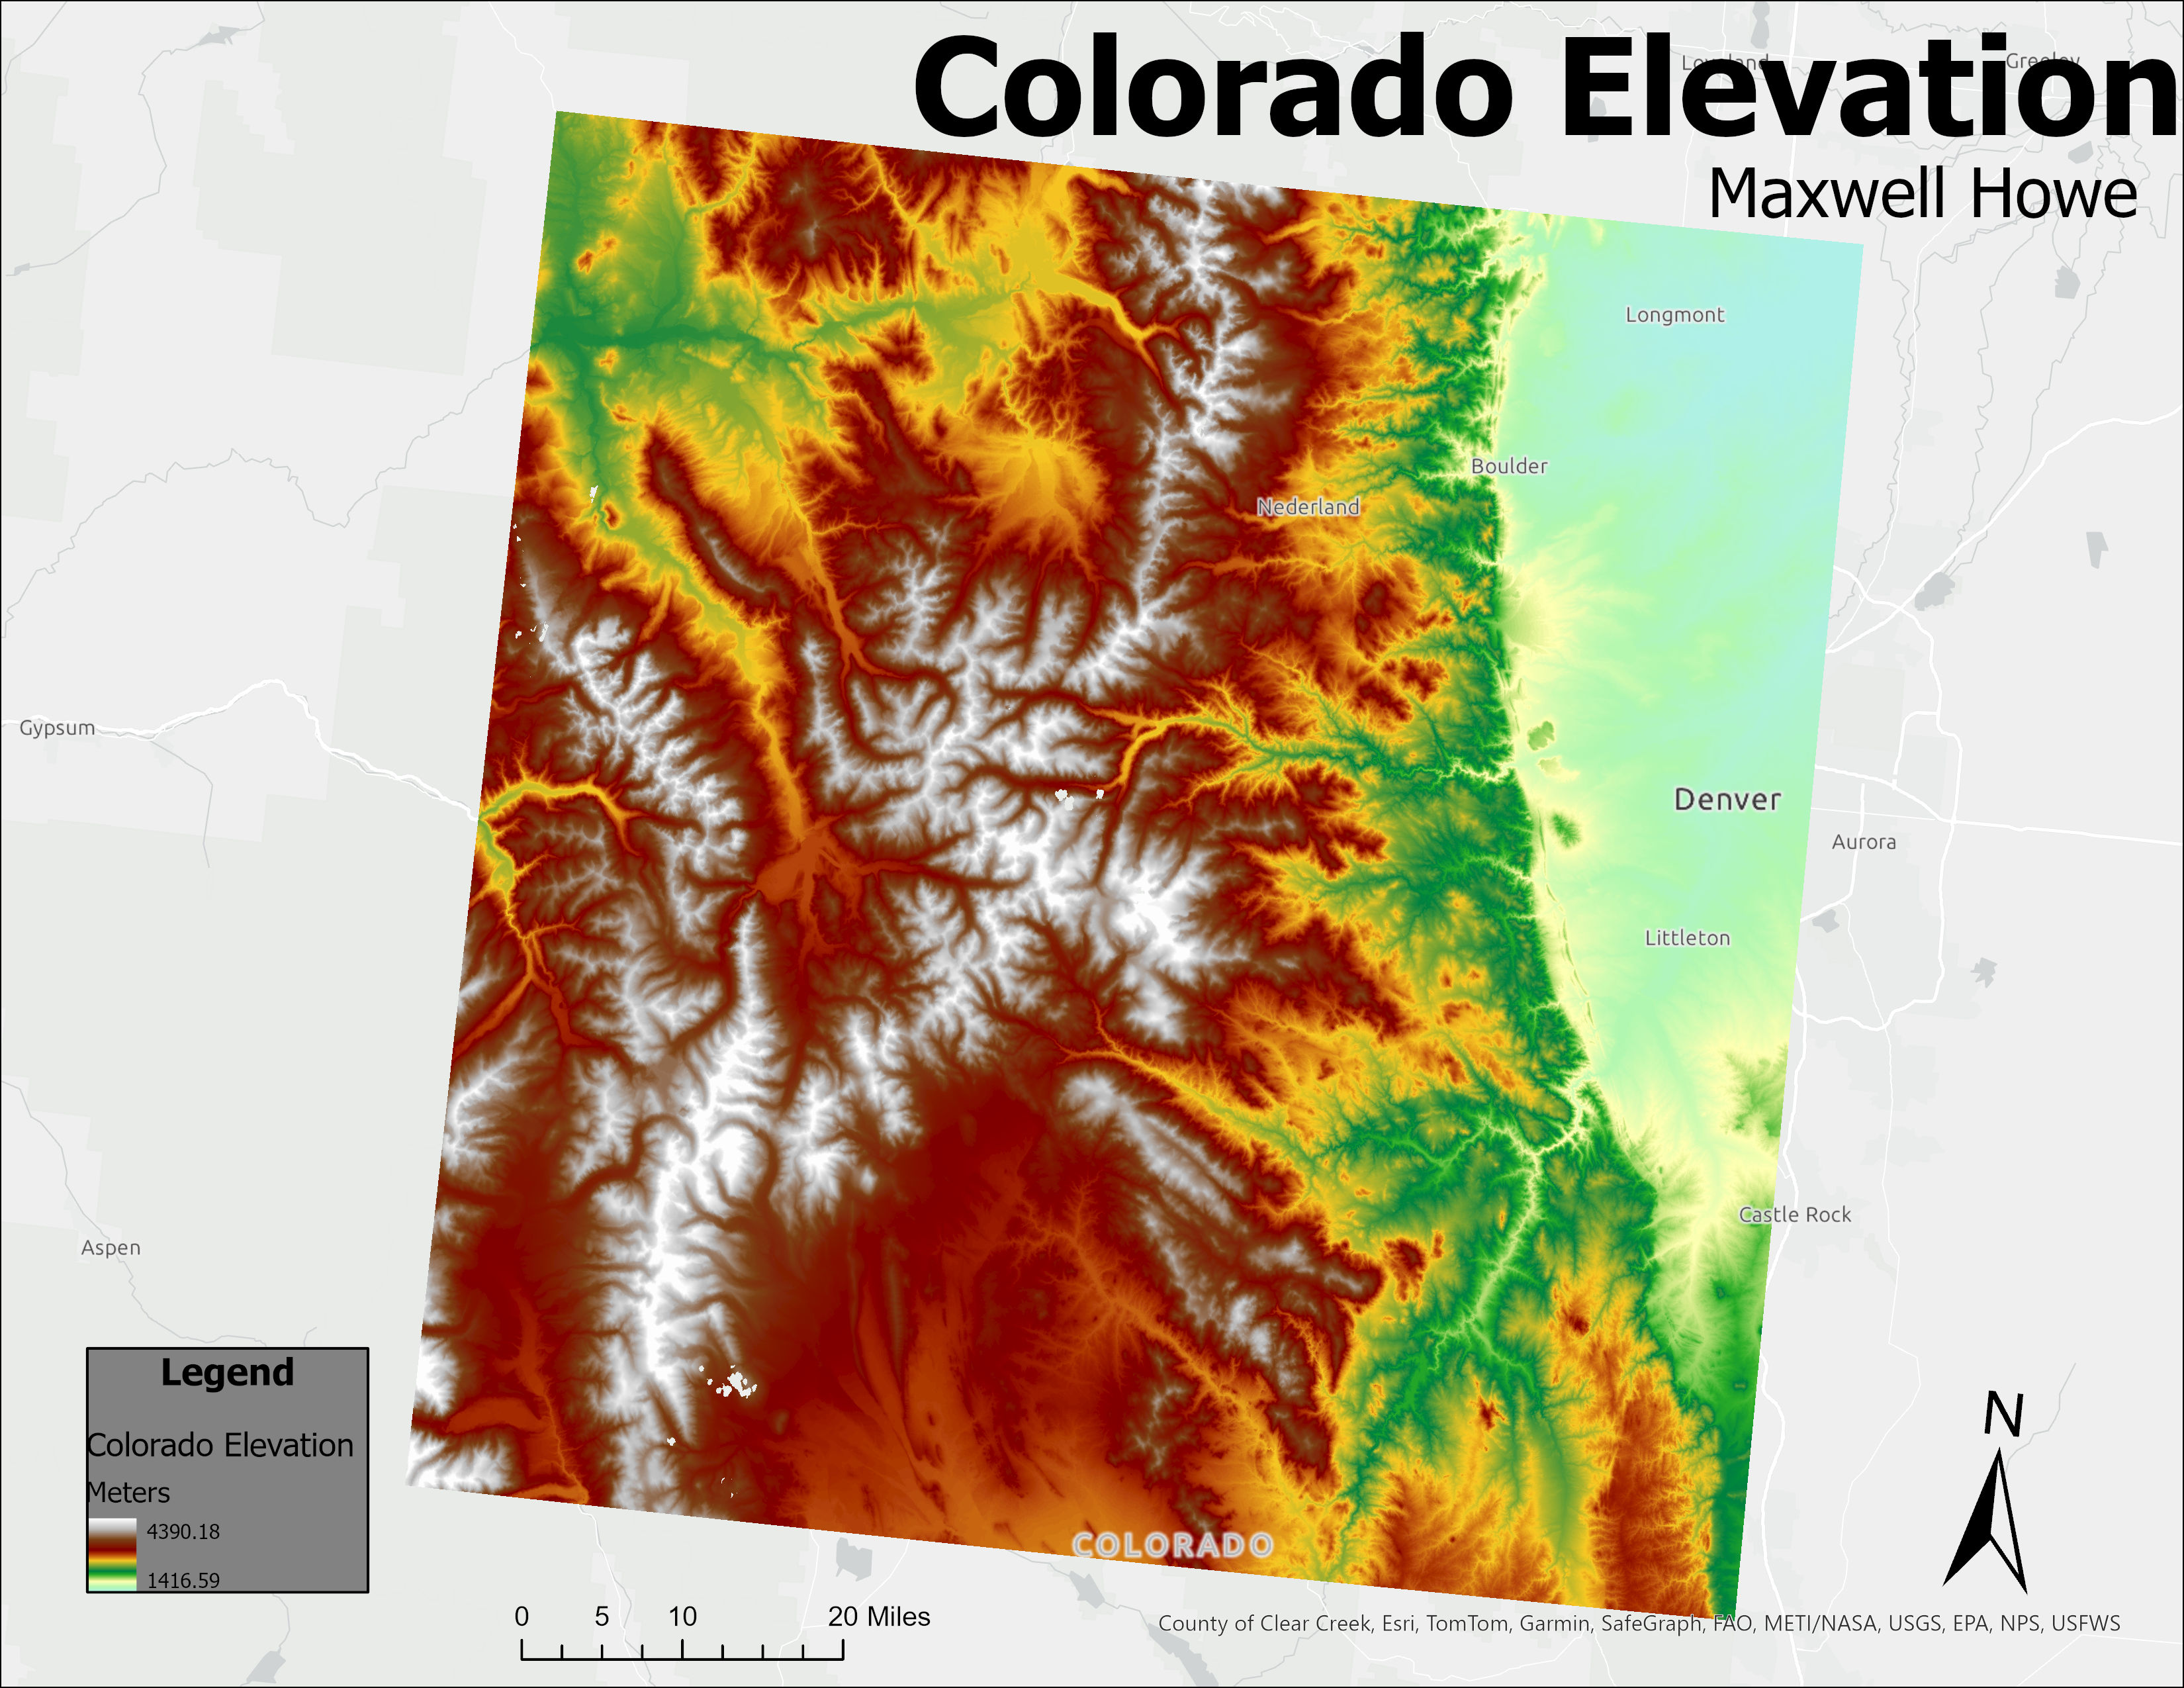
Colorado Elevation
Colorado Elevation
DEM visualized with hillshade and classified color ramp. ArcGIS Pro cartography exercise.
ArcGIS Pro
DEM
GPH946
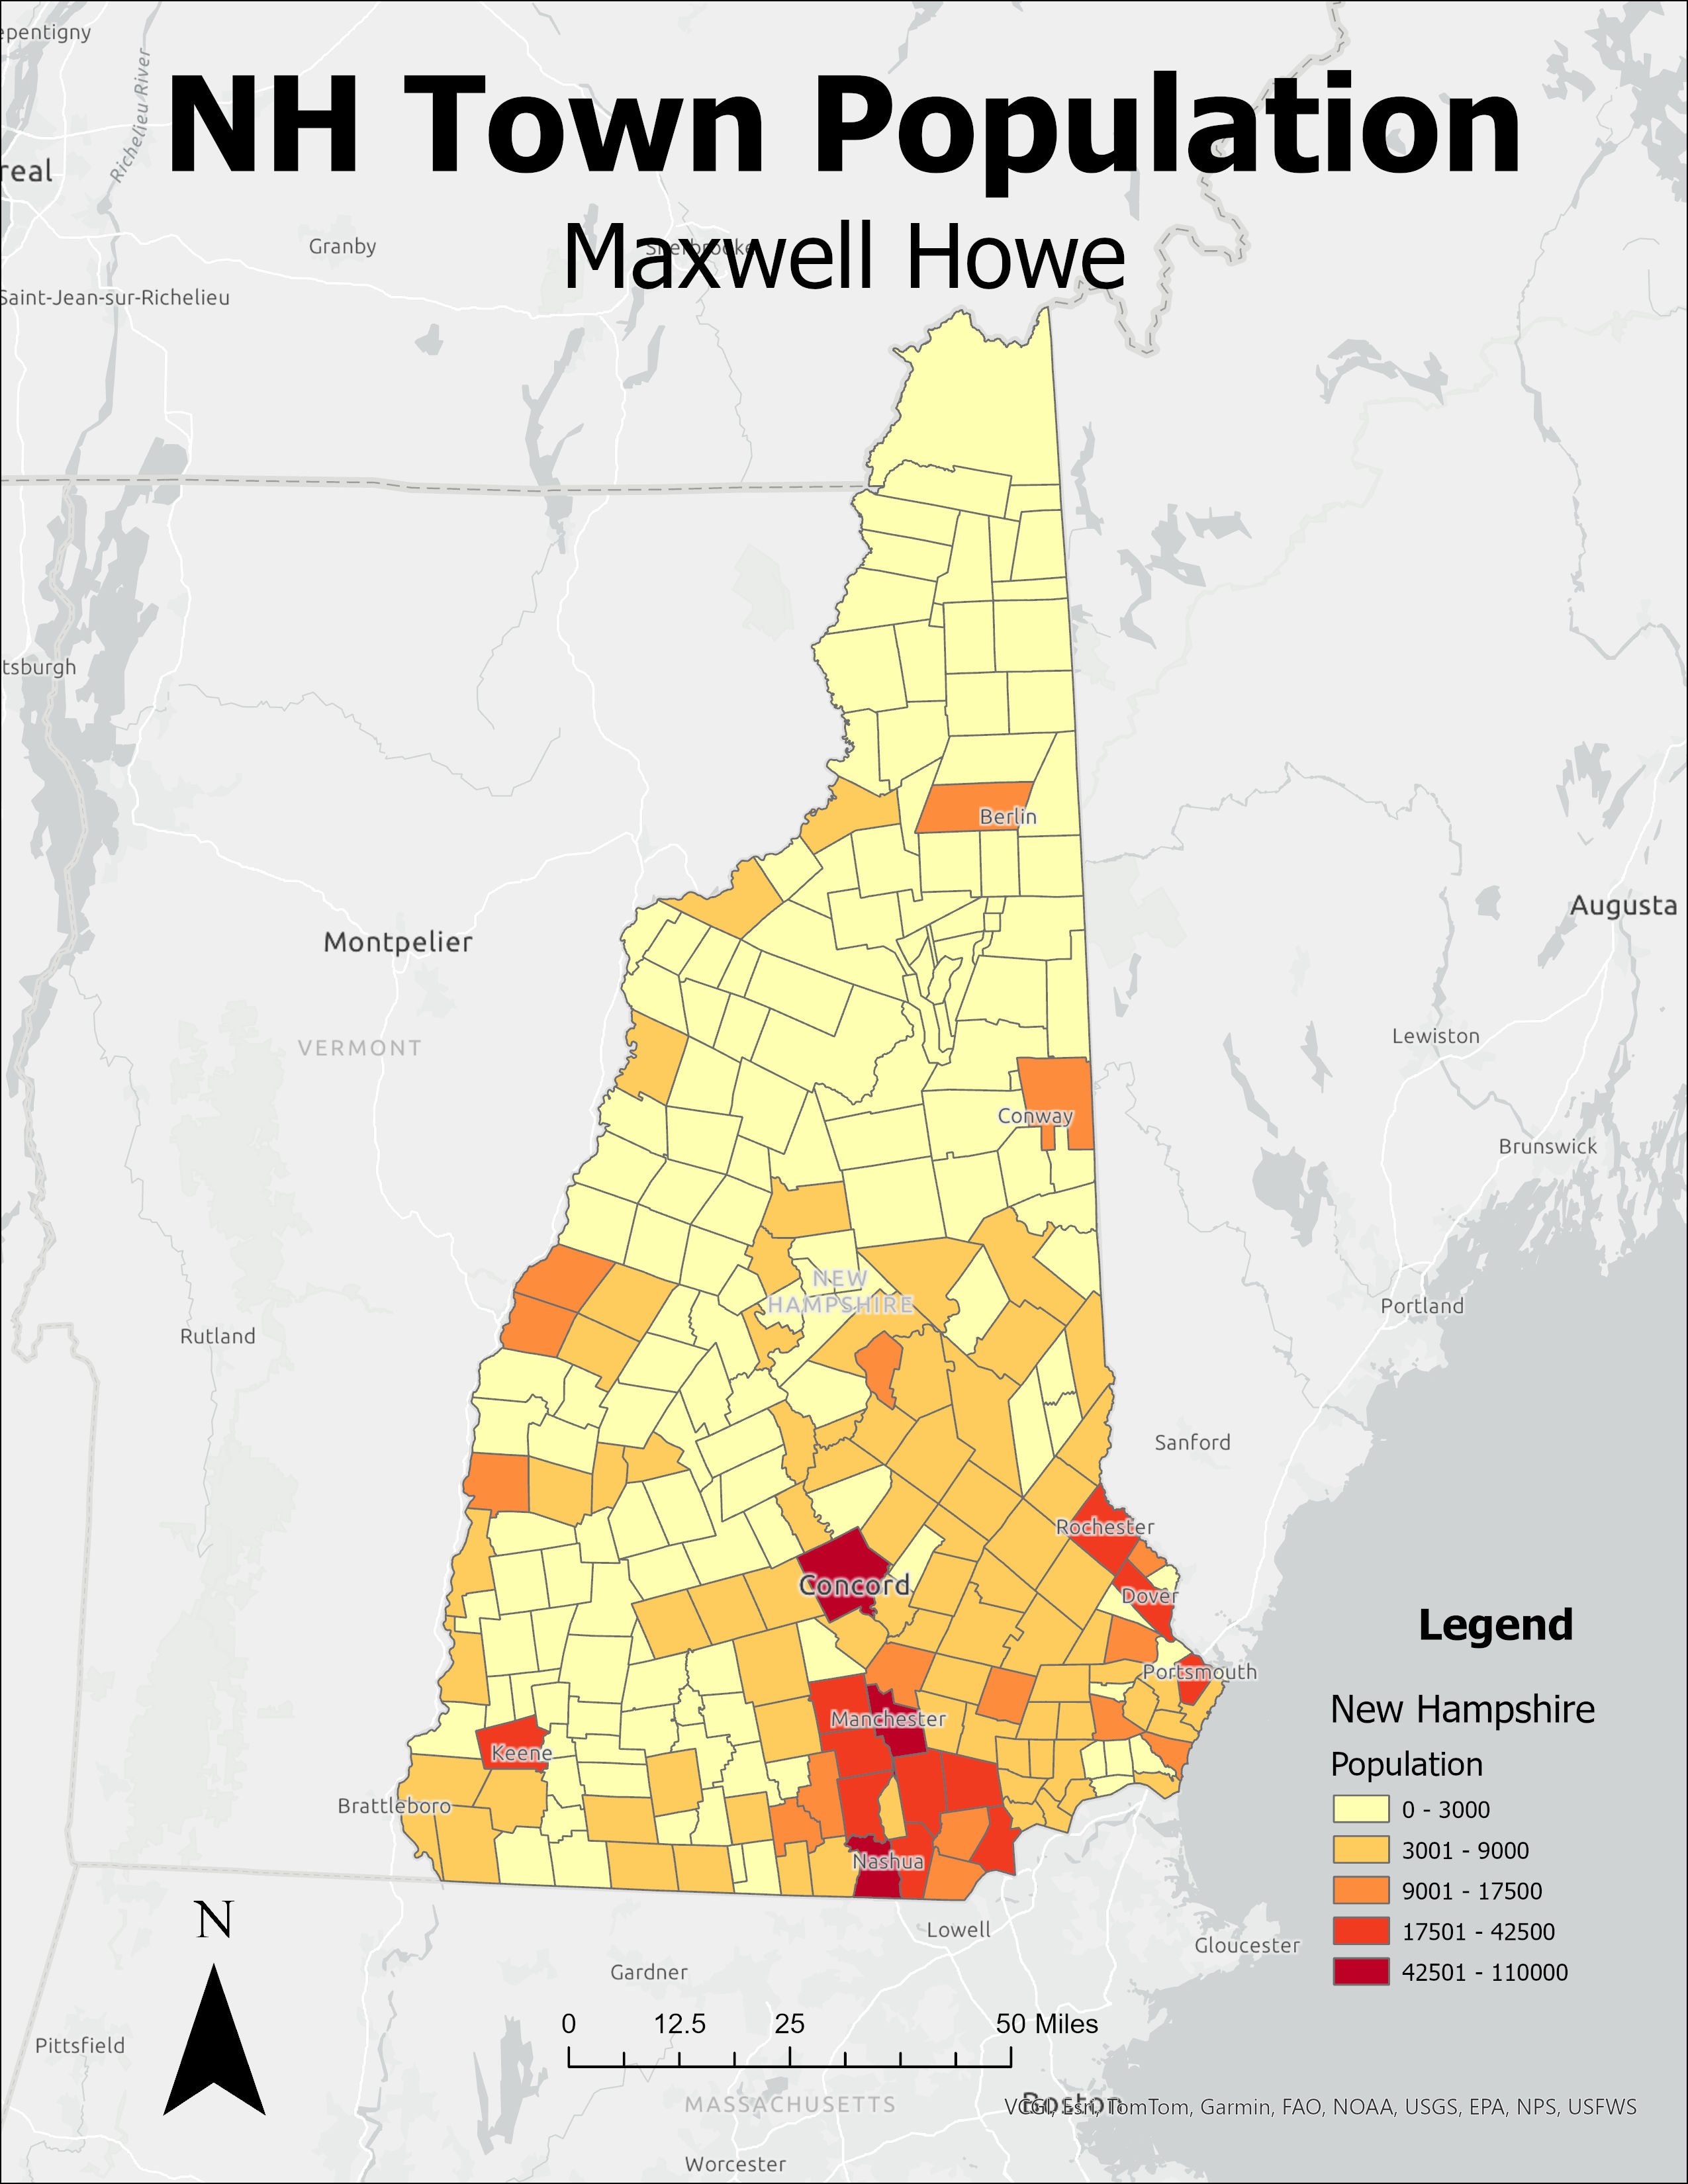
New Hampshire Population
New Hampshire Population
County-level choropleth. Thematic mapping exercise in ArcGIS Pro — classification, symbology, layout.
ArcGIS Pro
Choropleth
GPH946
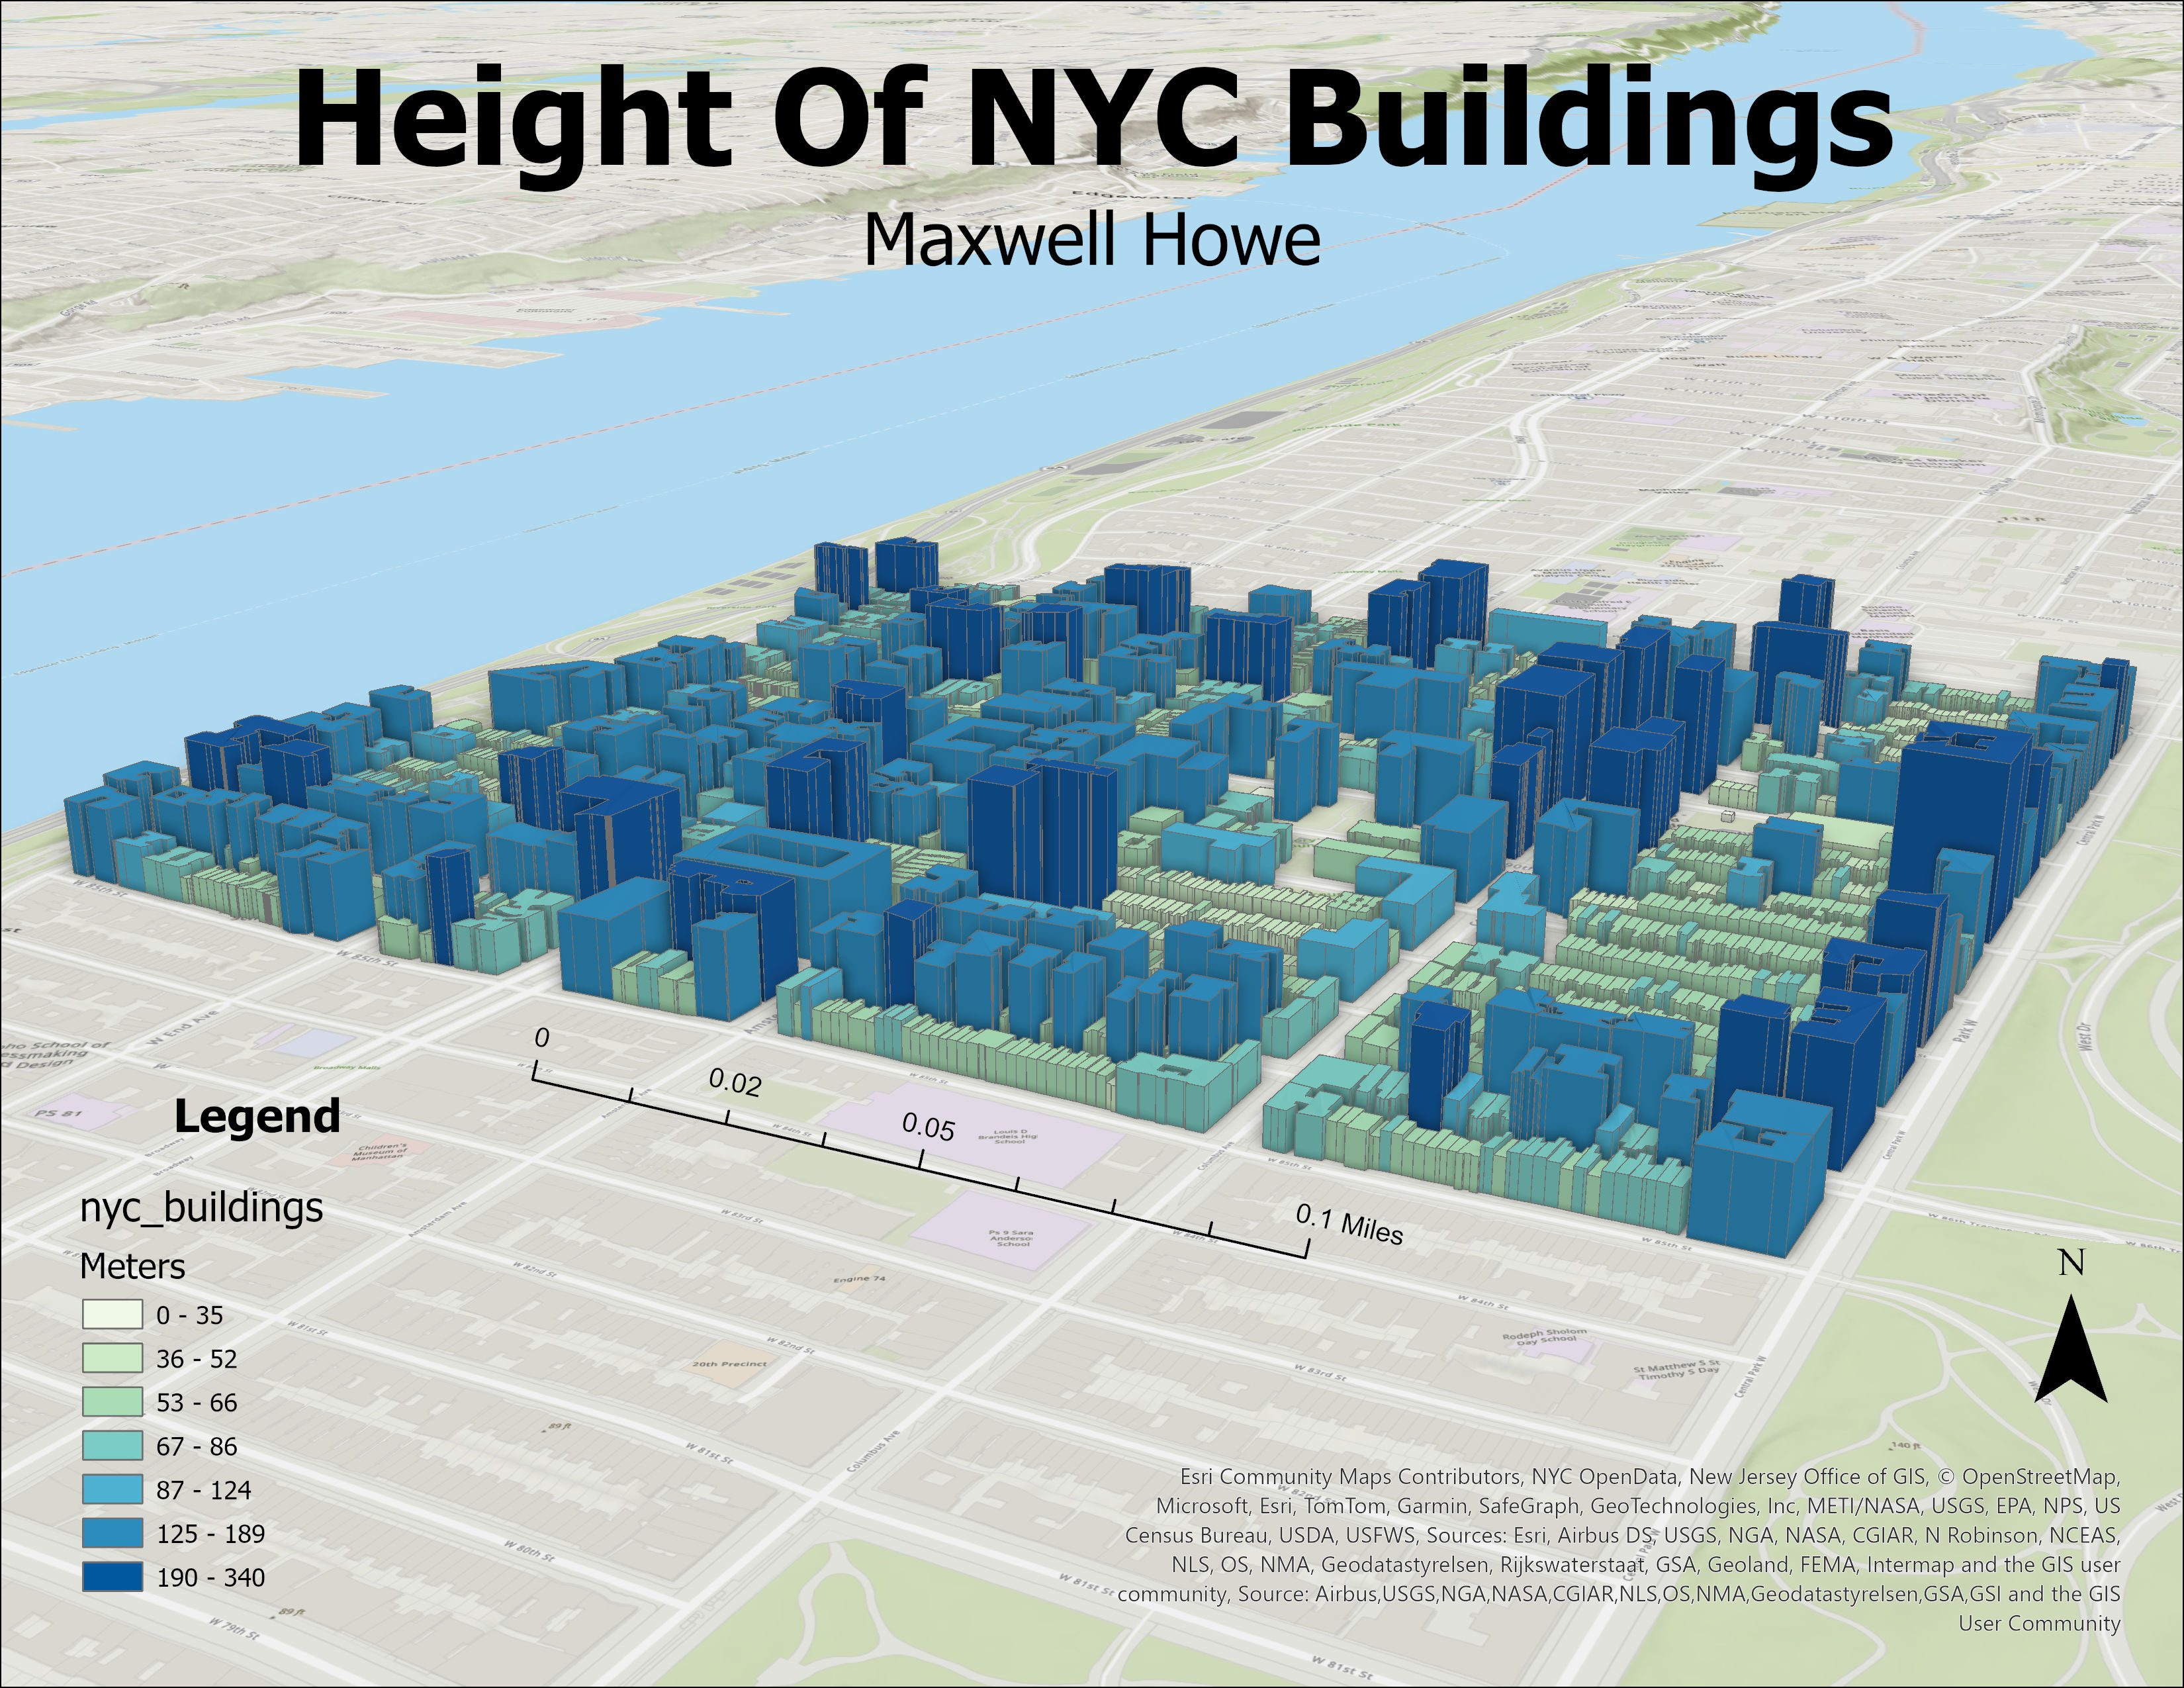
NYC Buildings
NYC Buildings
Building footprint visualization — urban density rendered at the individual structure level in ArcGIS Pro.
ArcGIS Pro
Urban Data
GPH946
US Area Codes
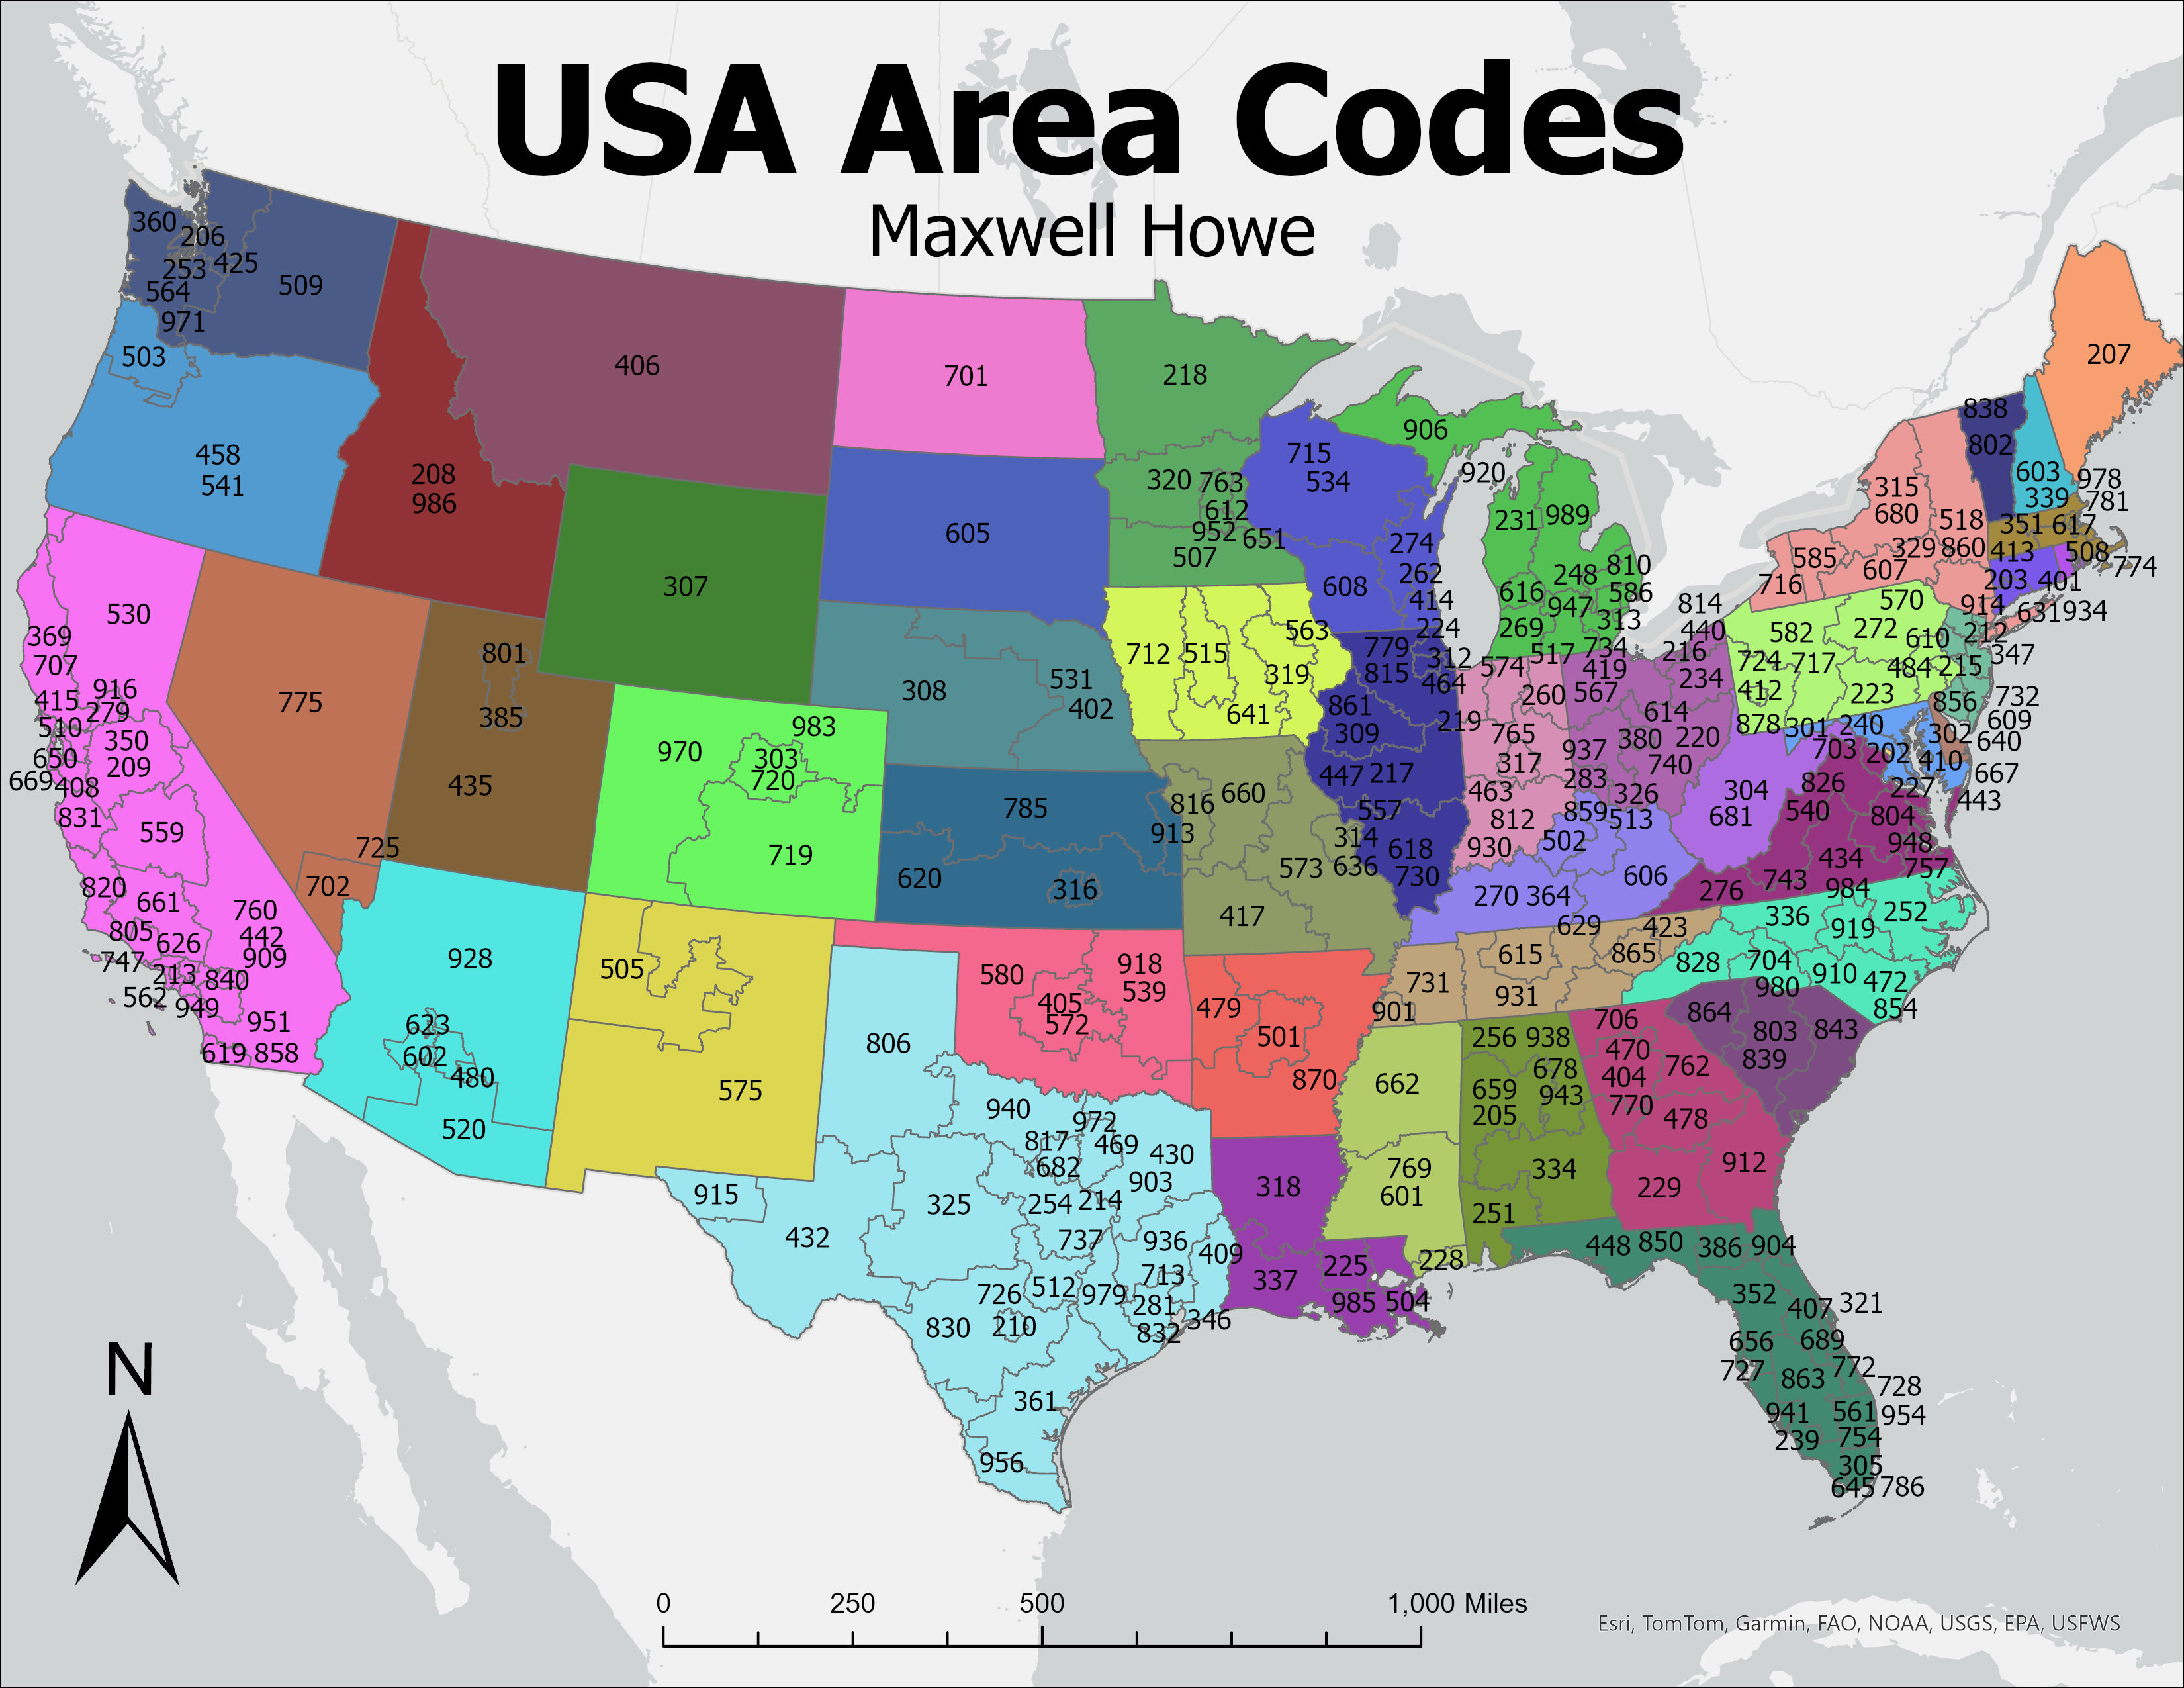
US Area Codes
Early piece — US area codes by region. Where I figured out nominal classification and legend design.
ArcGIS Pro
Nominal Data
GPH946
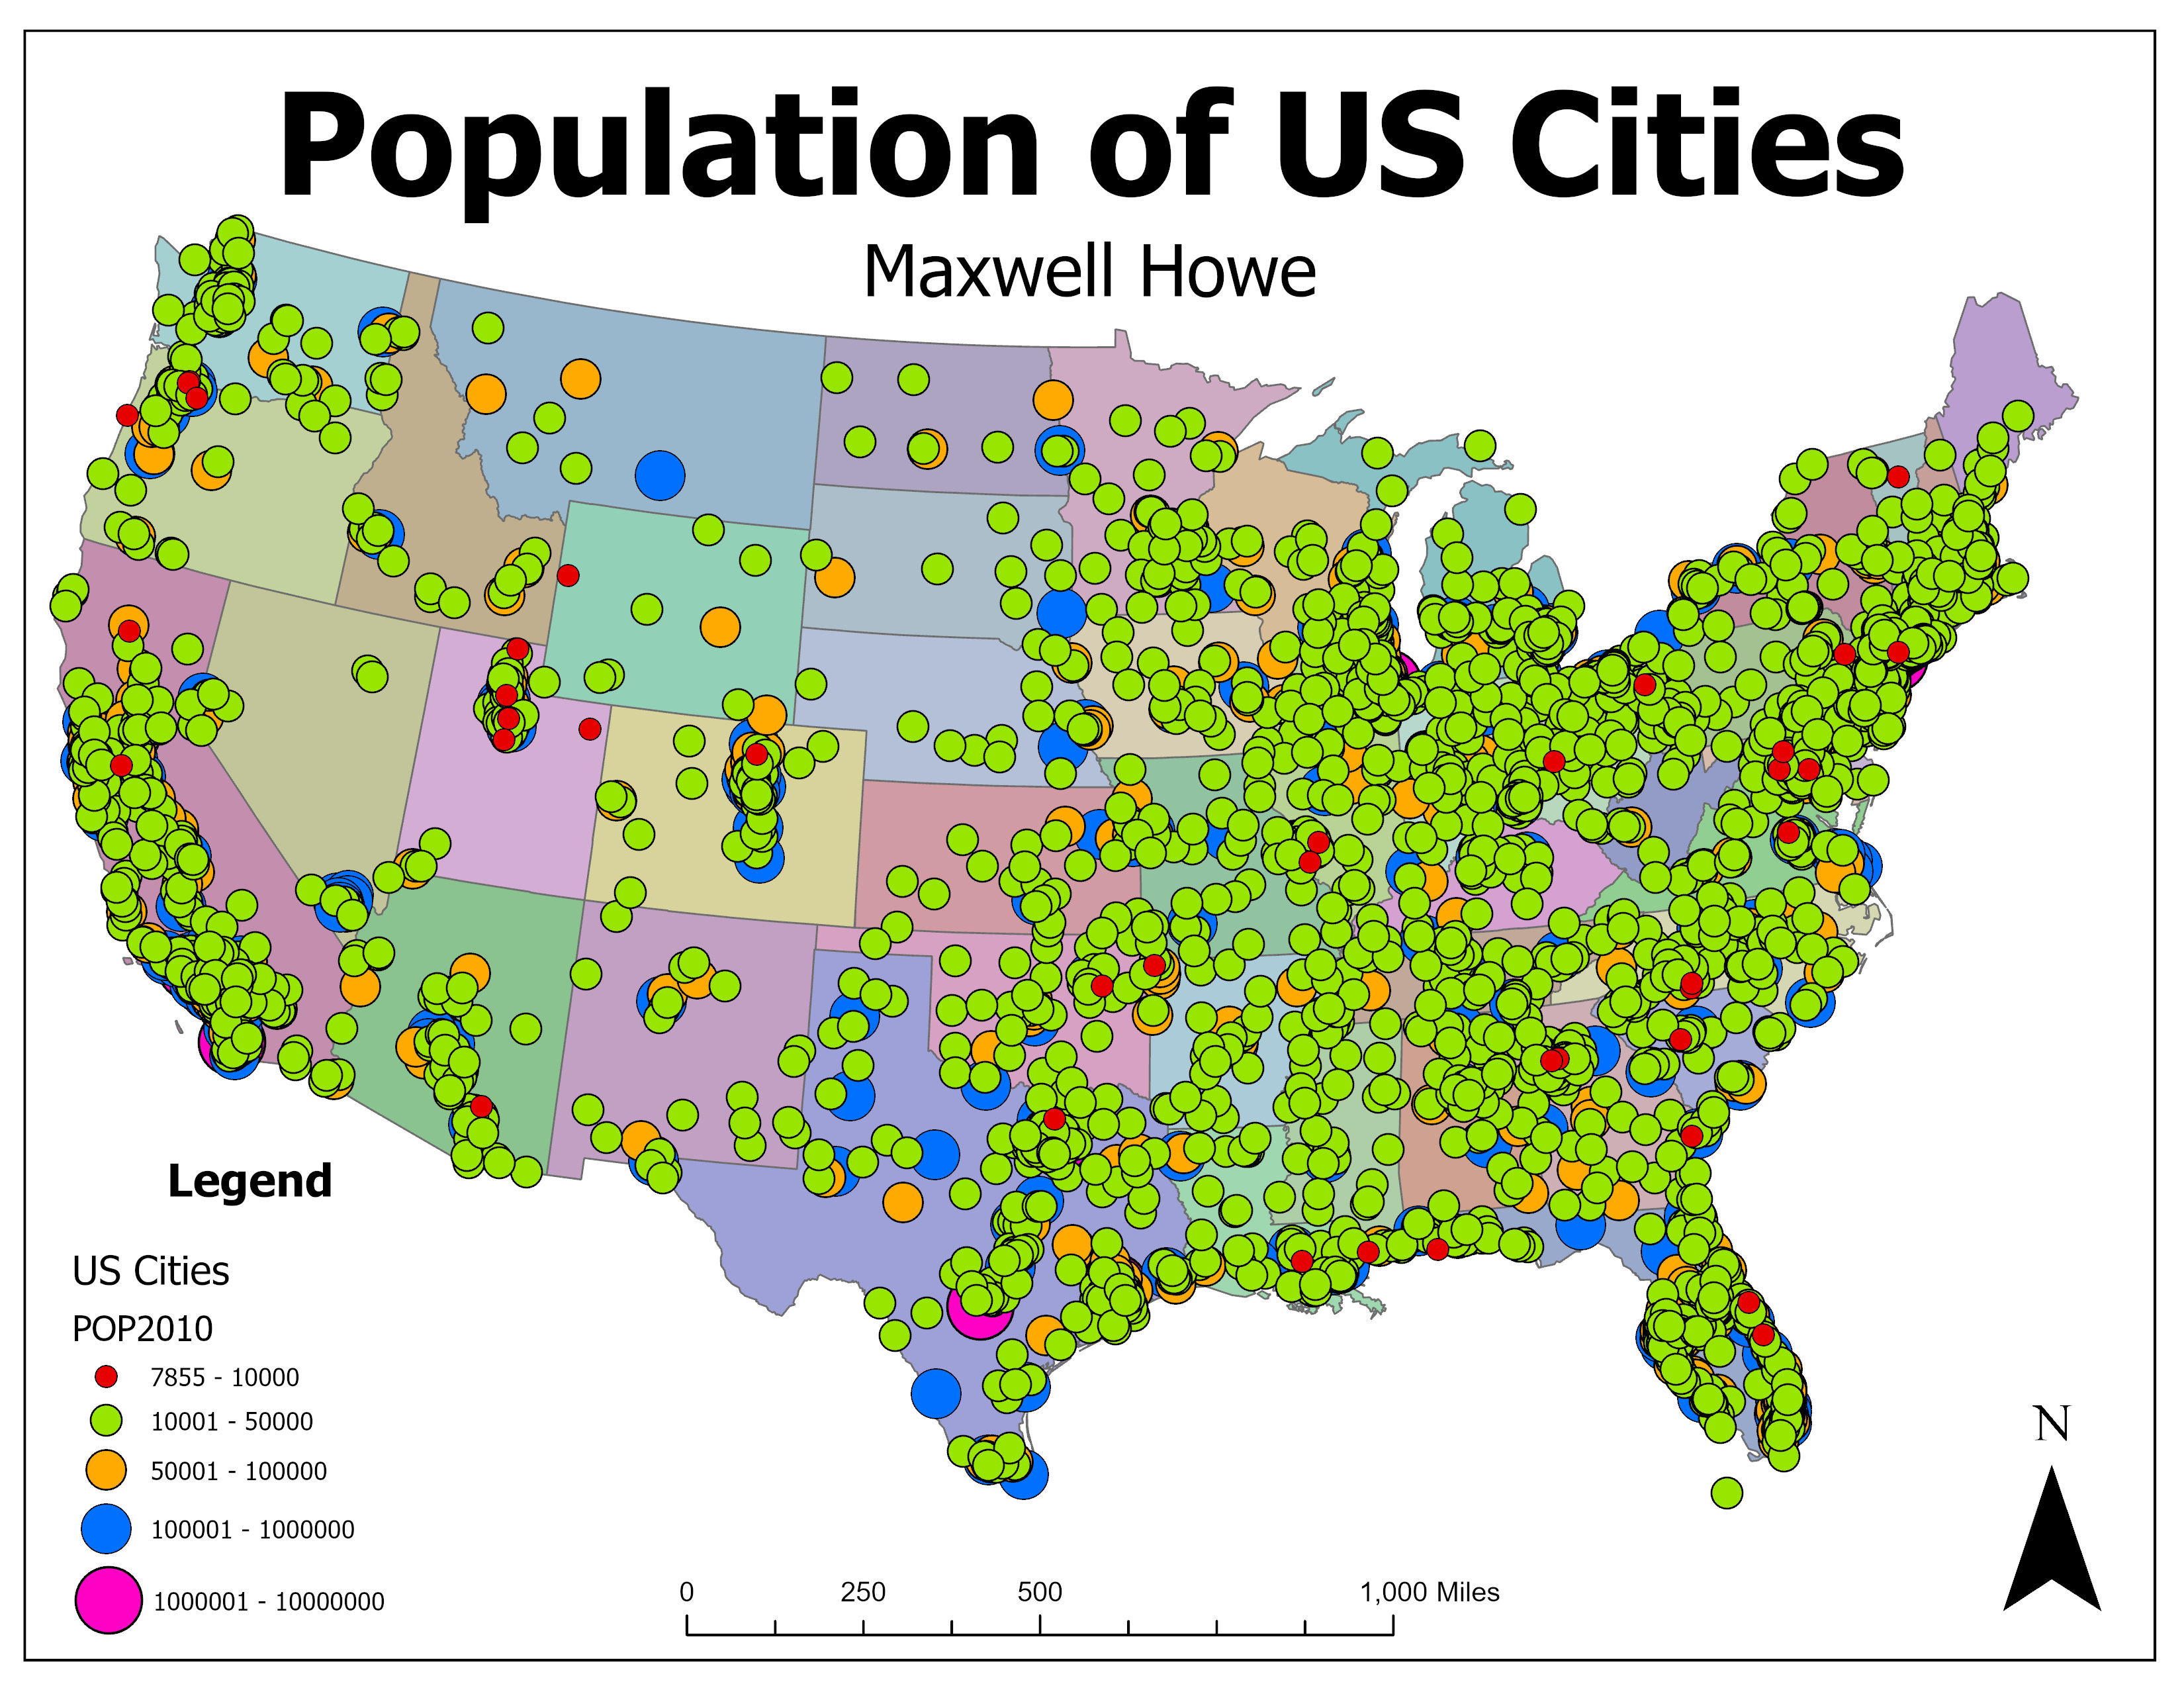
US Cities
US Cities
Early piece — US cities with proportional symbols. Learning visual hierarchy and graduated point symbology.
ArcGIS Pro
Proportional Symbols
GPH946
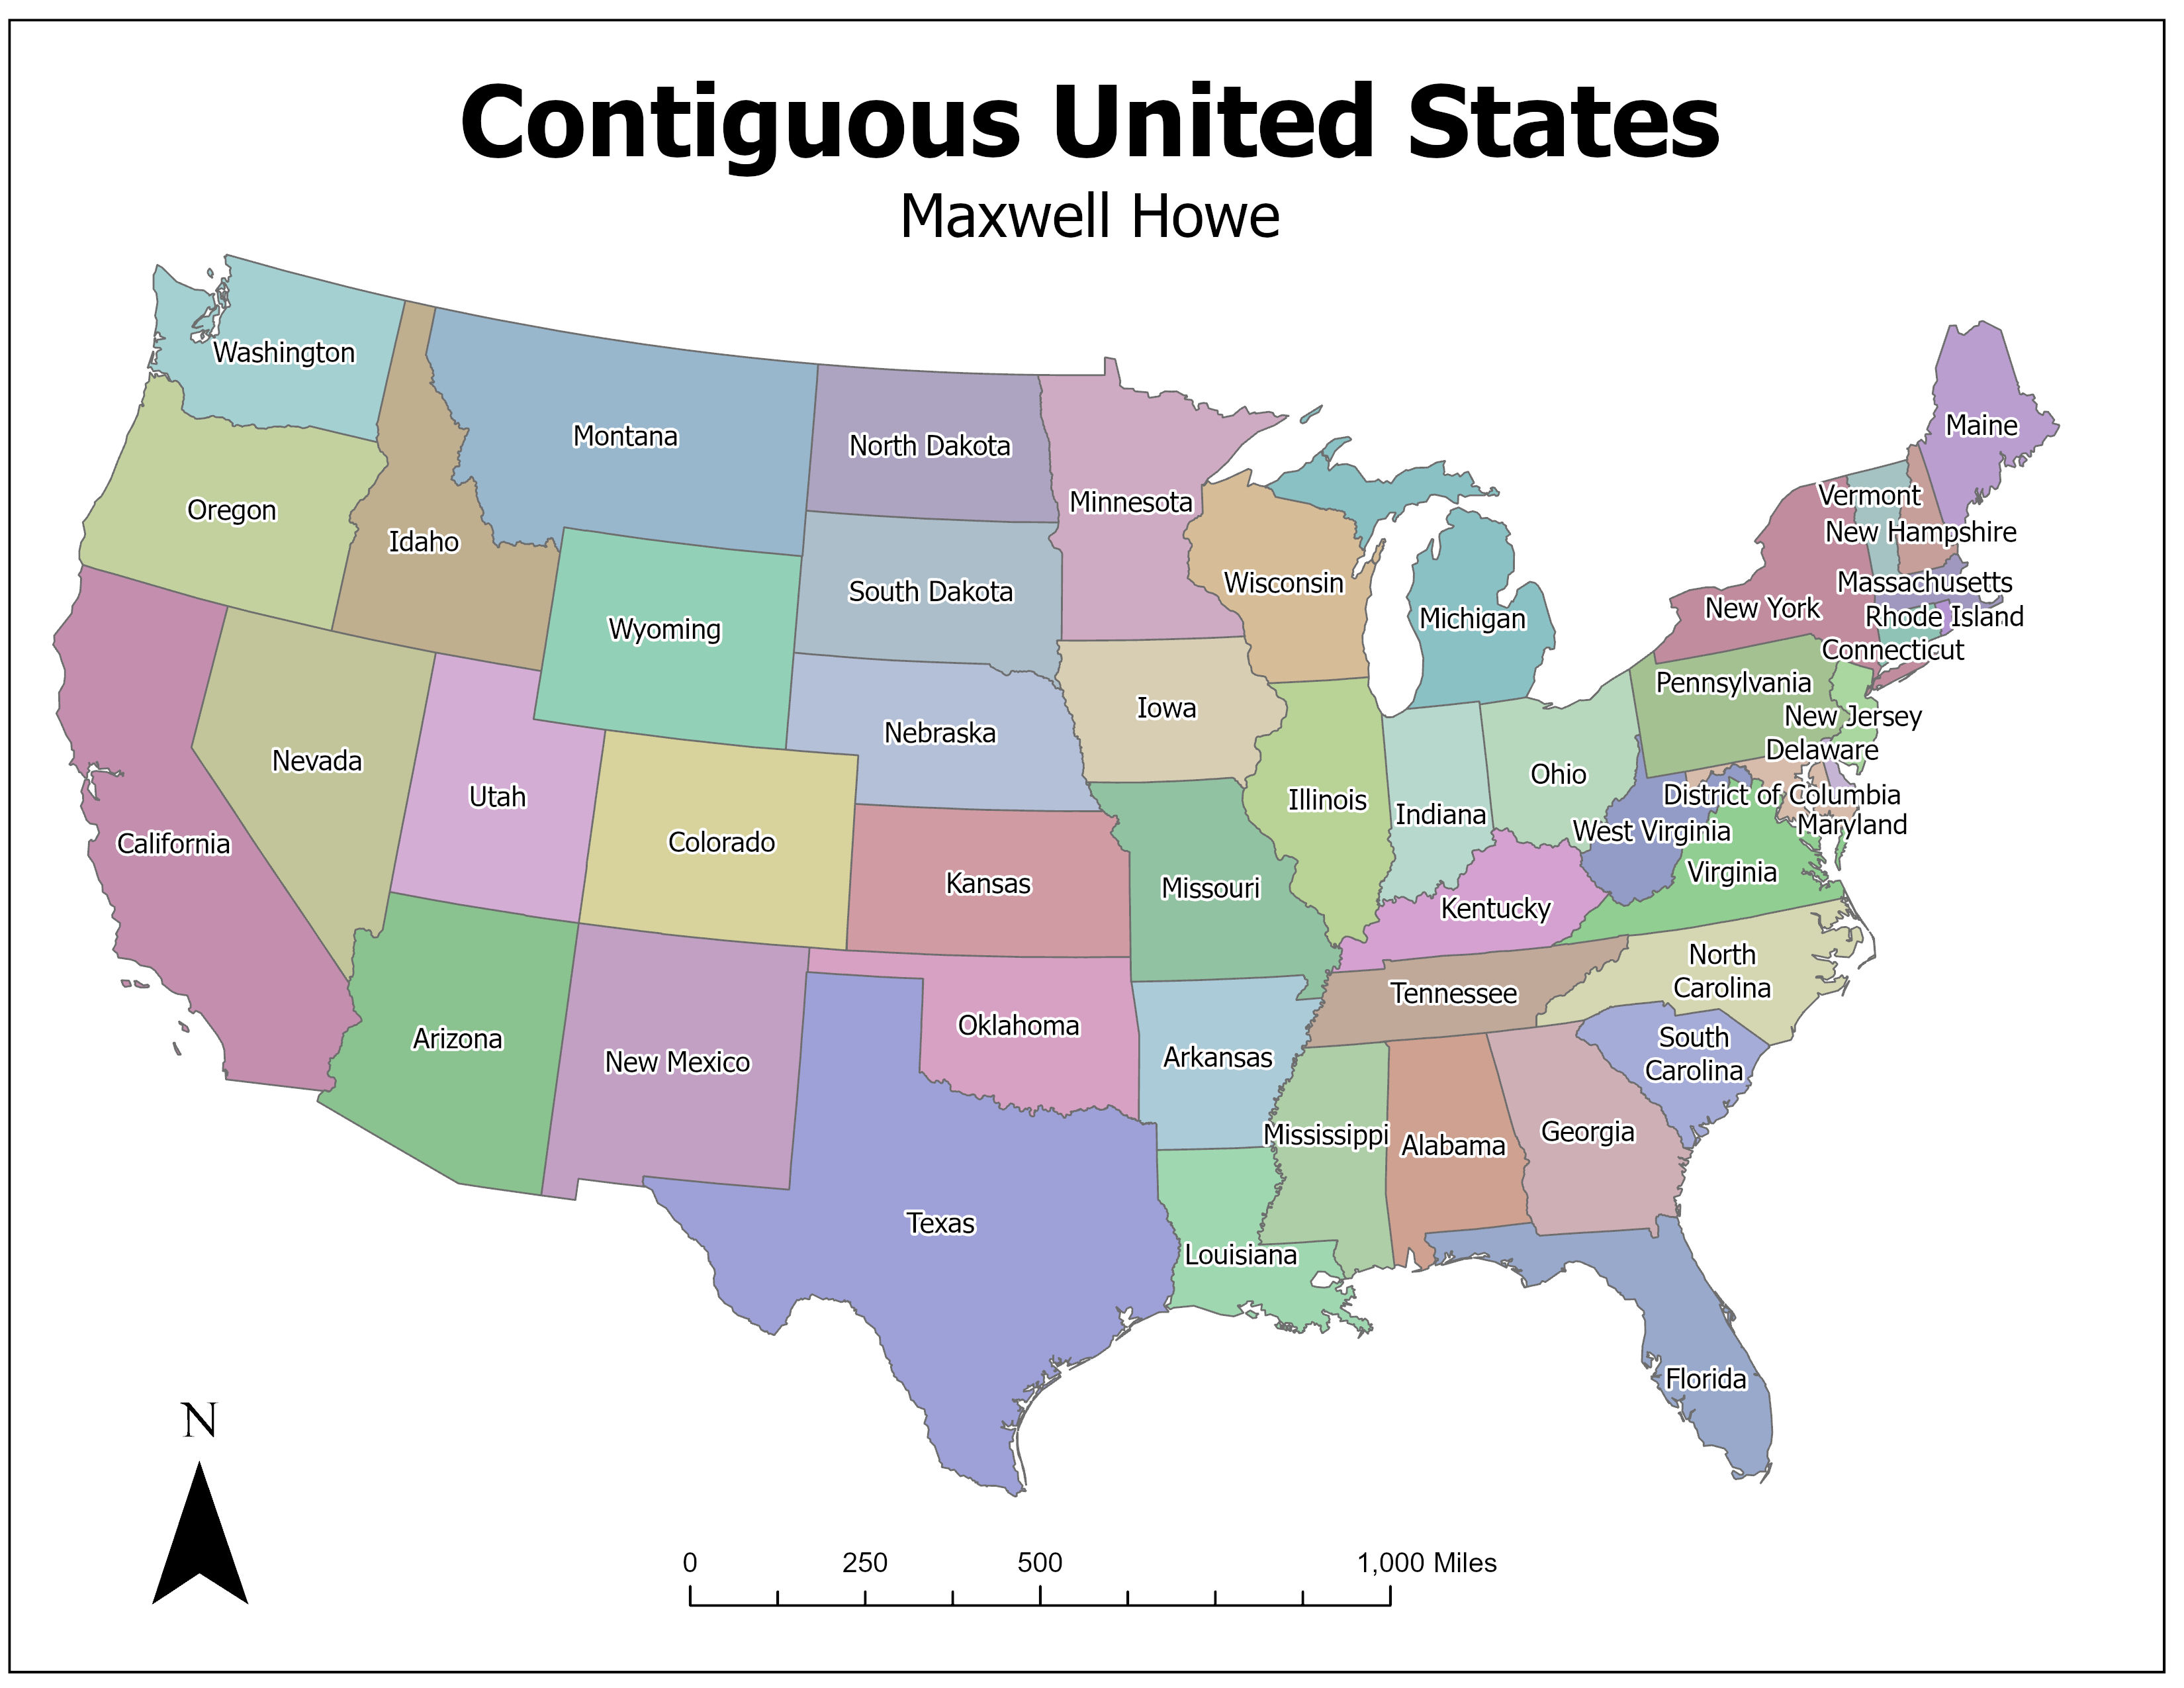
US States
US States
Early piece — state-level US choropleth with the full cartographic layout.
ArcGIS Pro
Choropleth
GPH946
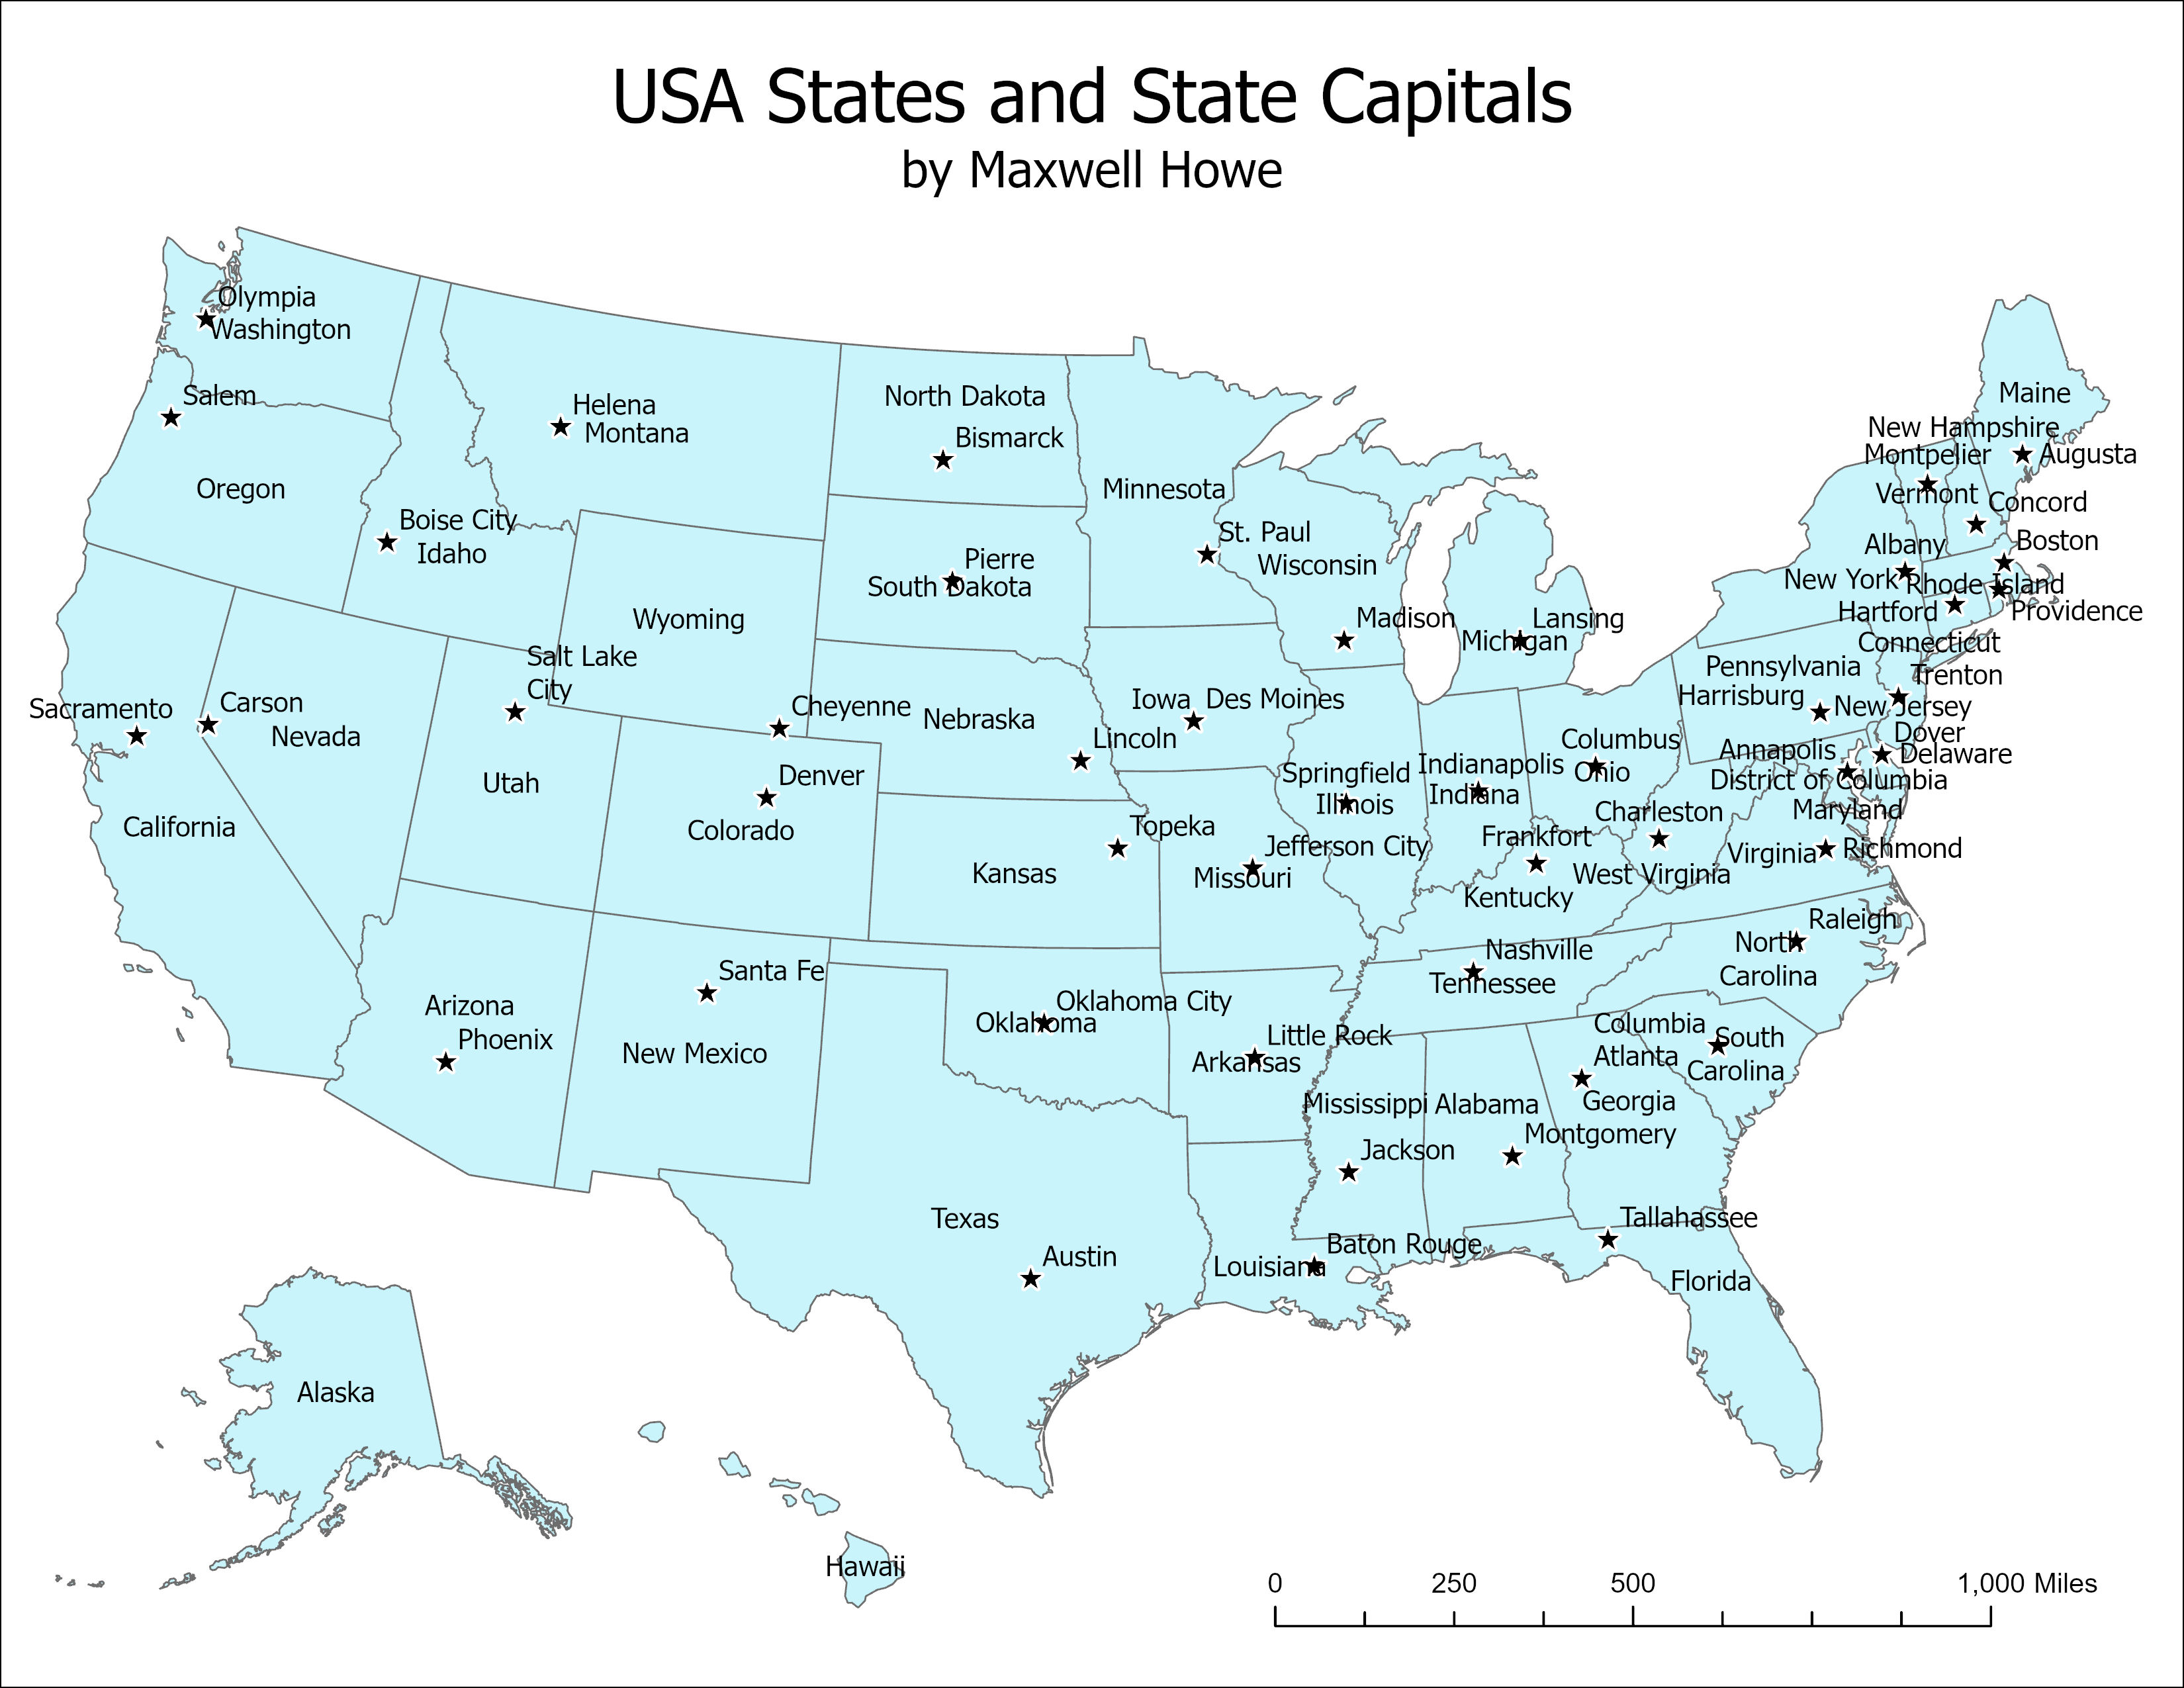
US States & Capitals
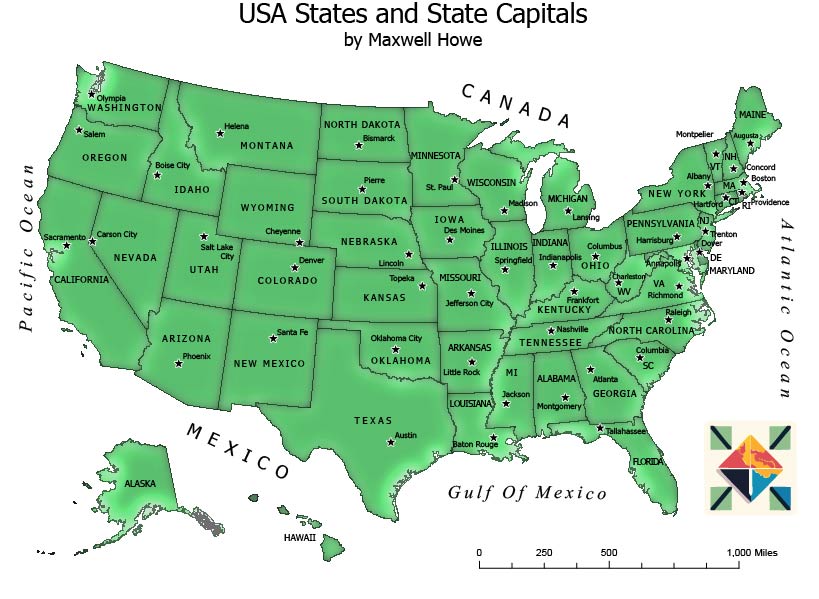
US States & Capitals
Early piece — US capitals reference map. Layout, type hierarchy, capital placement.
ArcGIS Pro
Reference Map
GPH946
US States & Capitals — Illustrator
US States & Capitals — Illustrator Refinement
The ArcGIS Pro reference map, finished by hand in Adobe Illustrator: relief shading, labeled oceans and neighbors, refined type, and a custom compass mark.
Adobe Illustrator
Cartographic Design
GPH946
Edwards Aquifer — Barton Springs
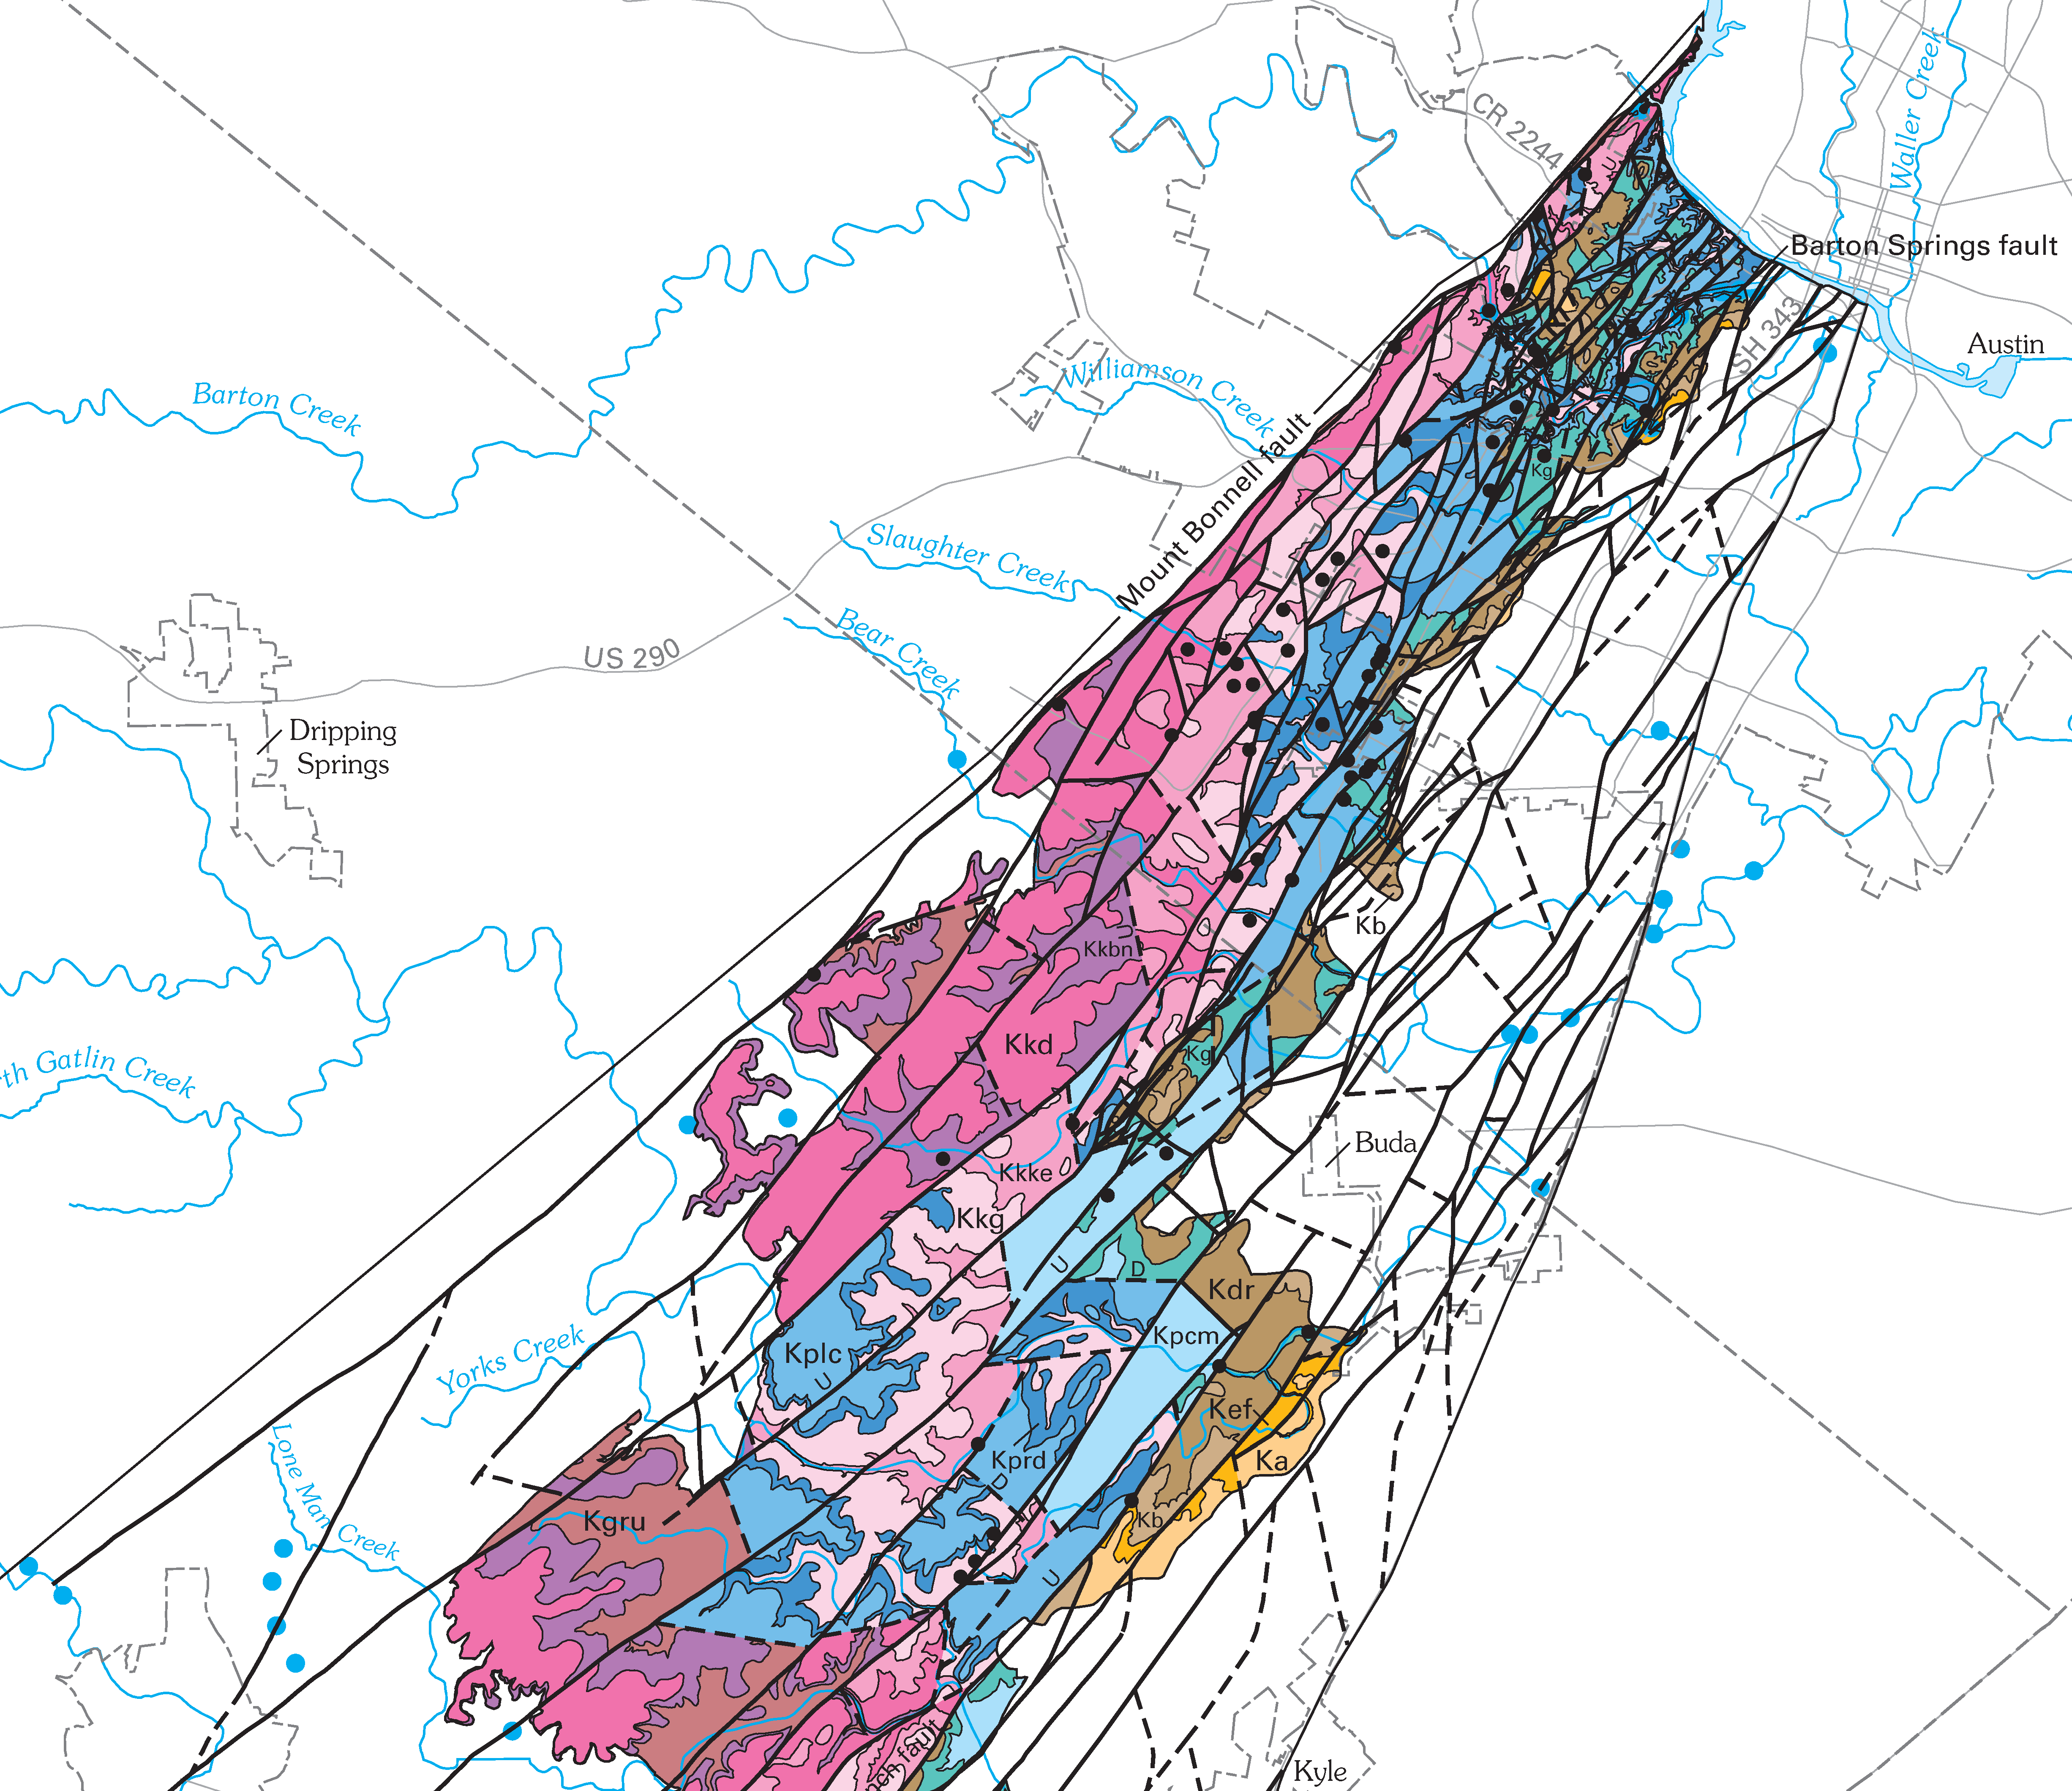
Edwards Aquifer — Barton Springs Segment
Faulted Cretaceous limestone units and recharge features of the Barton Springs segment, southwest of Austin, TX. GPH903 study area.
Geologic Mapping
Hydrogeology
GPH903
MA EV Charger Locations
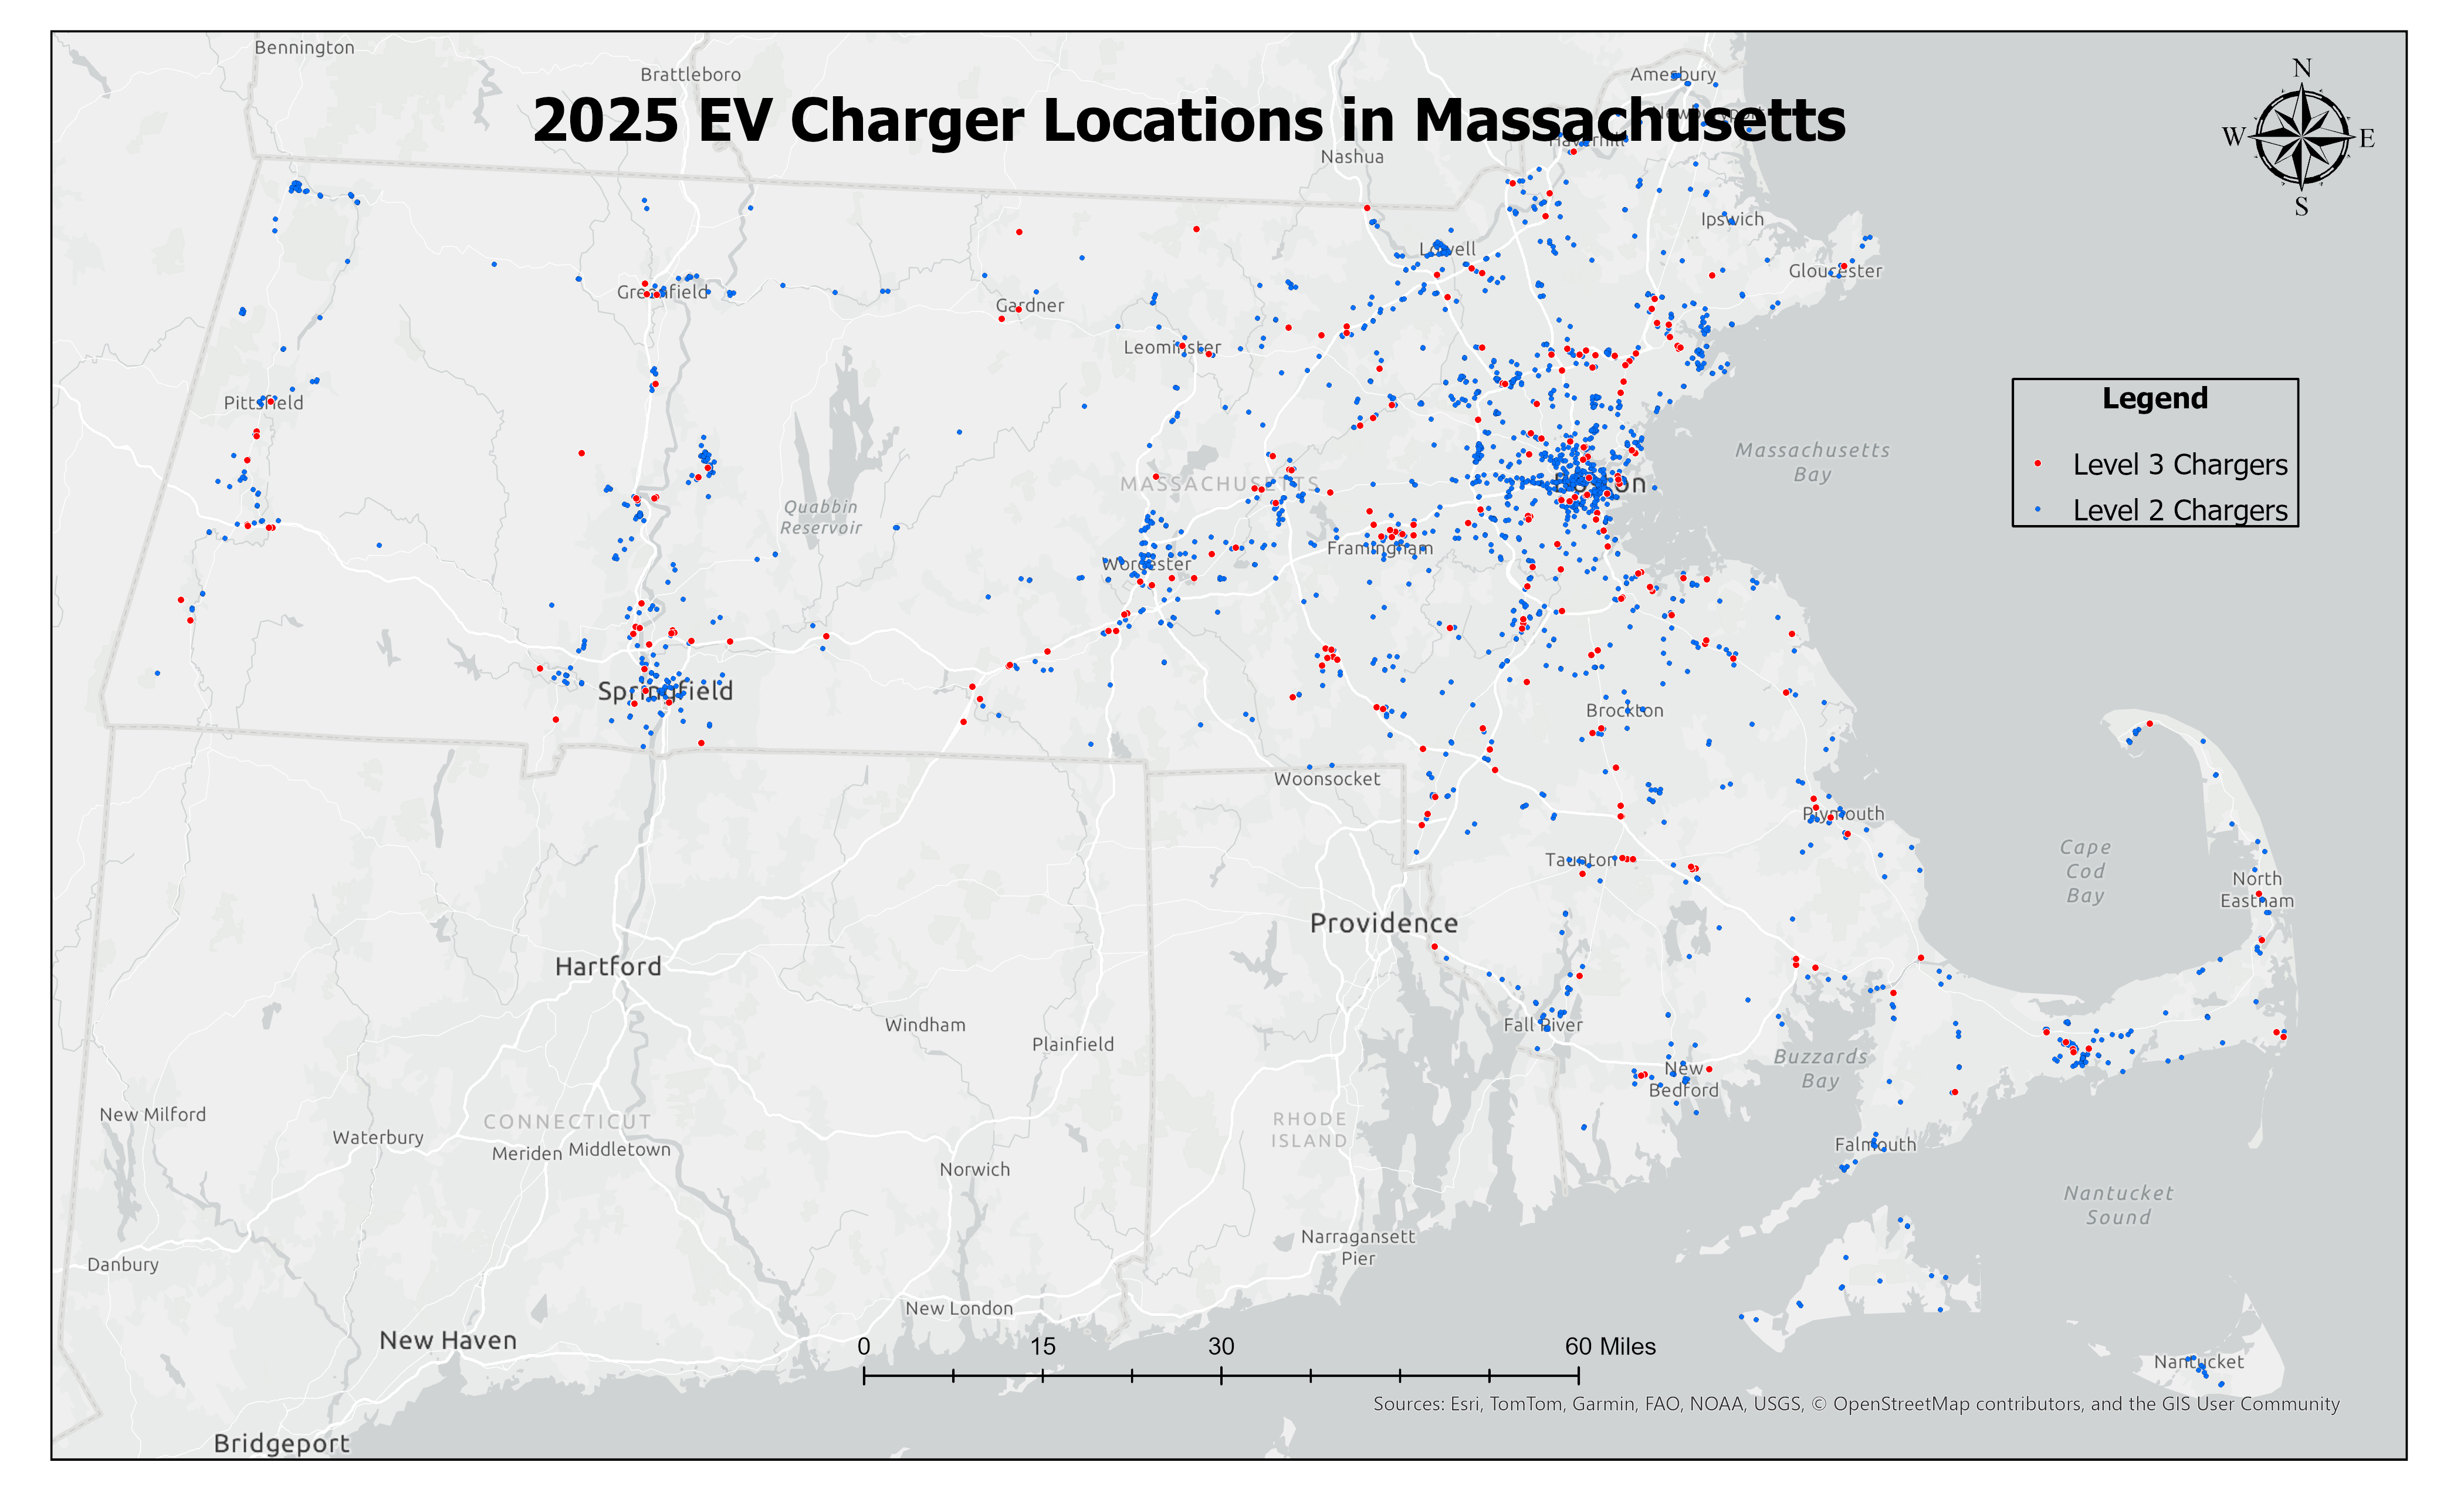
Massachusetts EV Charger Locations
Current station distribution used as baseline for GIS-AHP optimal siting research. GPH904.
ArcGIS Pro
EV Infrastructure
GPH904
RI Extreme Heat Prediction
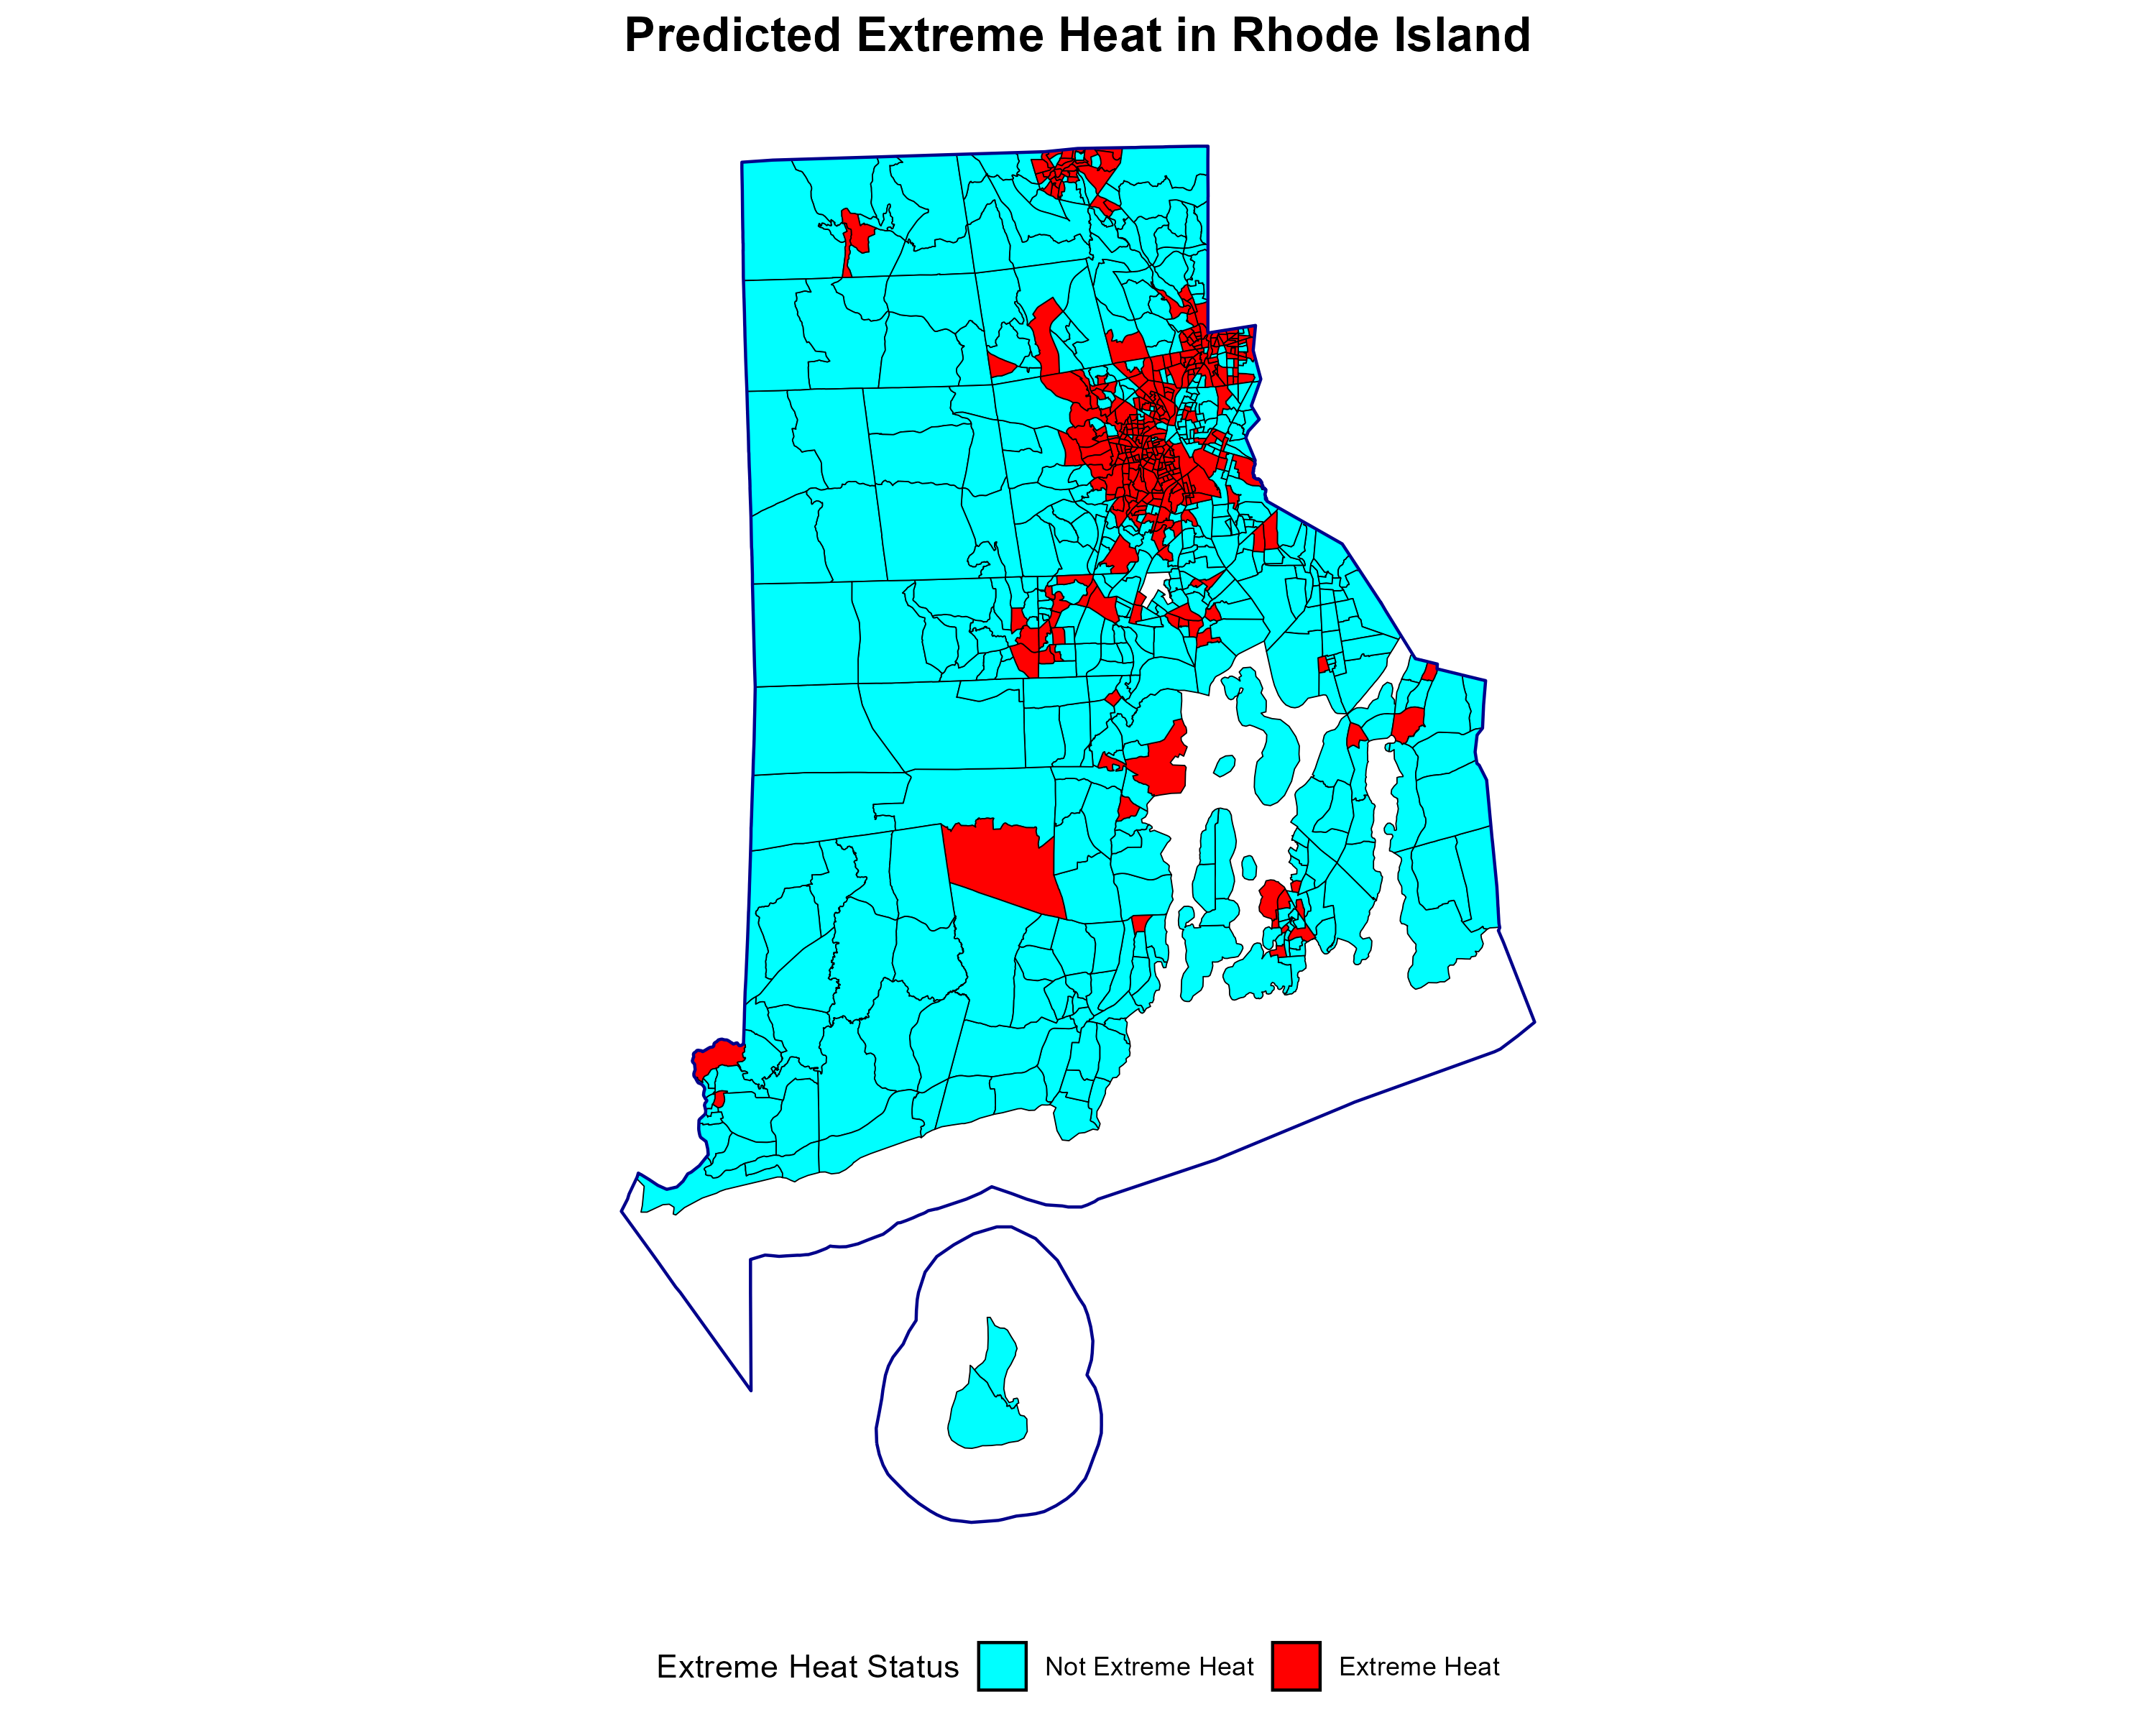
Predicted Extreme Heat — Rhode Island
Random forest model predicting extreme heat risk statewide. R-based machine learning applied to spatial climate data.
R
Random Forest
GPH942
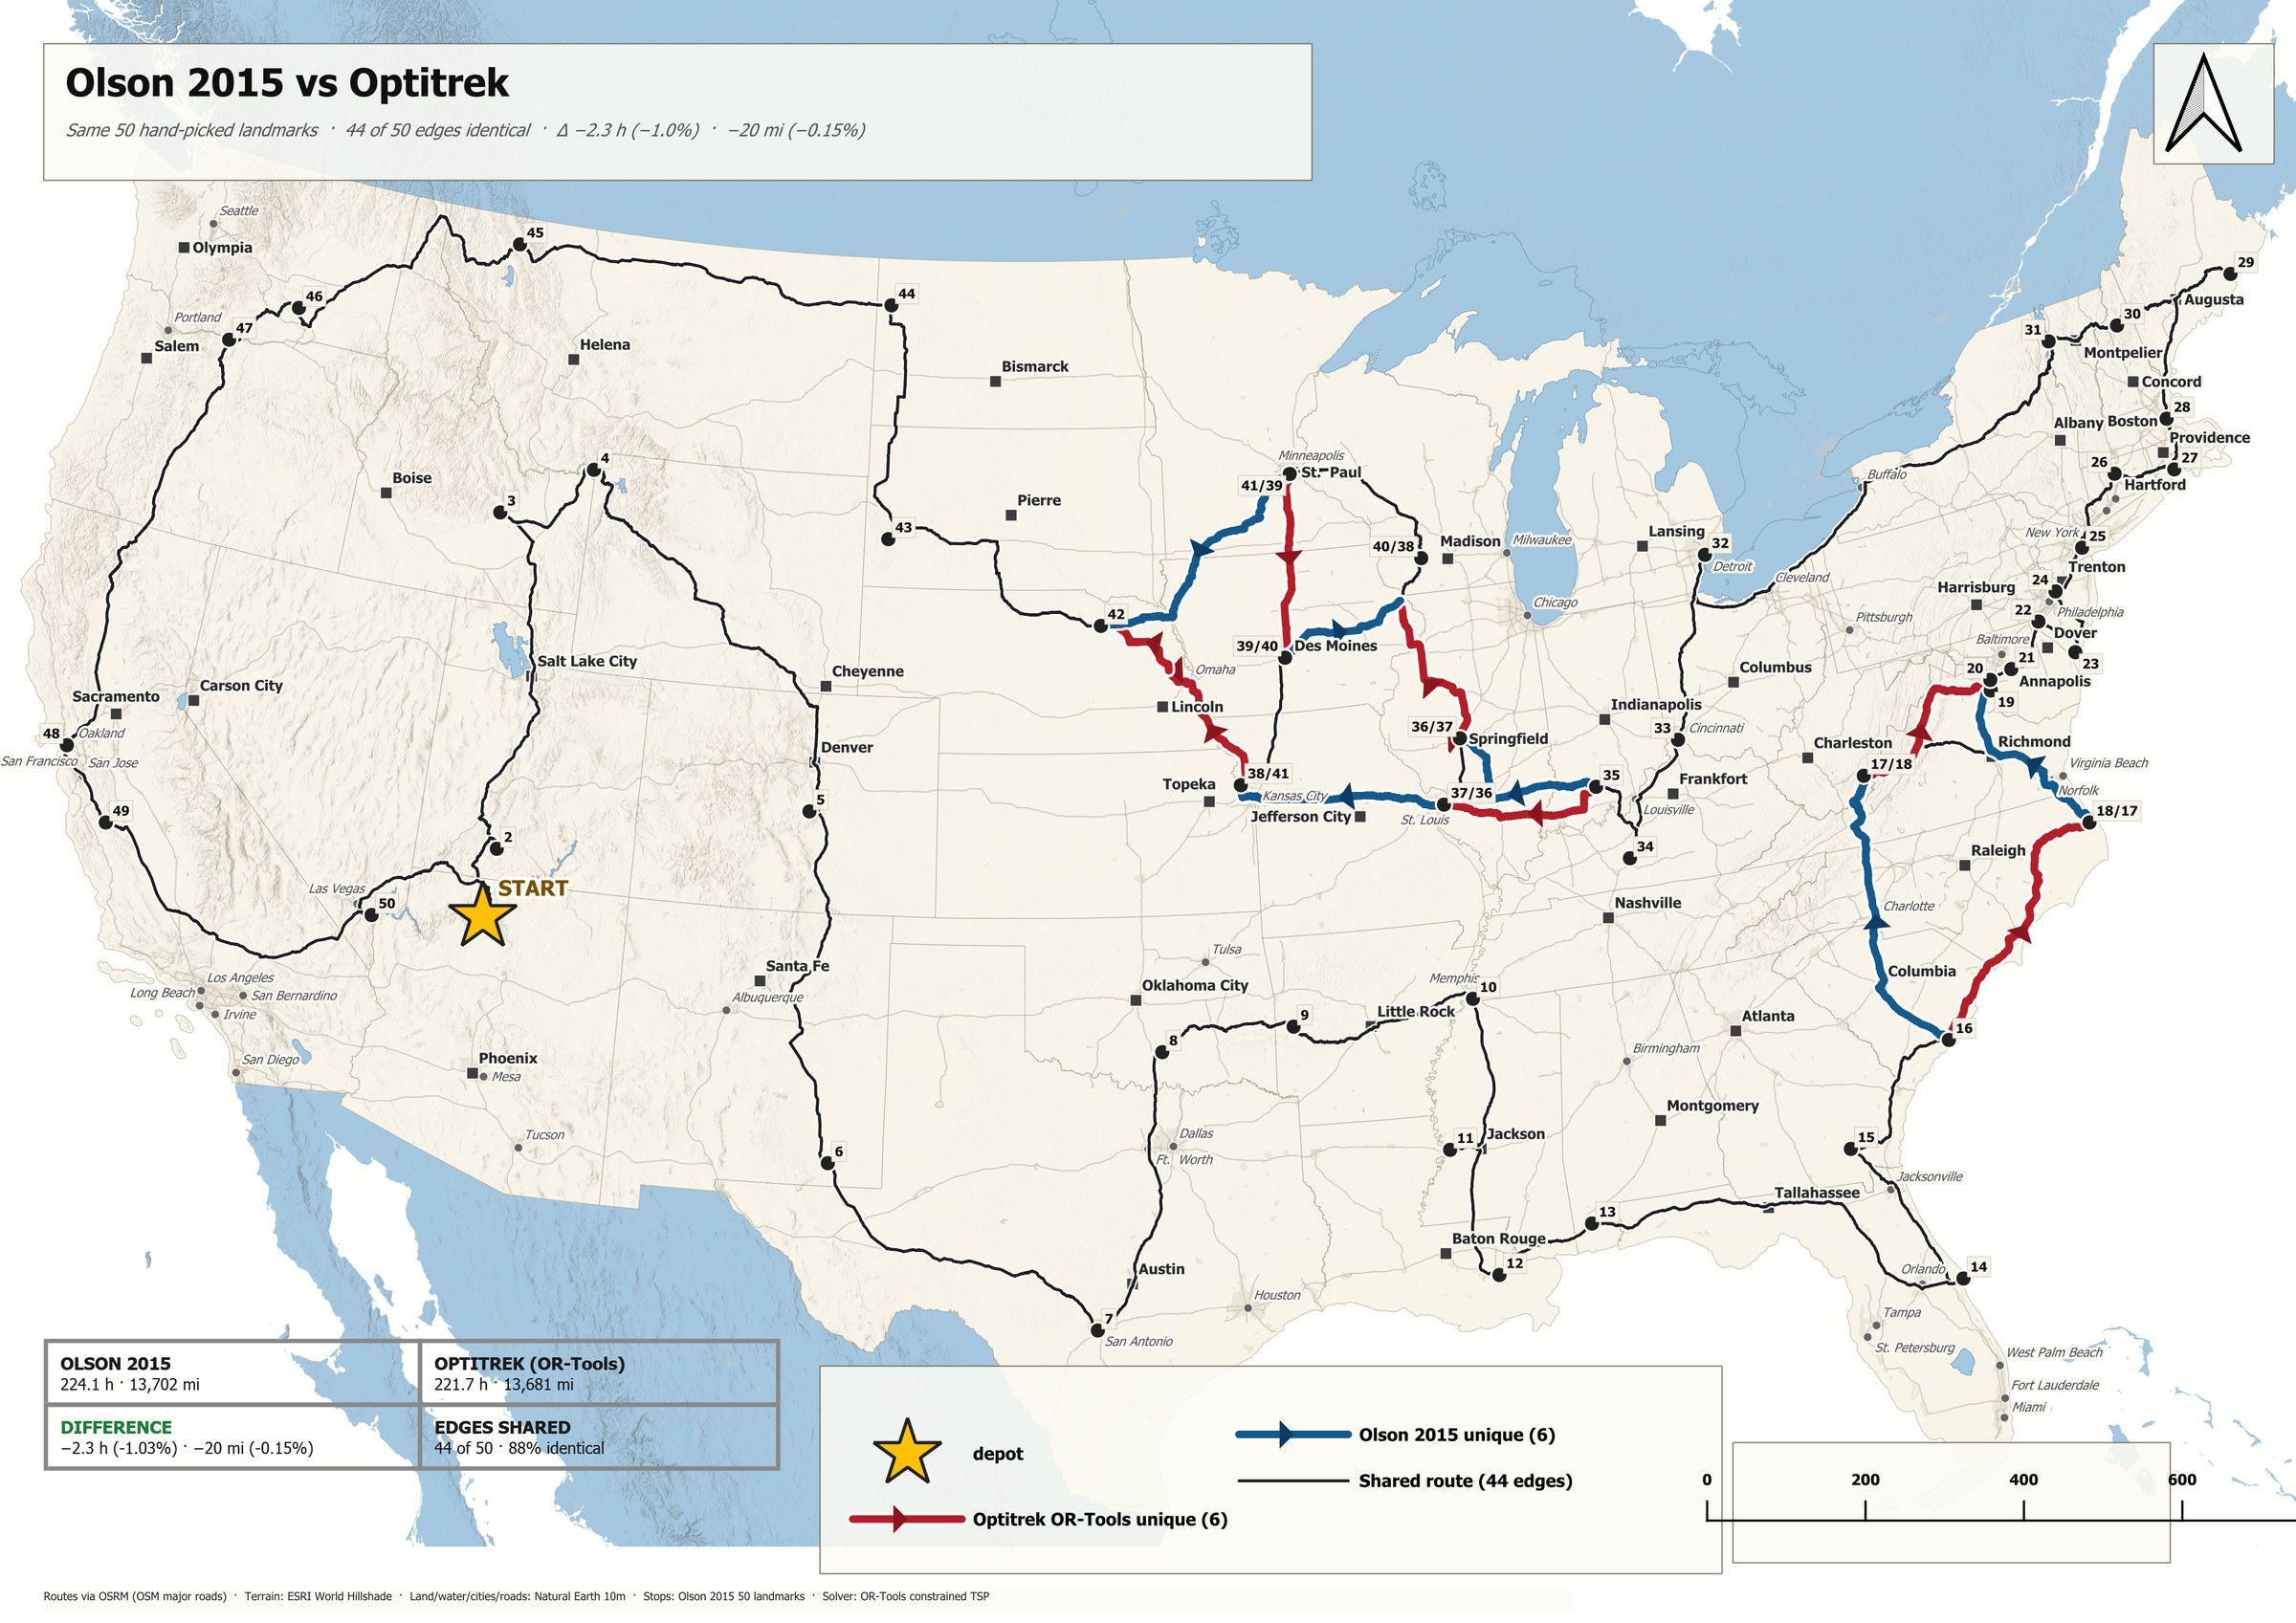
Optitrek: Olson vs OR-Tools
Optitrek: Olson 2015 vs OR-Tools 2026
Same 50 landmarks, same distance matrix, two different optimizers — OR-Tools’ VRP shaved 2.32 hours off Olson’s genetic-algorithm tour.
Optitrek
OR-Tools
Python
Research
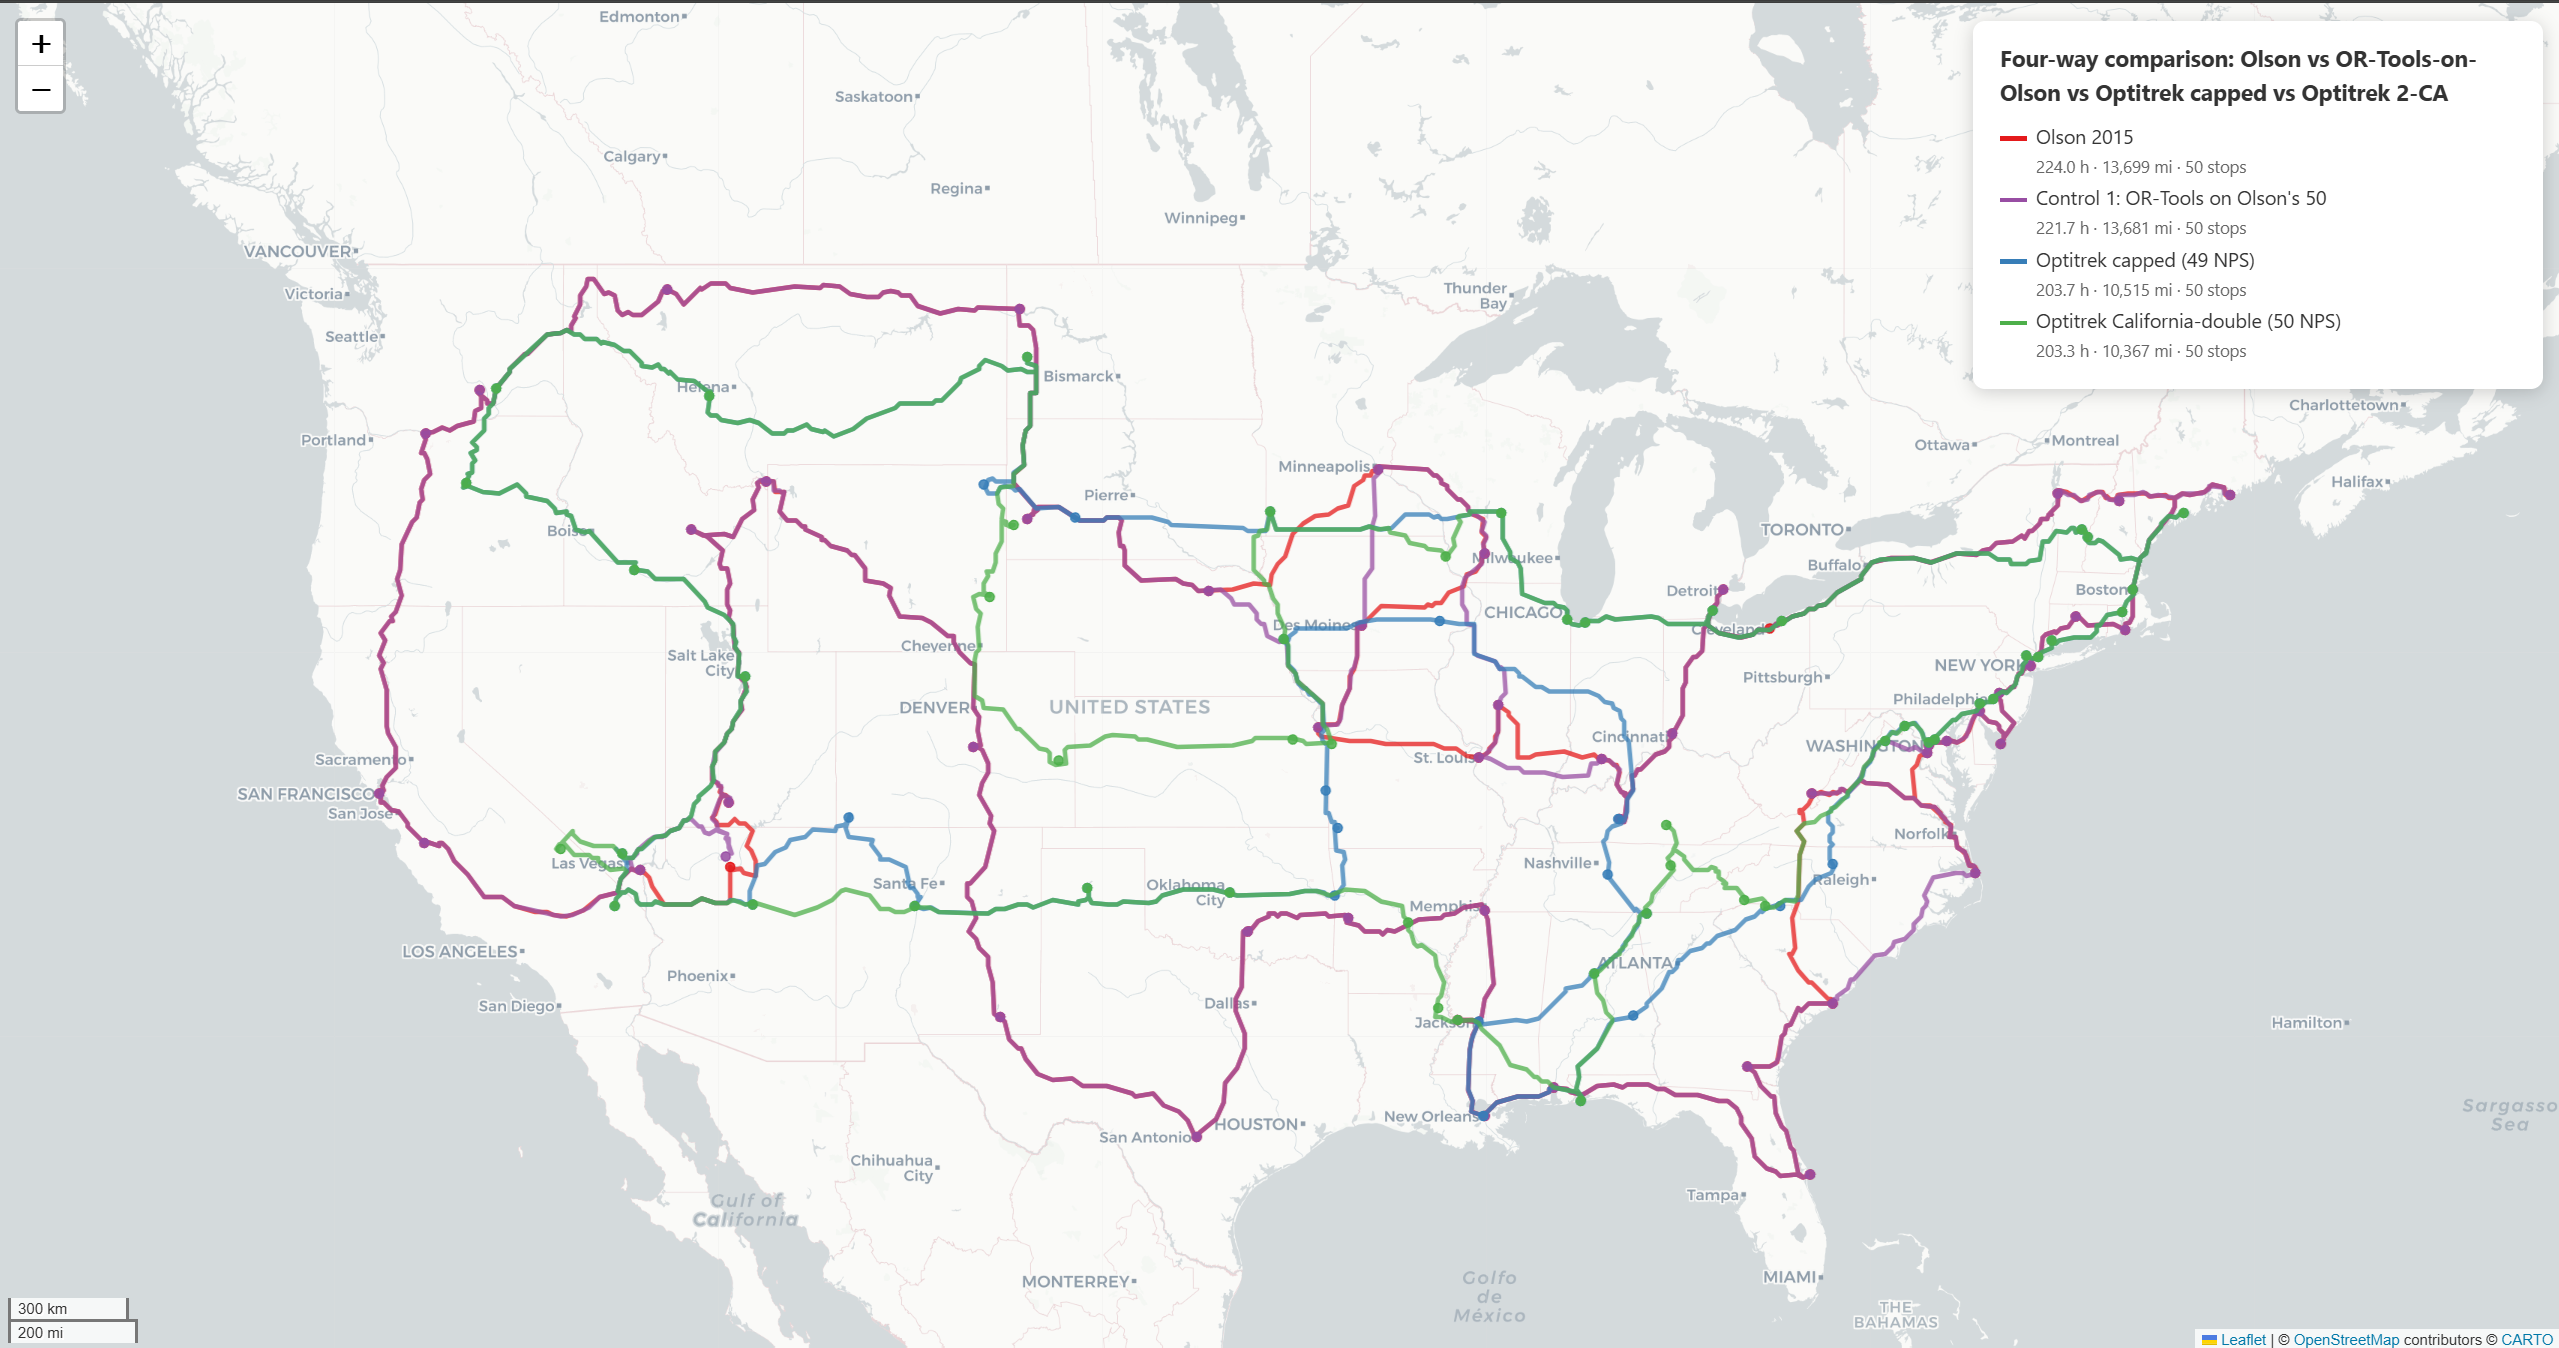
Optitrek: Four-Way Overlay
Optitrek: Four-Way Route Overlay
Four solver/router combinations plotted on the same 50 stops — divergence shows where they disagree.
Optitrek
Folium
Routing
Comparison
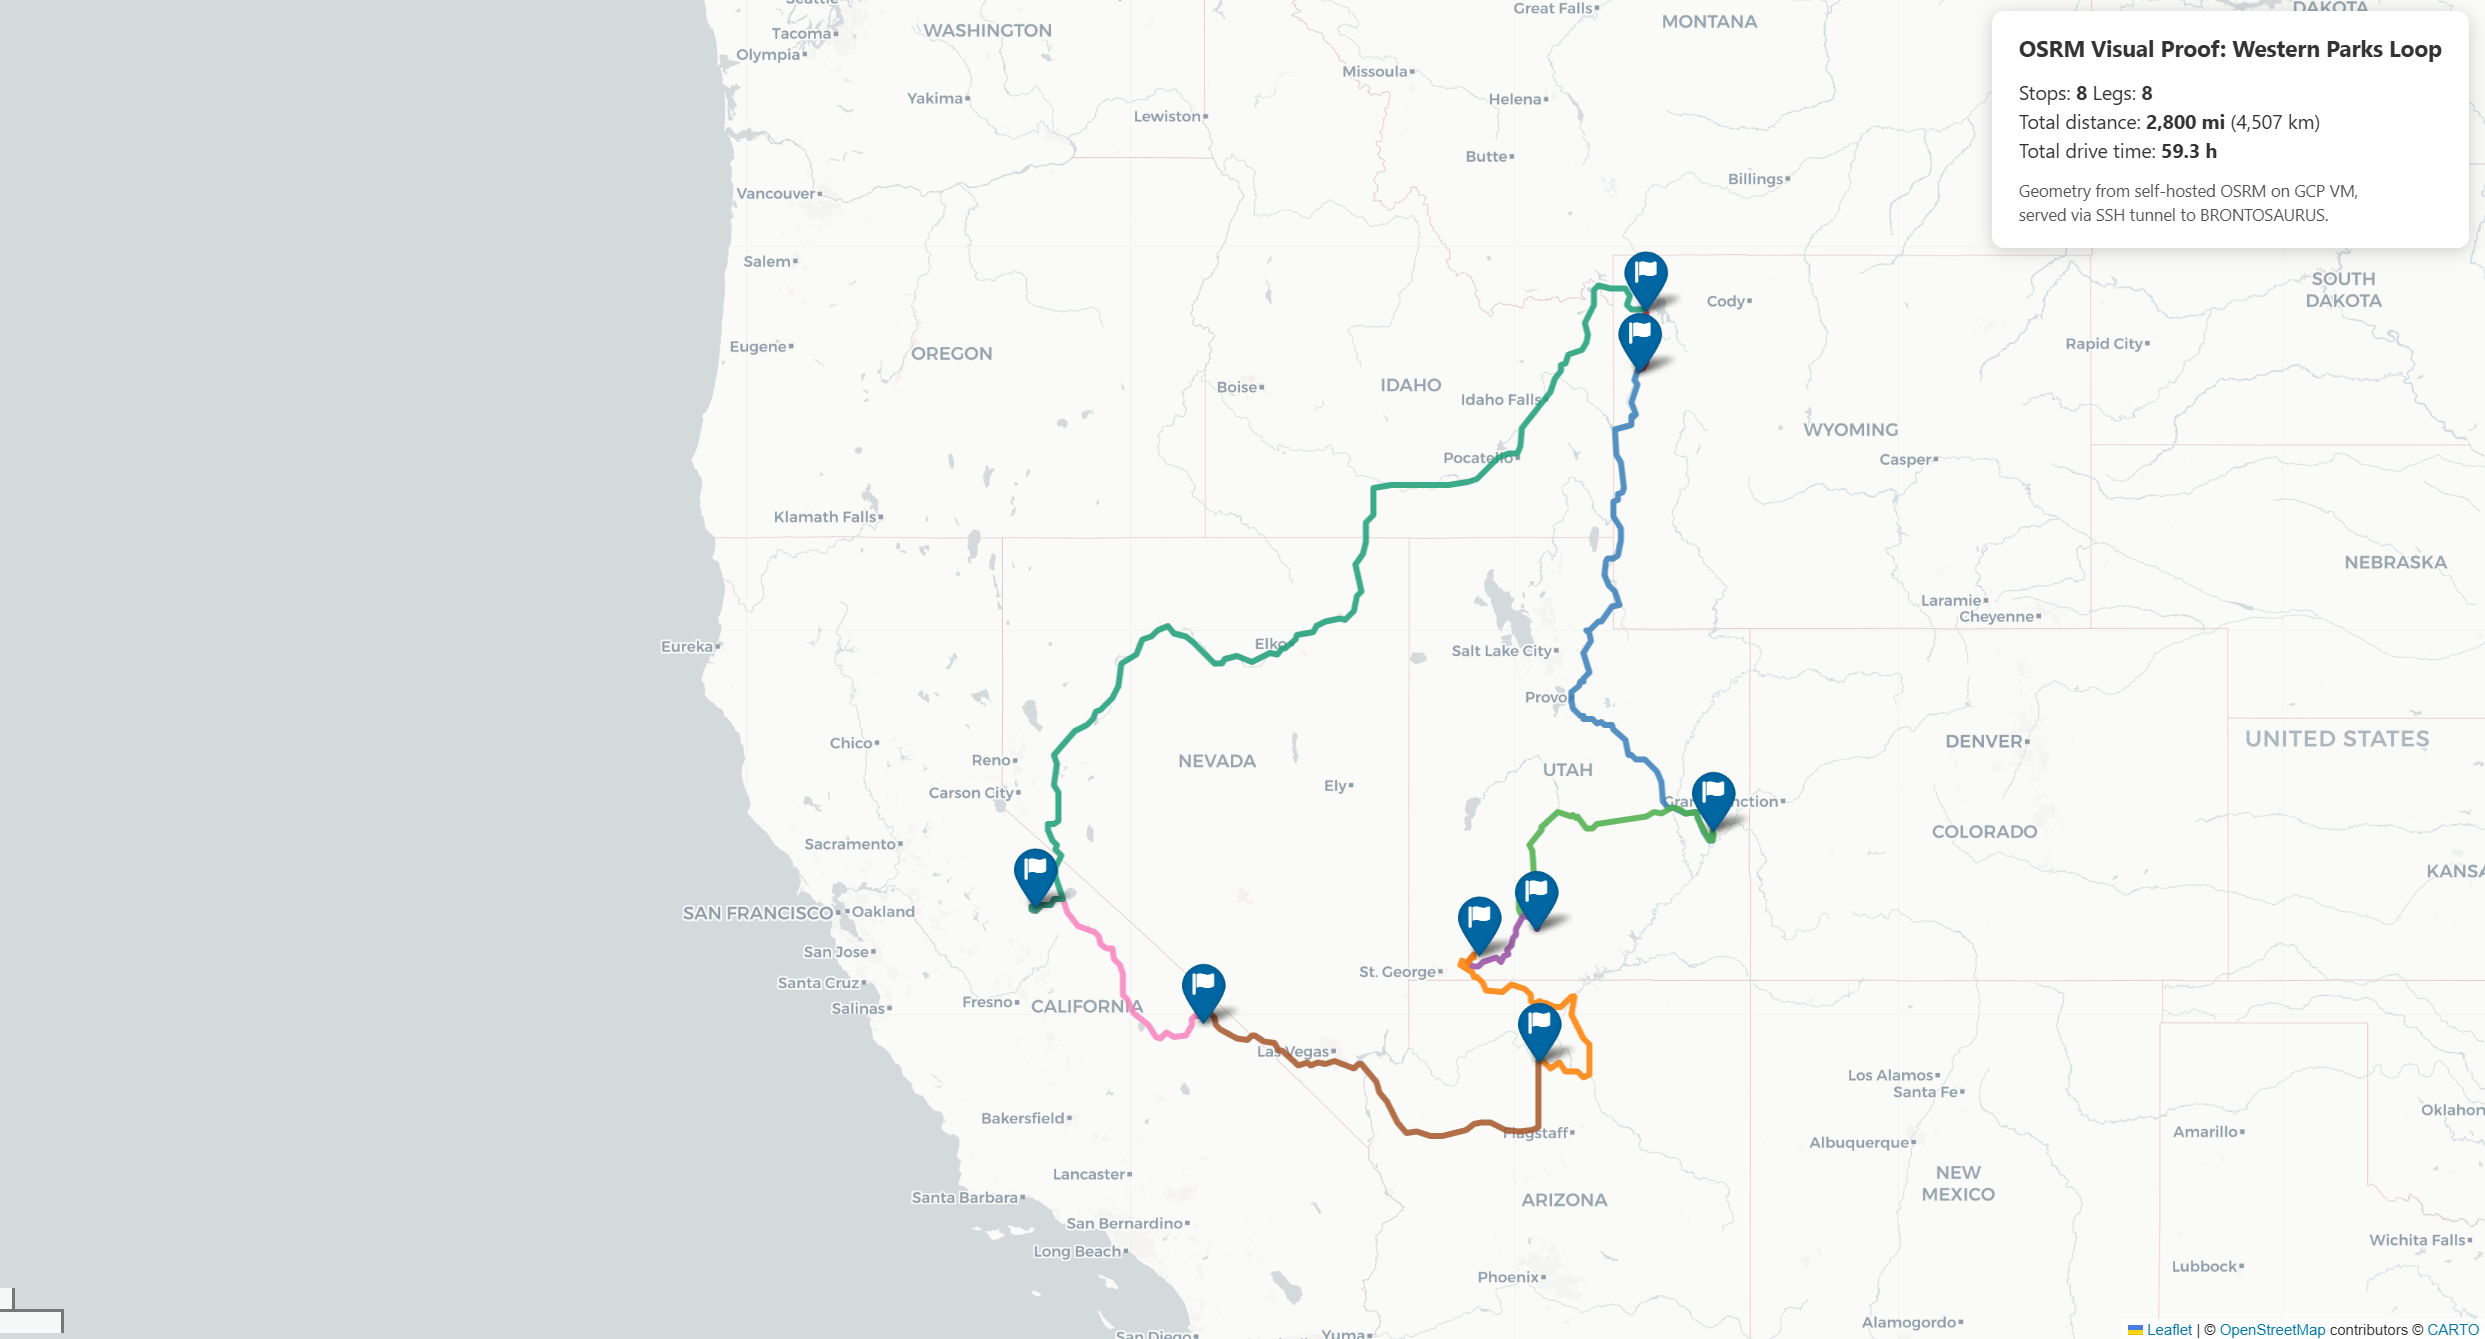
Optitrek: OSRM Proof
Optitrek: OSRM Western Parks Proof
8-stop western parks loop routed on self-hosted OSRM — 2,800 mi / 59.3 hours. Pipeline validation.
Optitrek
OSRM
Self-Hosted
Routing
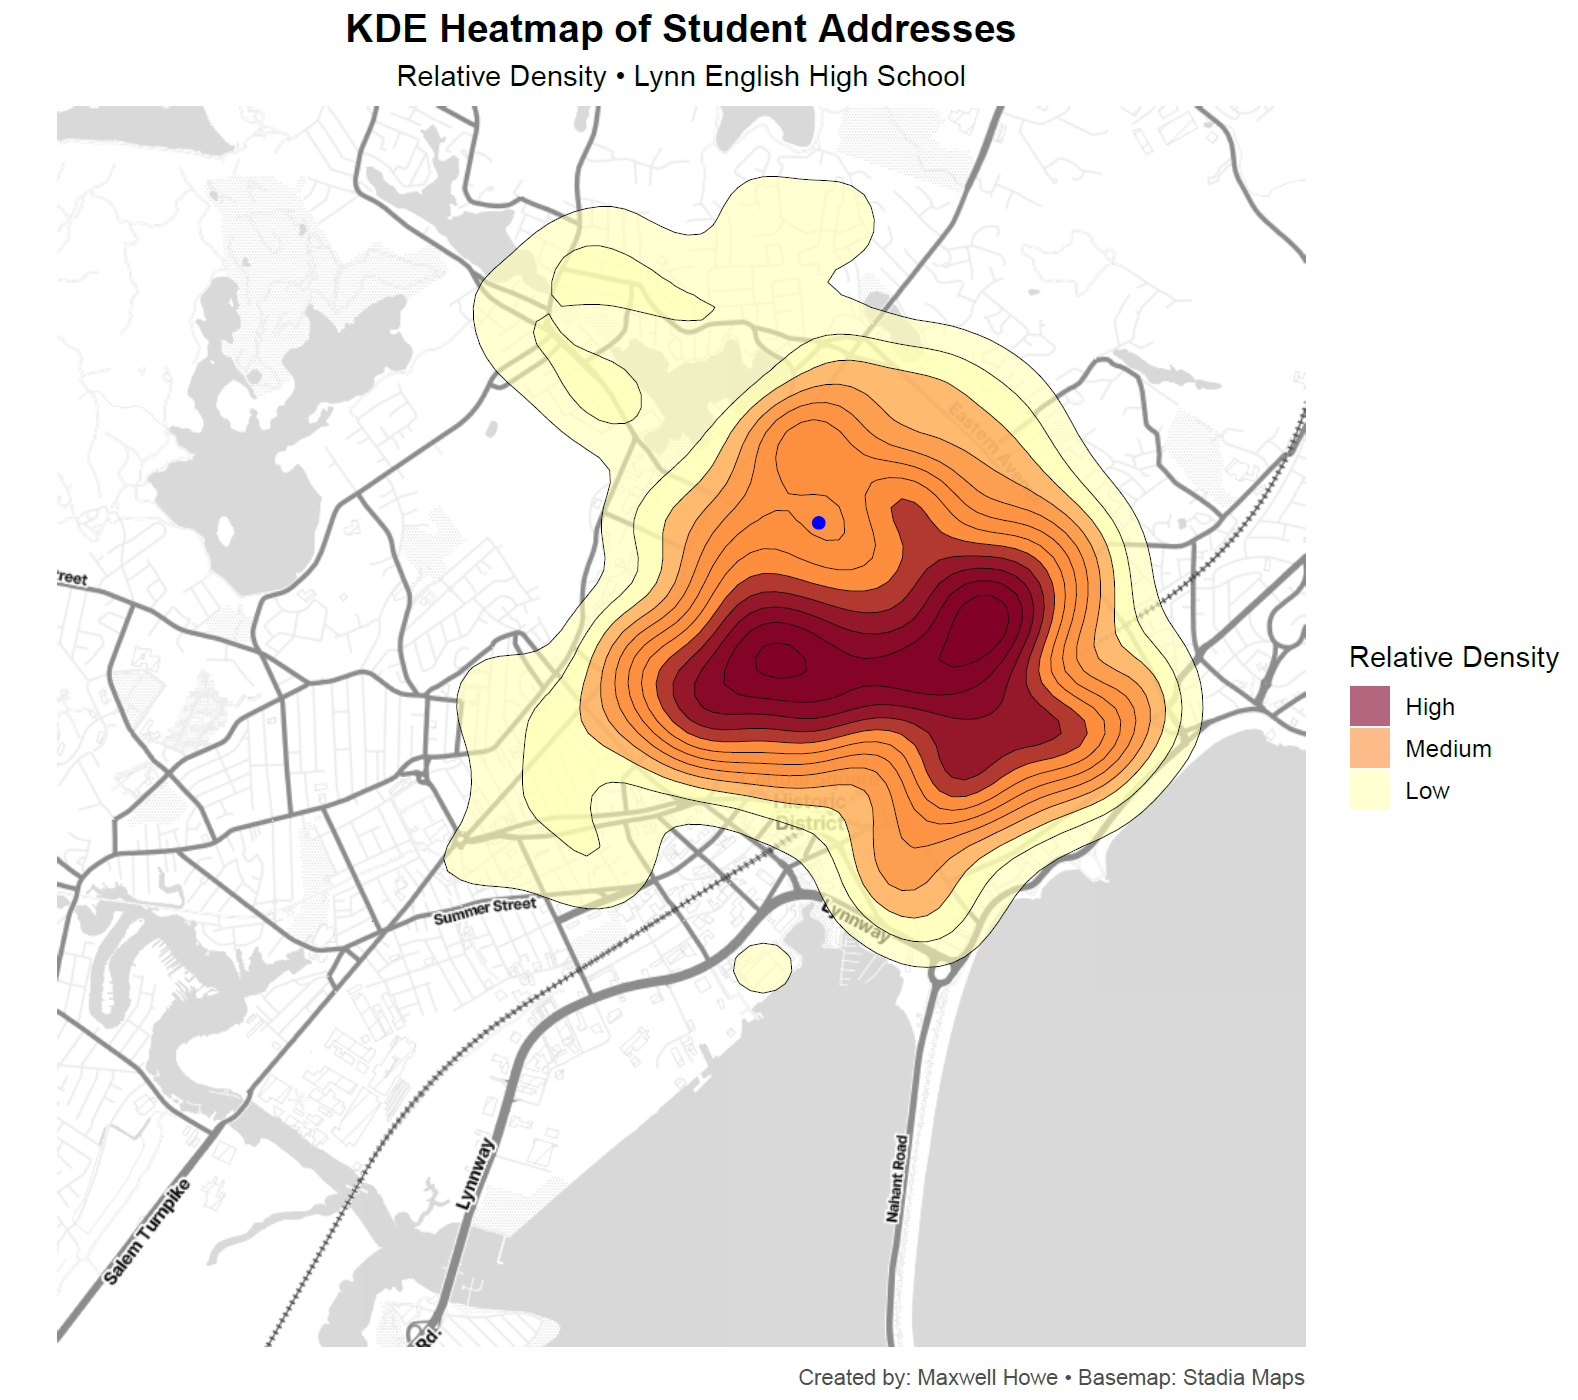
Lynn: KDE Heatmap
KDE Heatmap of Student Addresses
Kernel density of geocoded student home addresses around LEHS — built in R + ggplot2 + Stadia basemap.
R
ggplot2
KDE
Capstone
View full project →
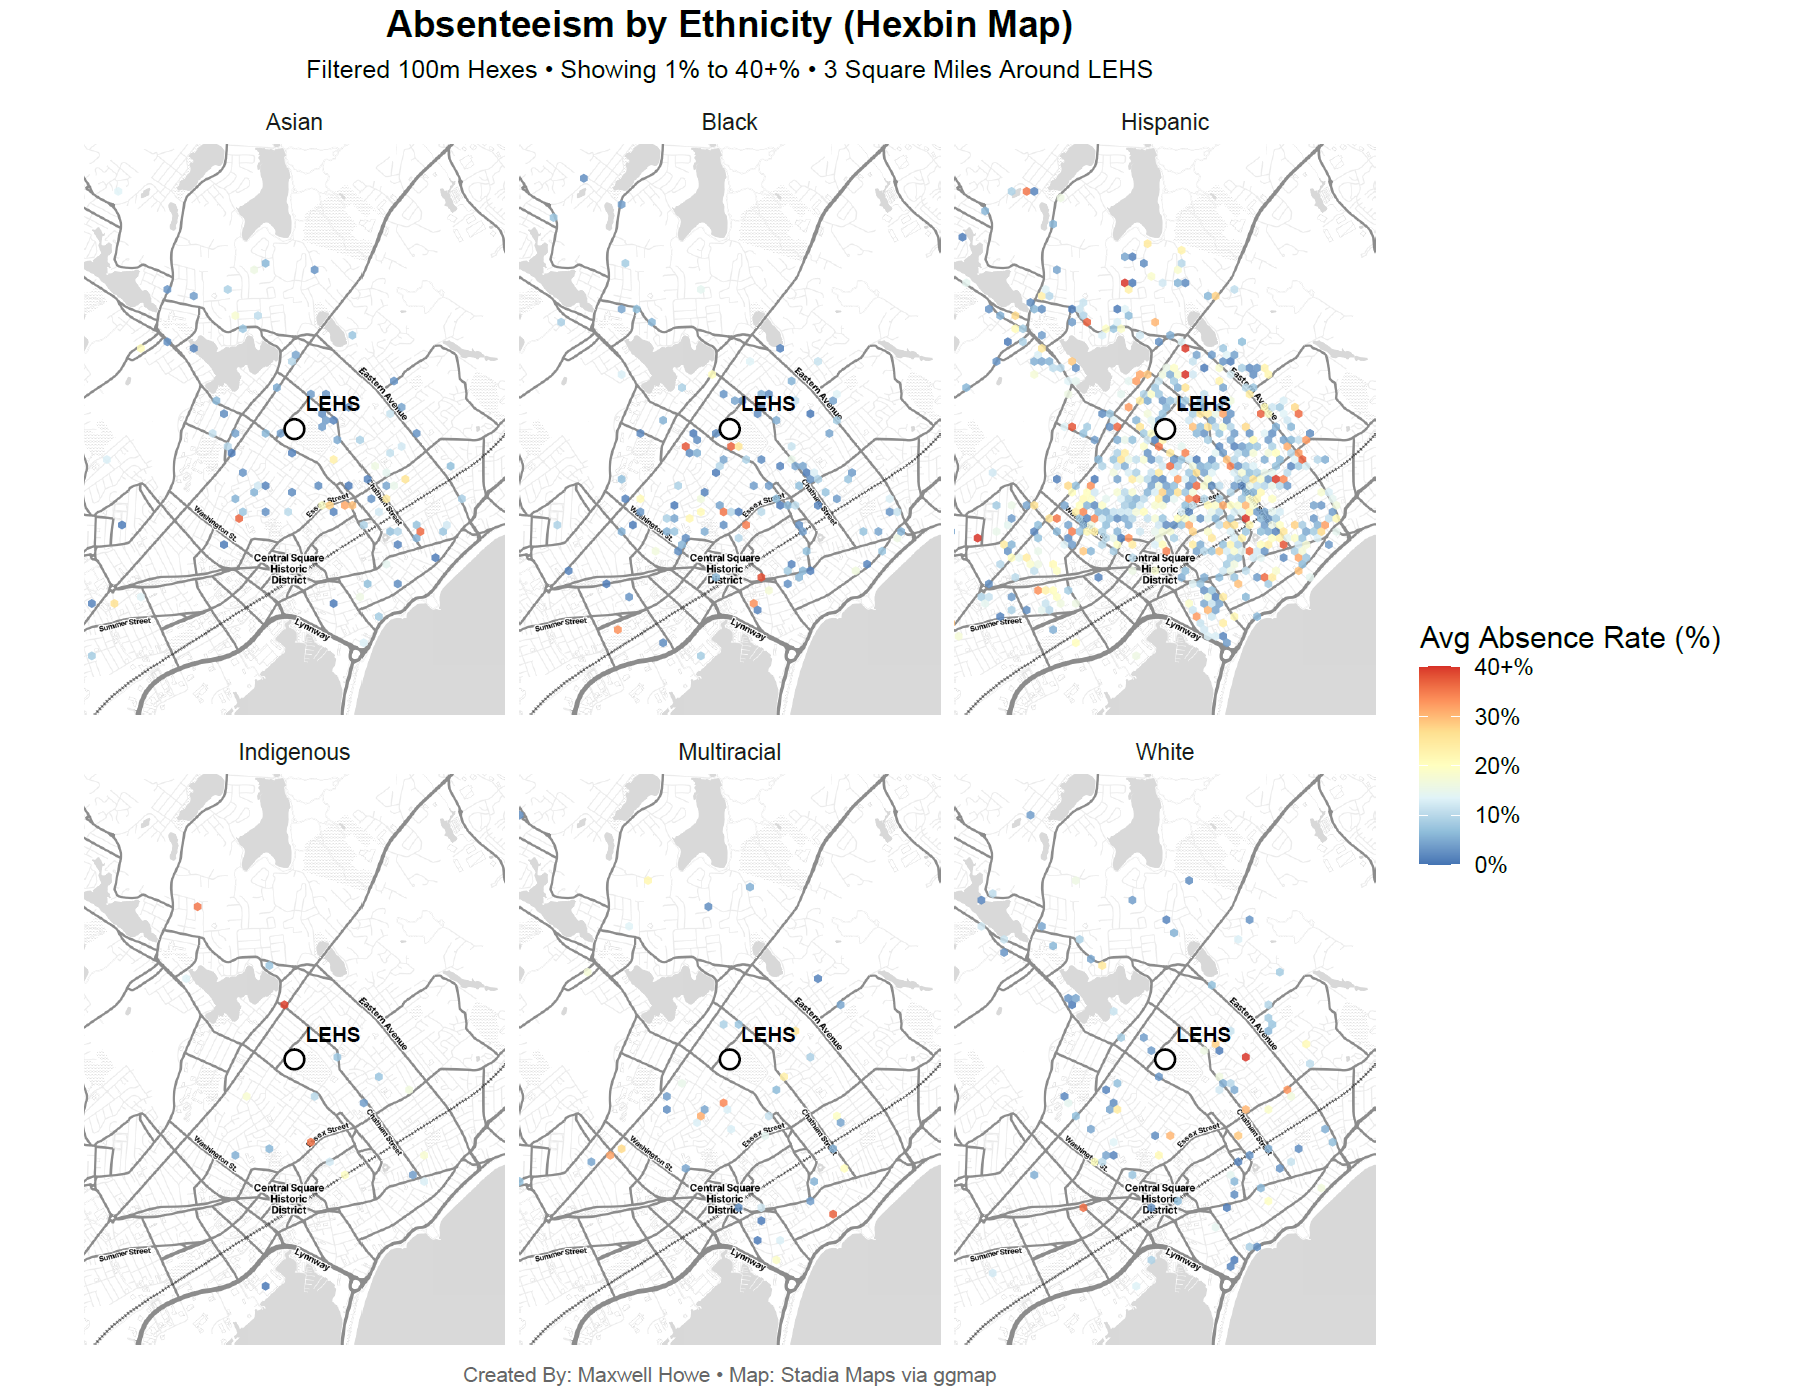
Lynn: Ethnicity Panels
Absenteeism by Ethnicity — Small Multiples
Six-panel small multiples — absenteeism distribution by ethnicity within 3 miles of LEHS.
R
Small Multiples
Equity
Capstone
View full project →
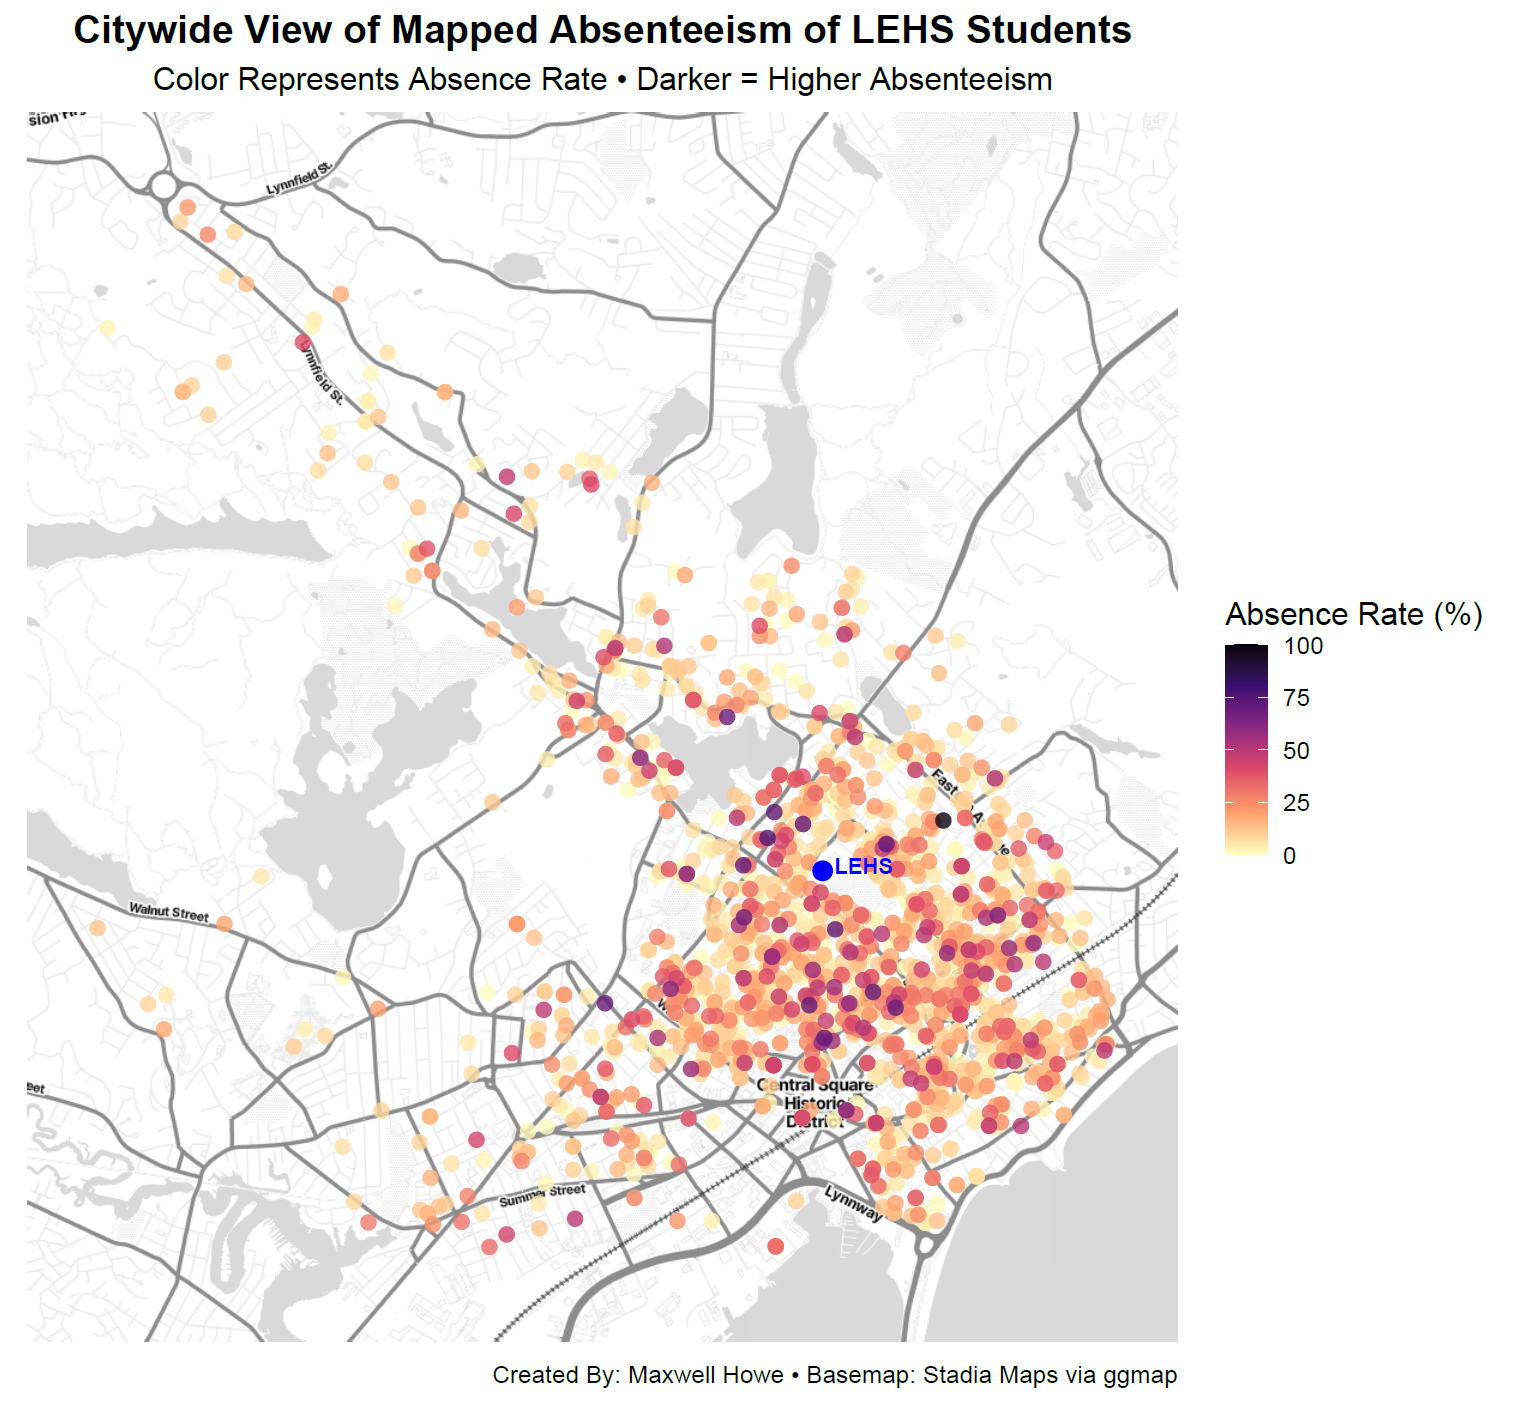
Lynn: Citywide Absenteeism
Citywide Absenteeism — Mapped by Address
Every LEHS student plotted by home address, colored by personal absence rate. Darker = higher absenteeism.
R
Dot Map
Capstone
Lynn
View full project →
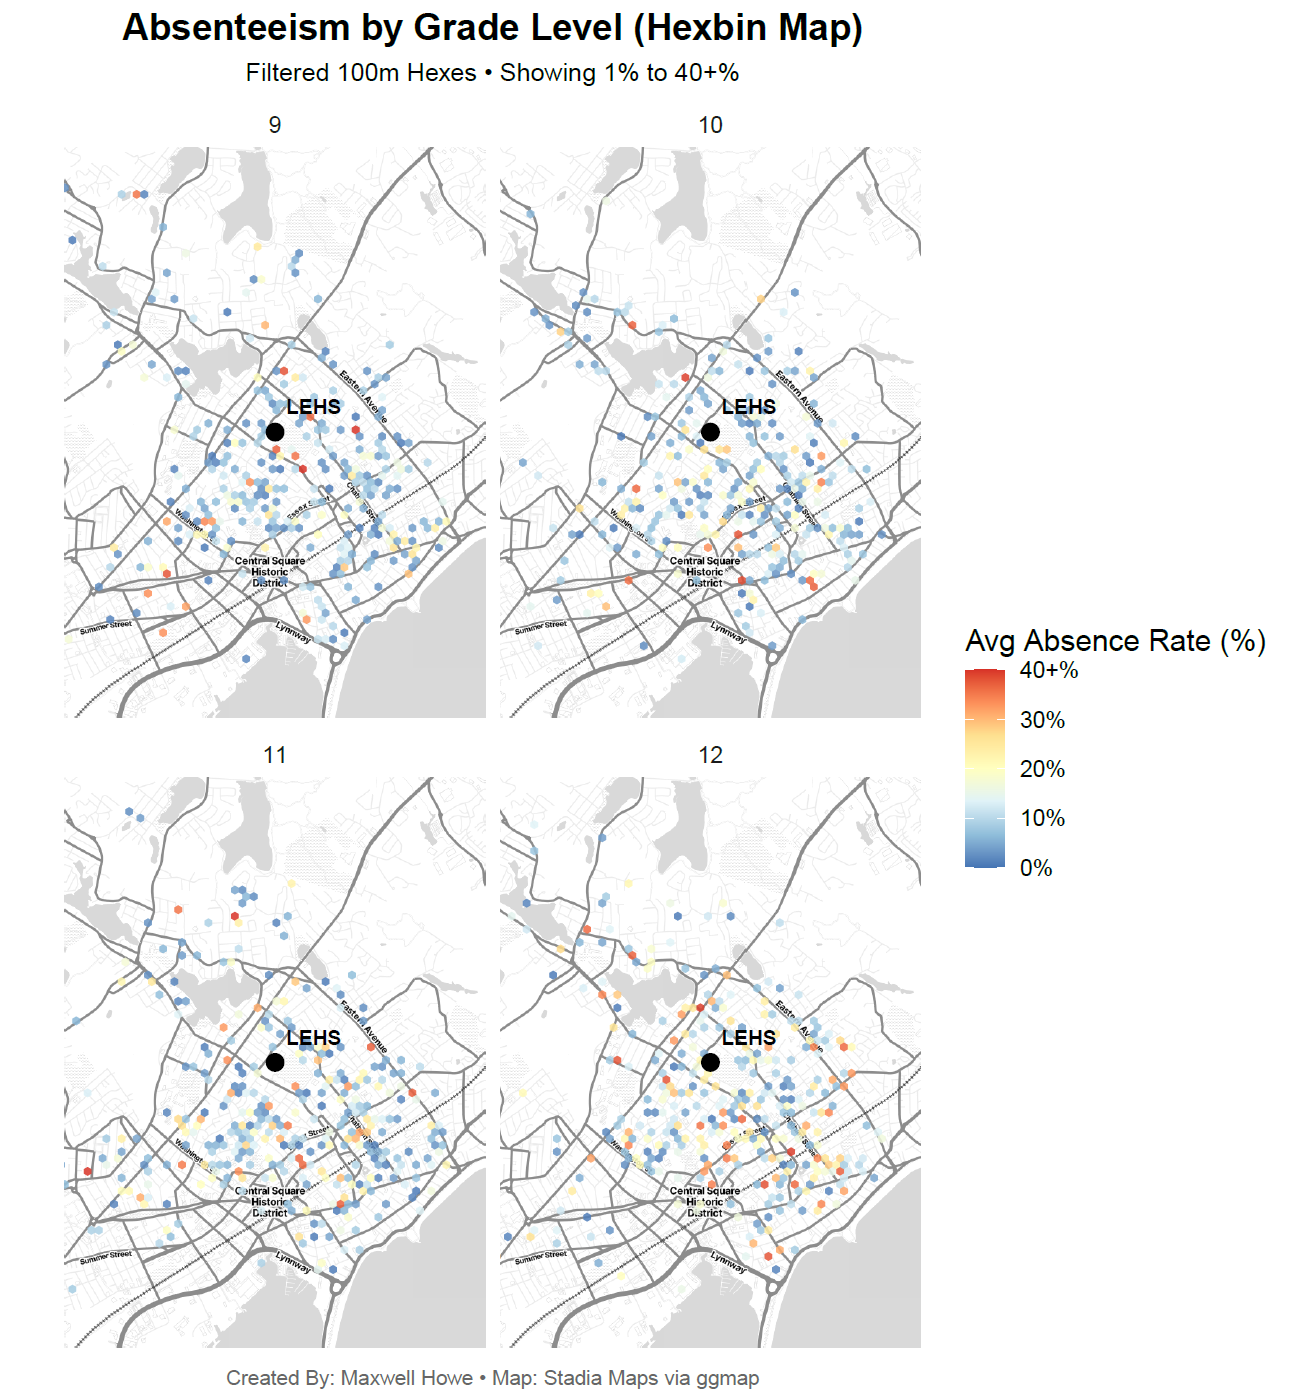
Lynn: Grade-Level Panels
Absenteeism by Grade Level (Hexbin)
Four-panel small multiples — absence rate hexbins by grade (9, 10, 11, 12).
R
Hexbin
Small Multiples
Capstone
View full project →
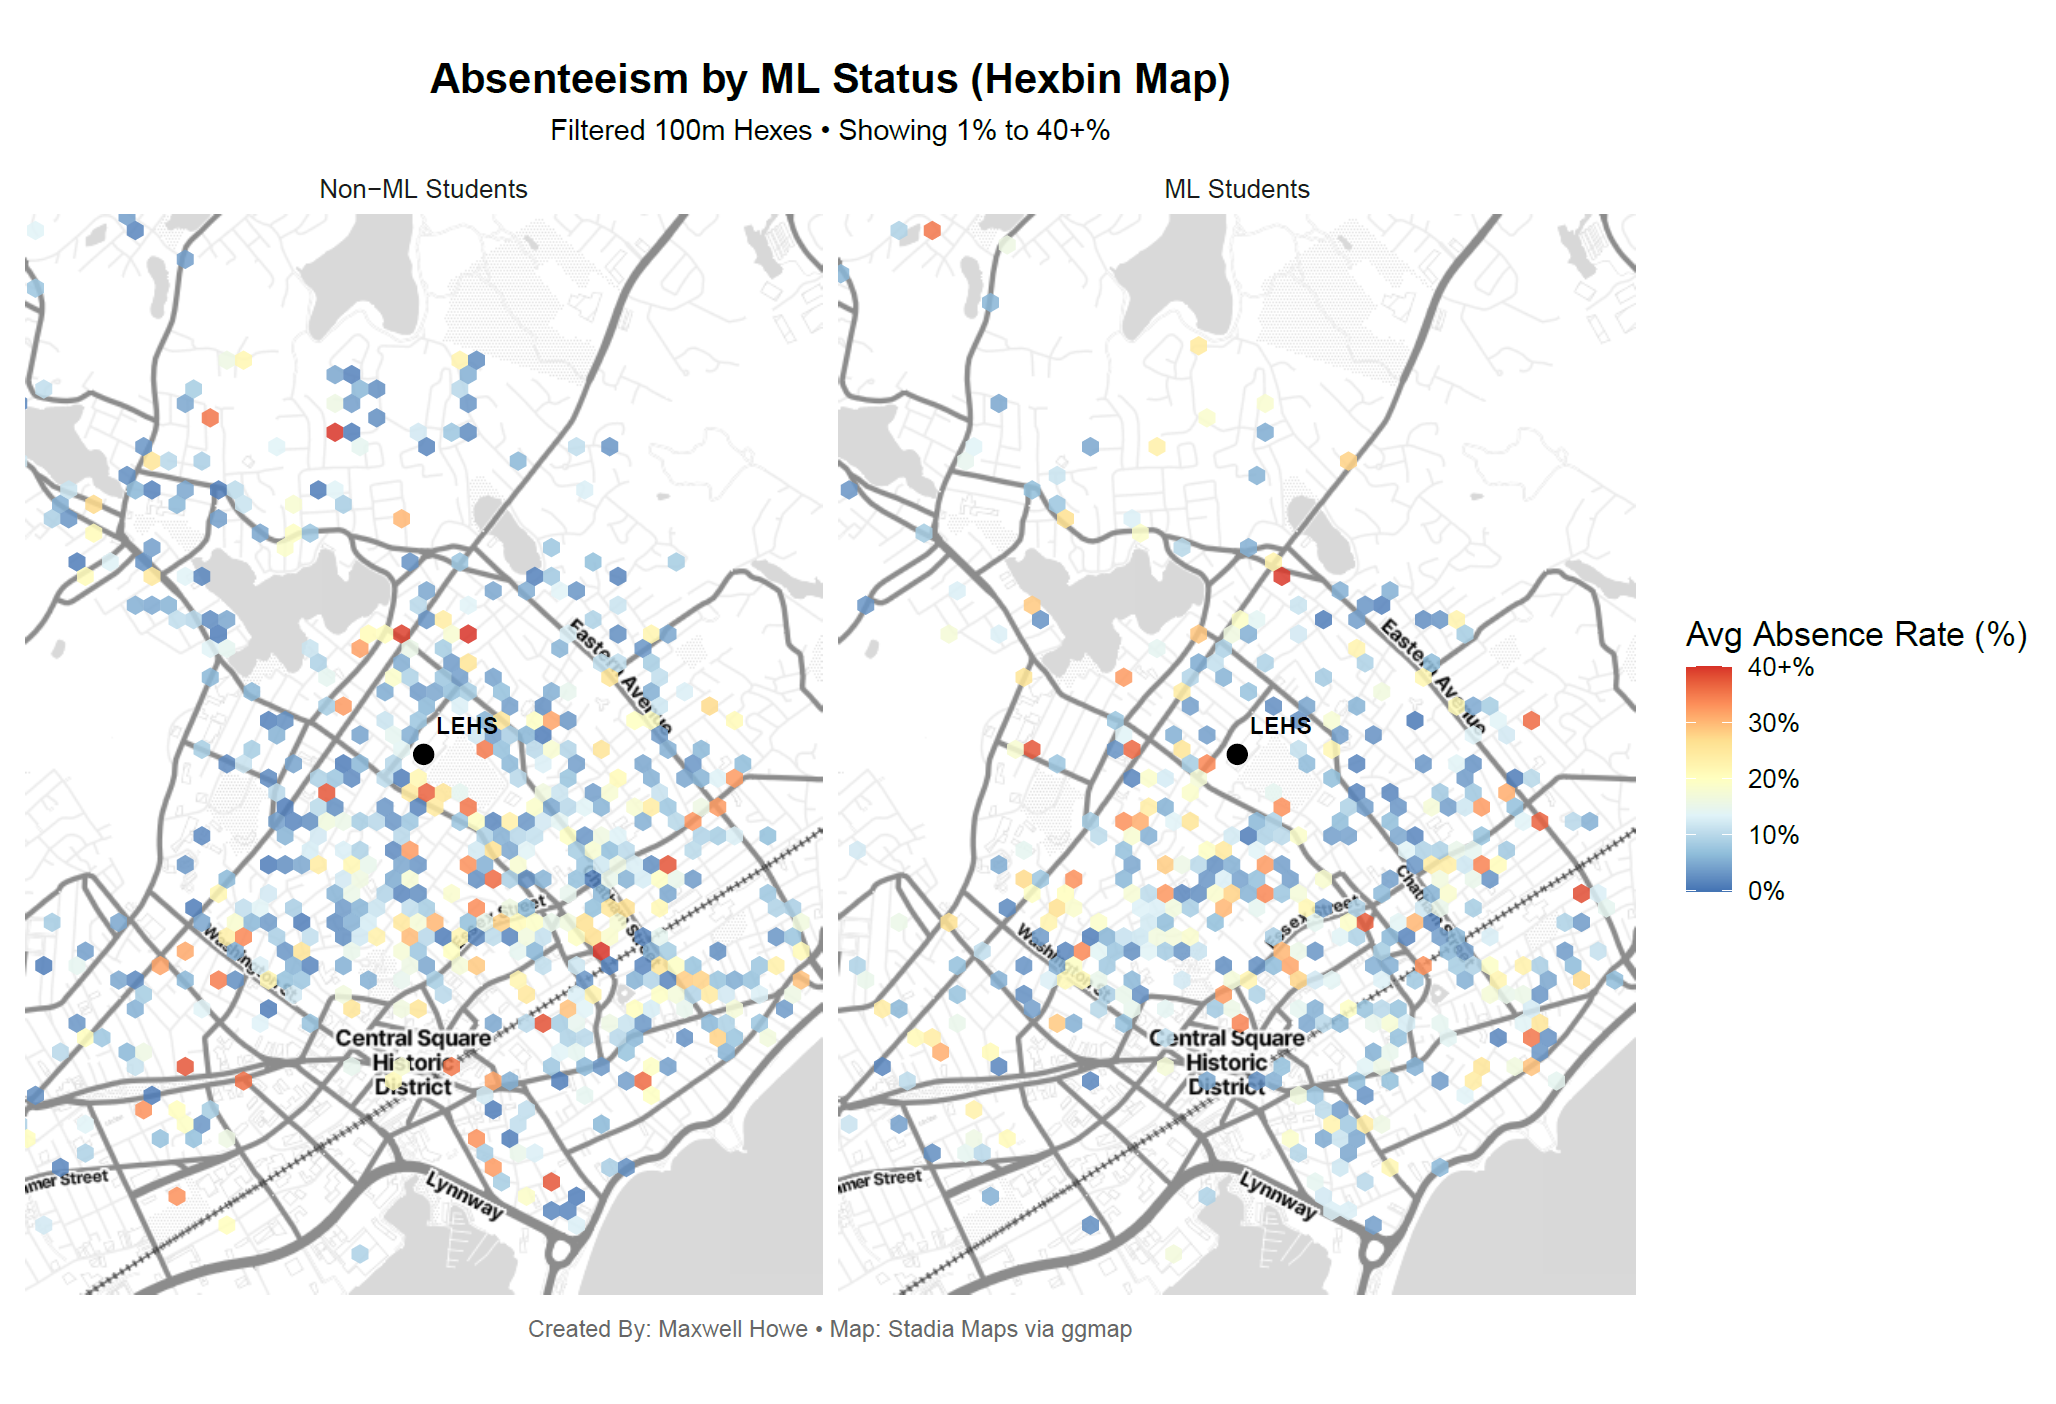
Lynn: ML vs Non-ML
Absenteeism by ML Status
Multilingual Learner vs Non-ML absenteeism — the achievement gap rendered geographically.
R
Hexbin
Equity
Capstone
View full project →
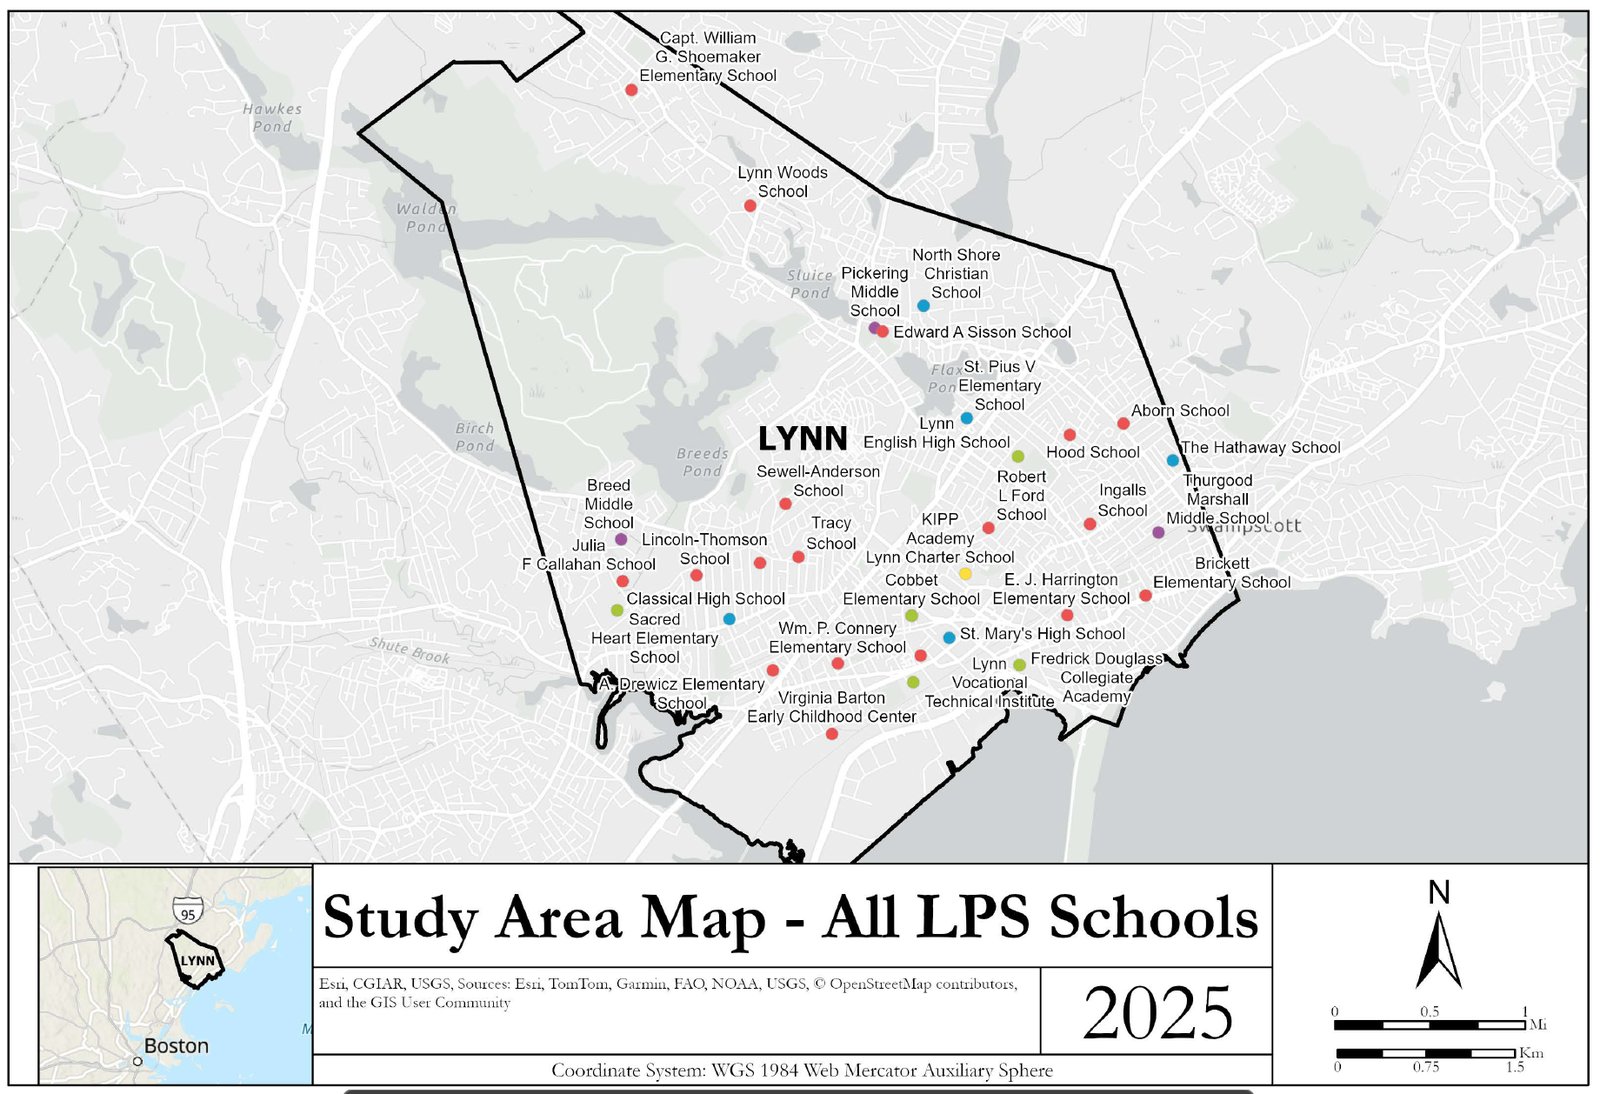
Lynn: LPS Study Area
Lynn Public Schools — Study Area
Reference map of every LPS site within the Lynn city boundary — foundation for the capstone.
ArcGIS Pro
Reference Map
Capstone
Lynn
View full project →
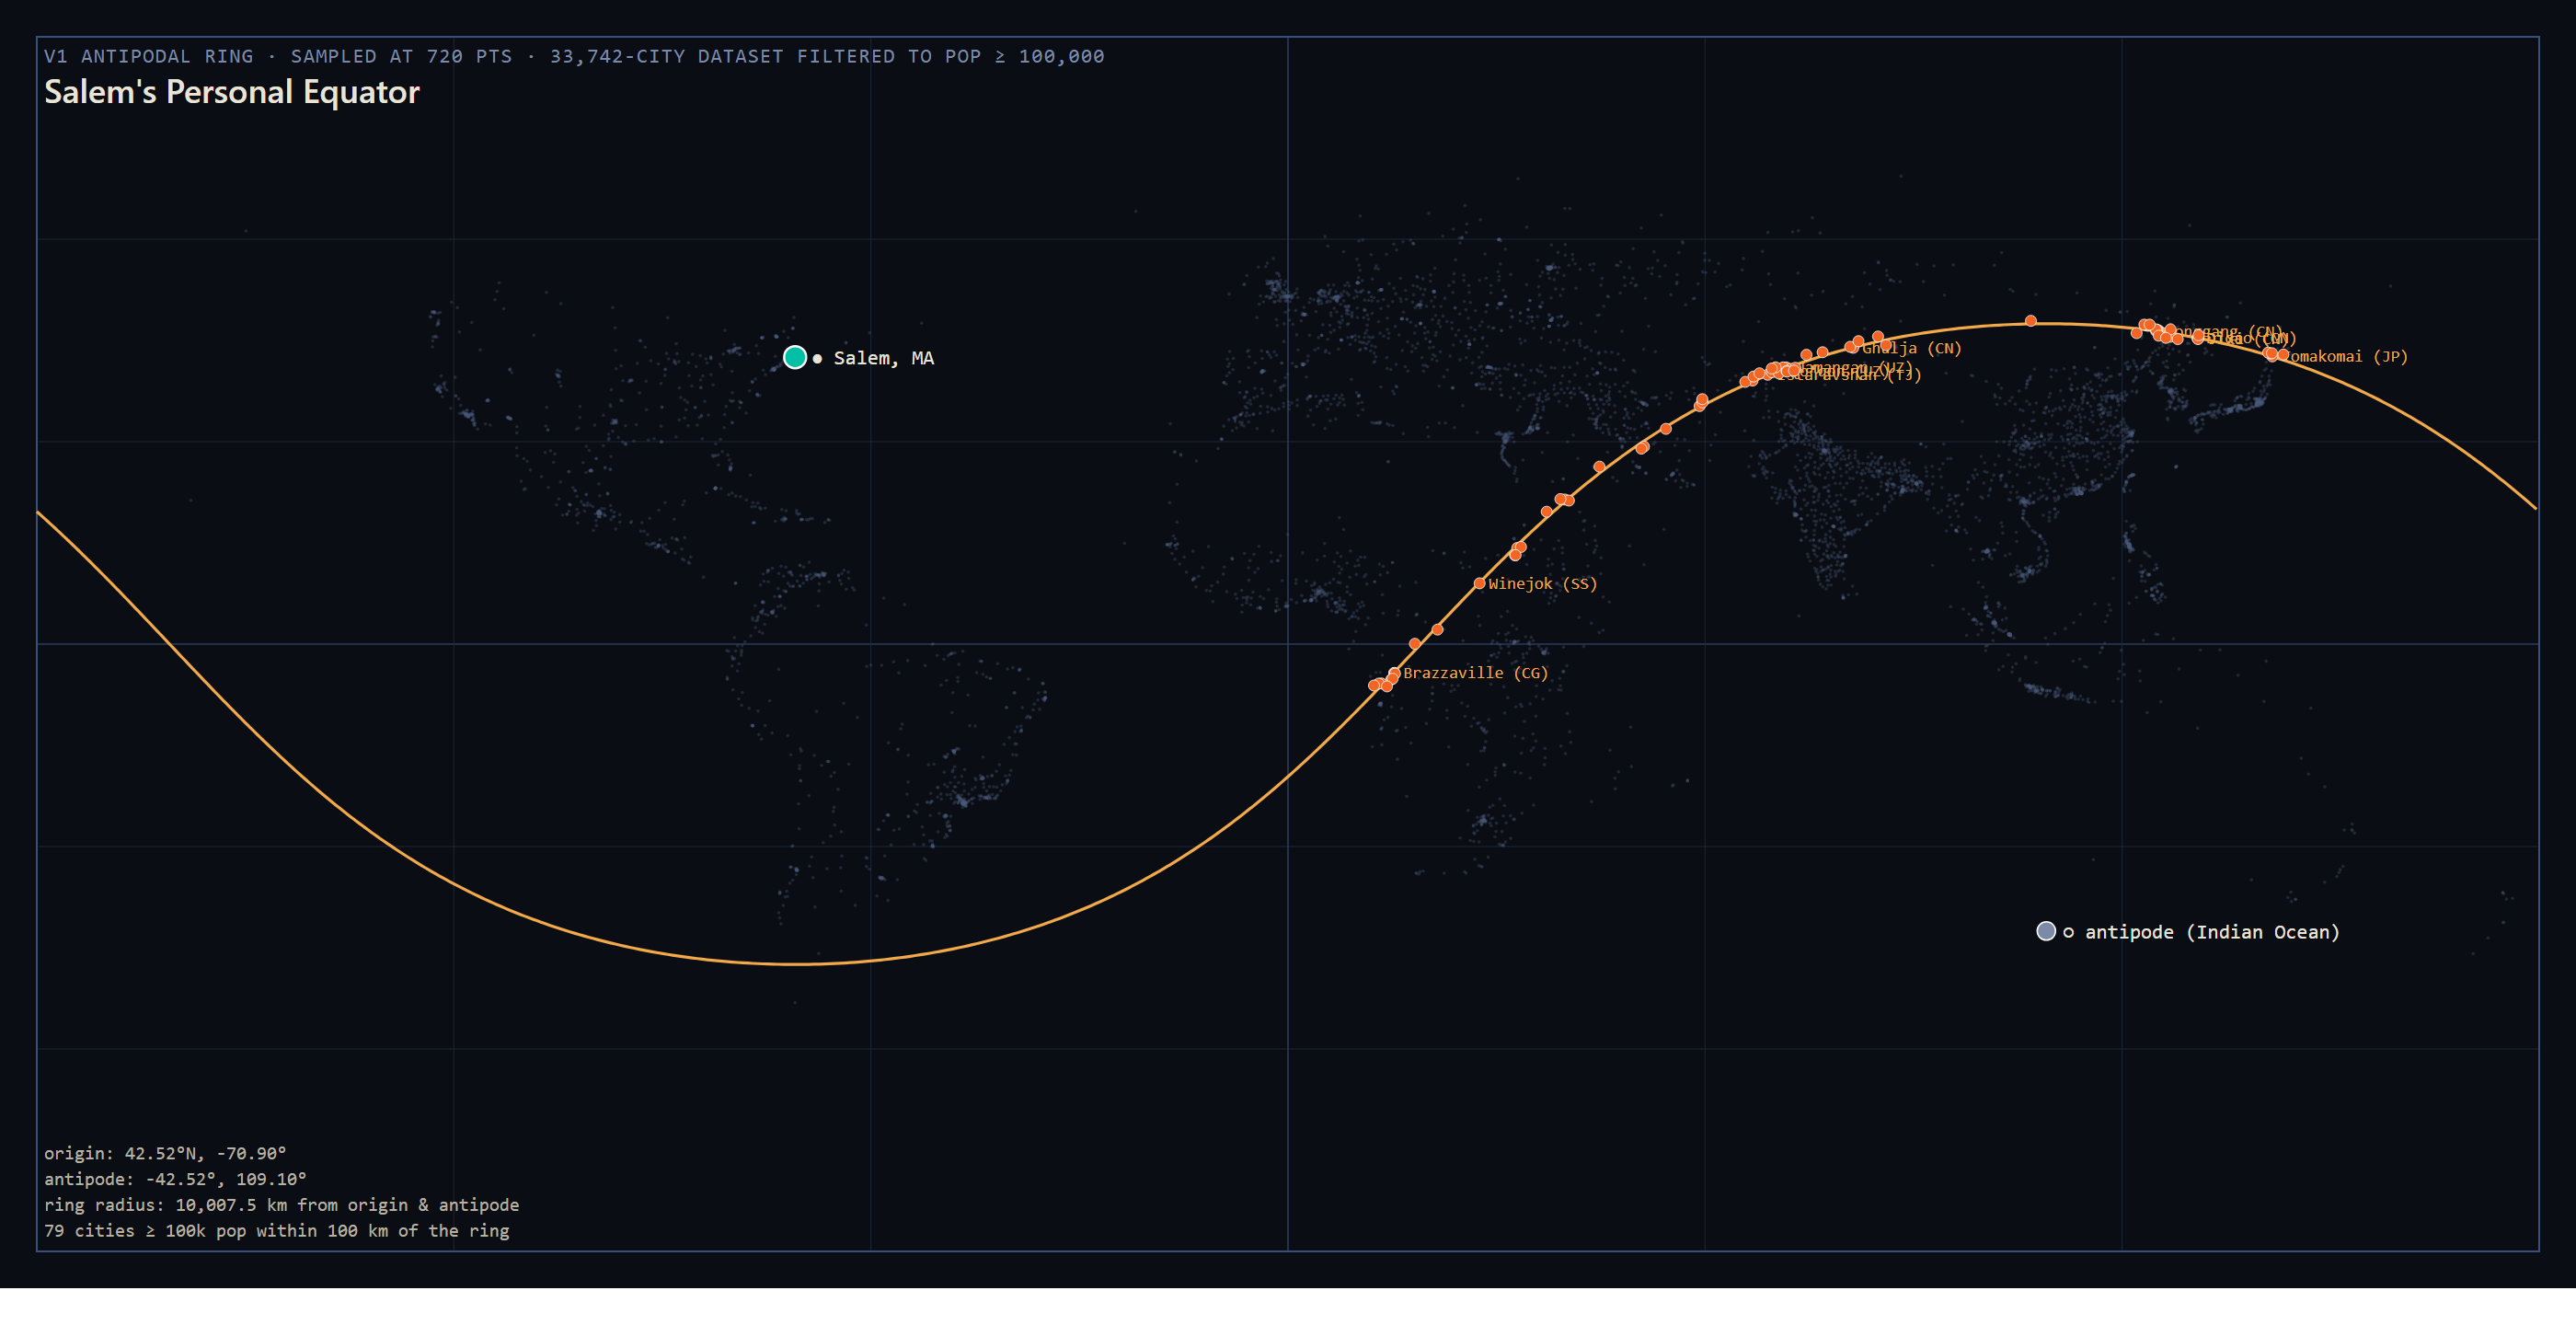
Salem Antipodal Ring
Salem Antipodal Ring
Antipodal correspondence around Salem, MA — every point on the ring has a matching point on the opposite side of the globe.
Geopuesto
Geometry
Playground
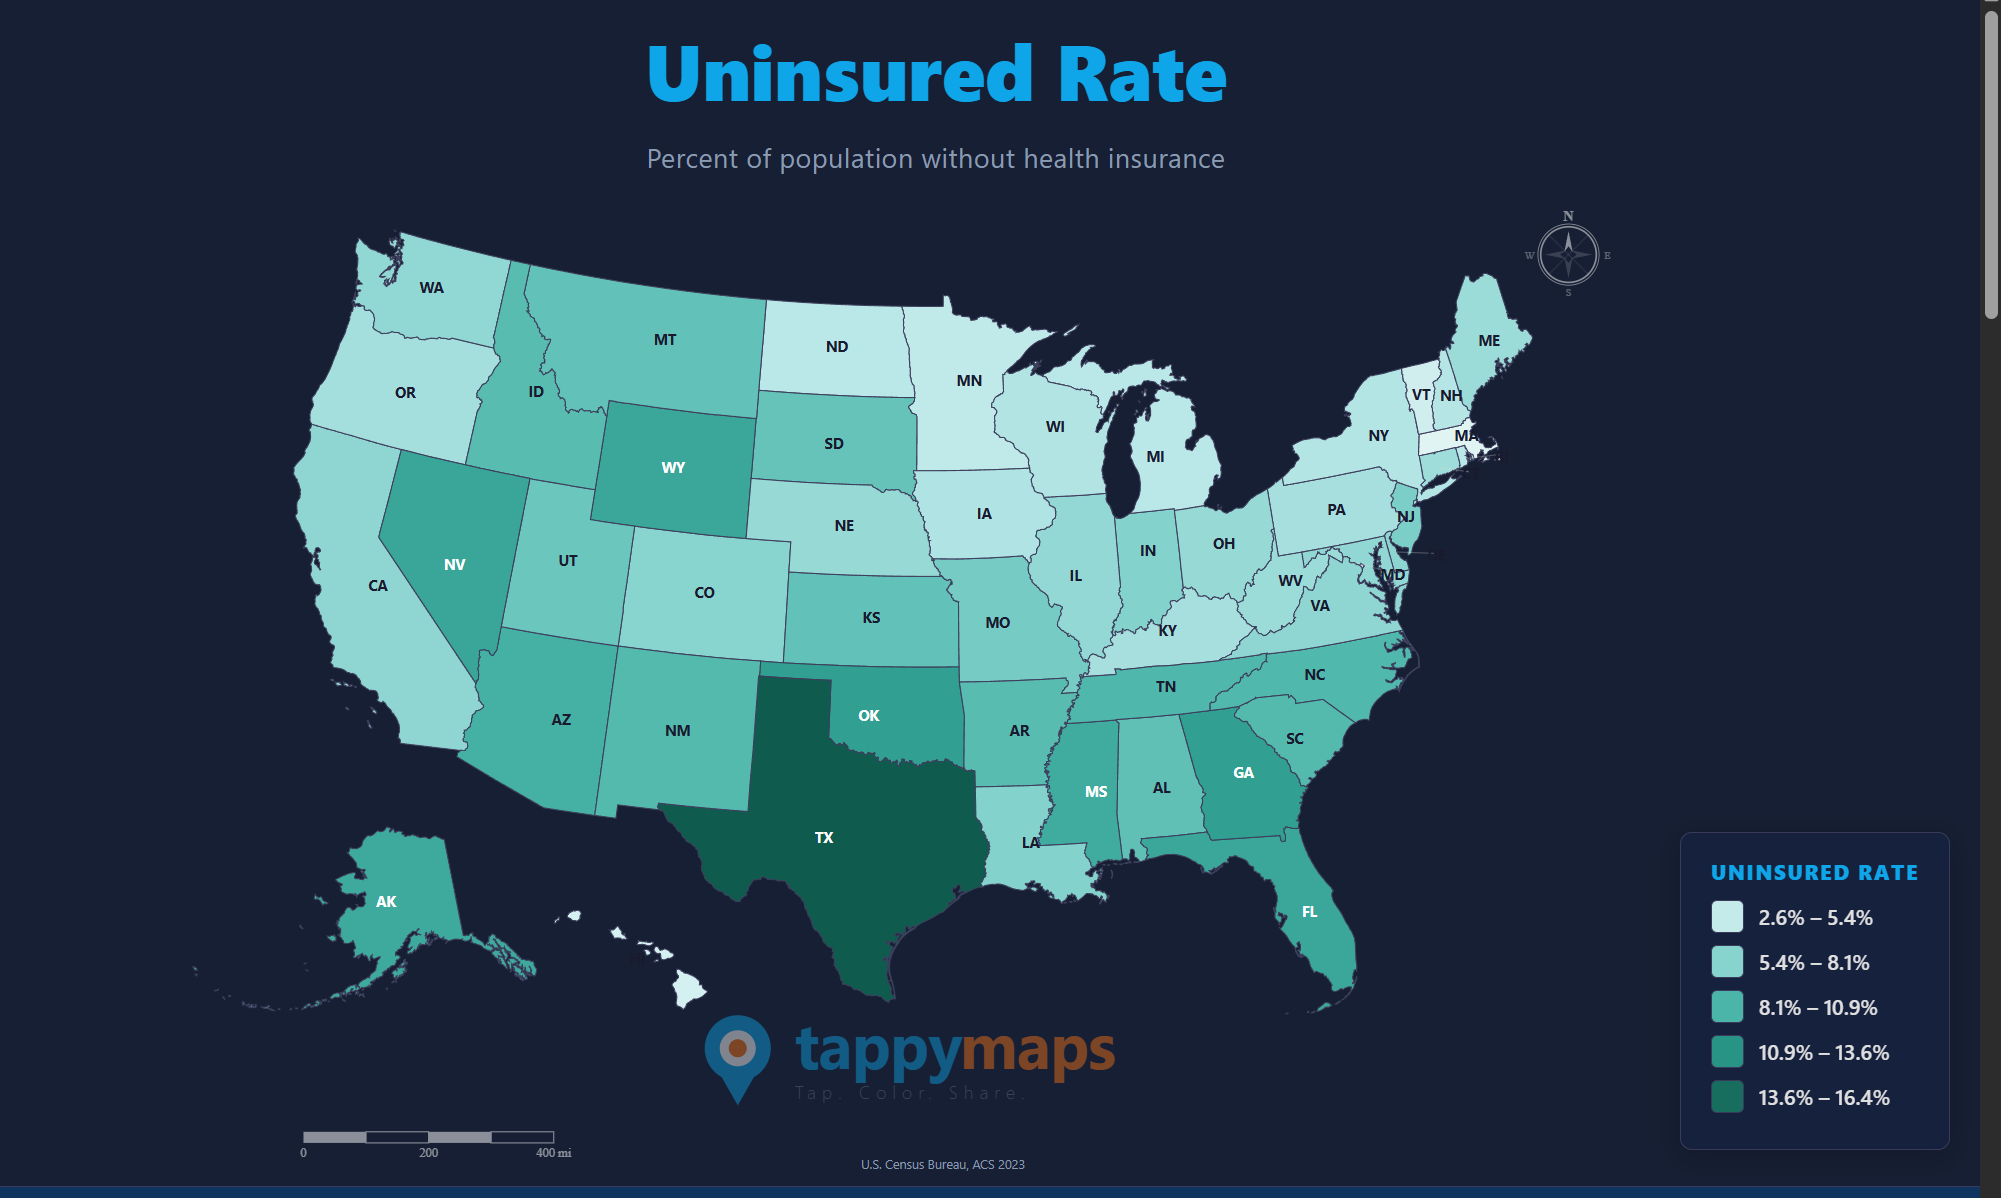
TappyMaps: Uninsured Rate
TappyMaps Demo: US Uninsured Rate
State-level US uninsured rate, 5 quantile bins, 2023 Census data — rendered as a TappyMaps share card.
TappyMaps
Choropleth
Census
Tool Demo
See the tool →
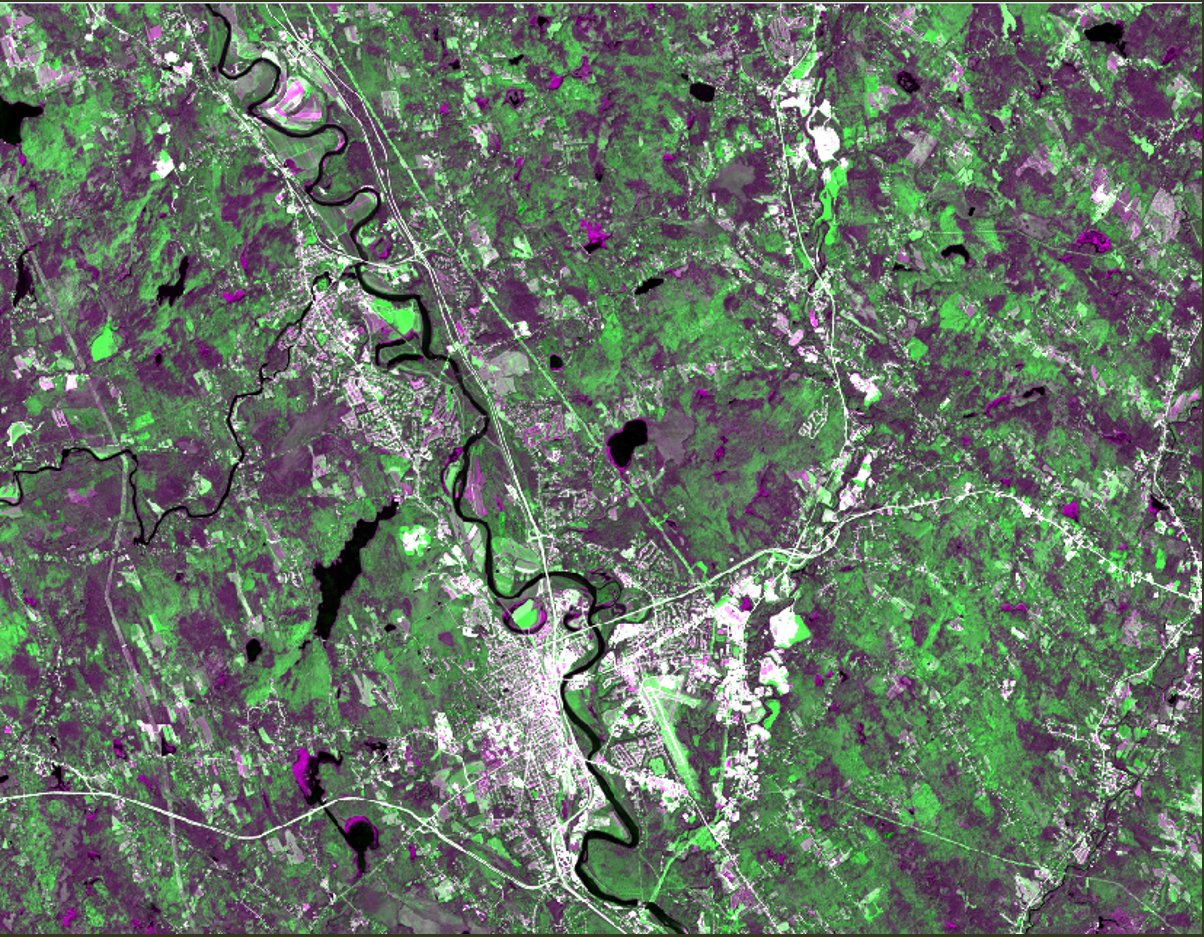
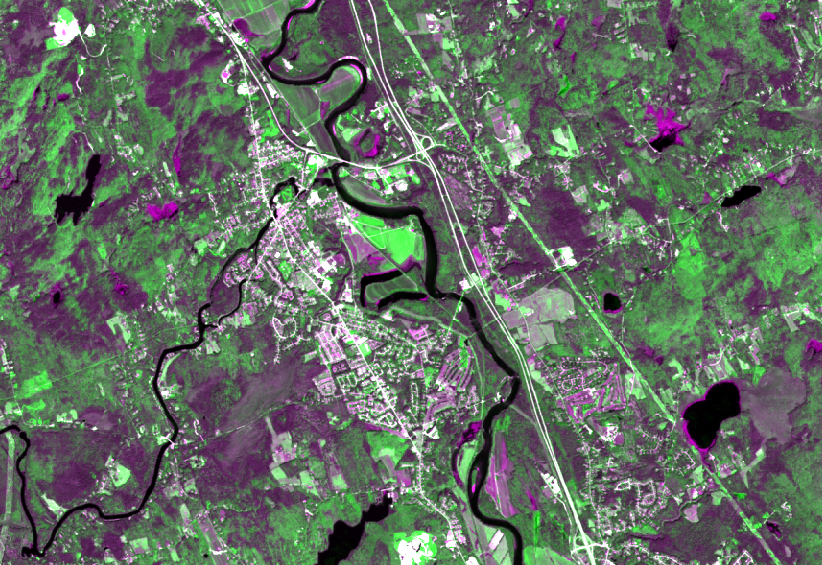
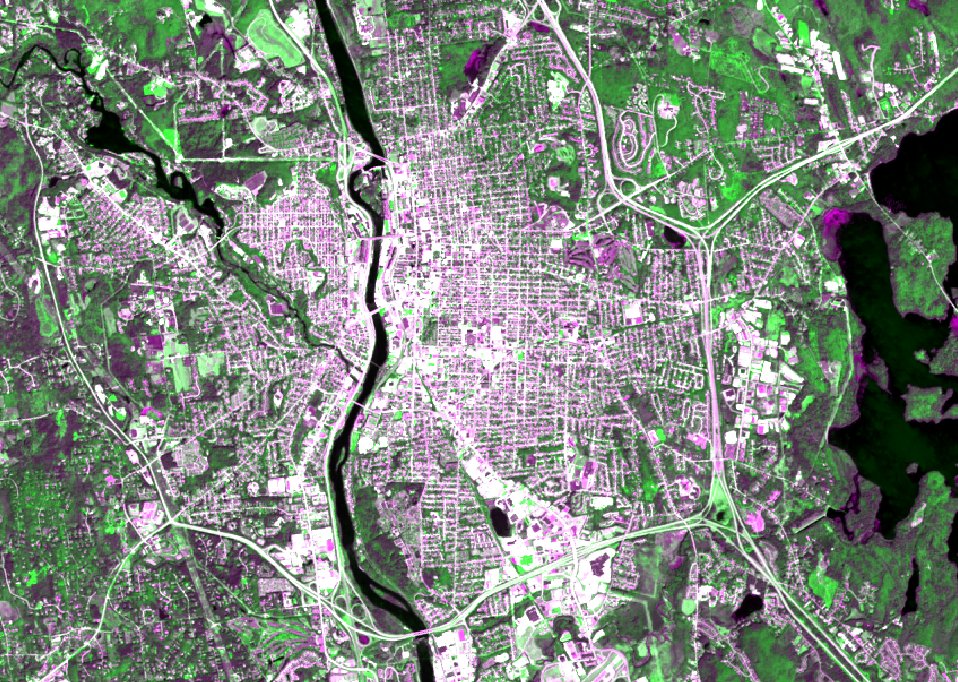
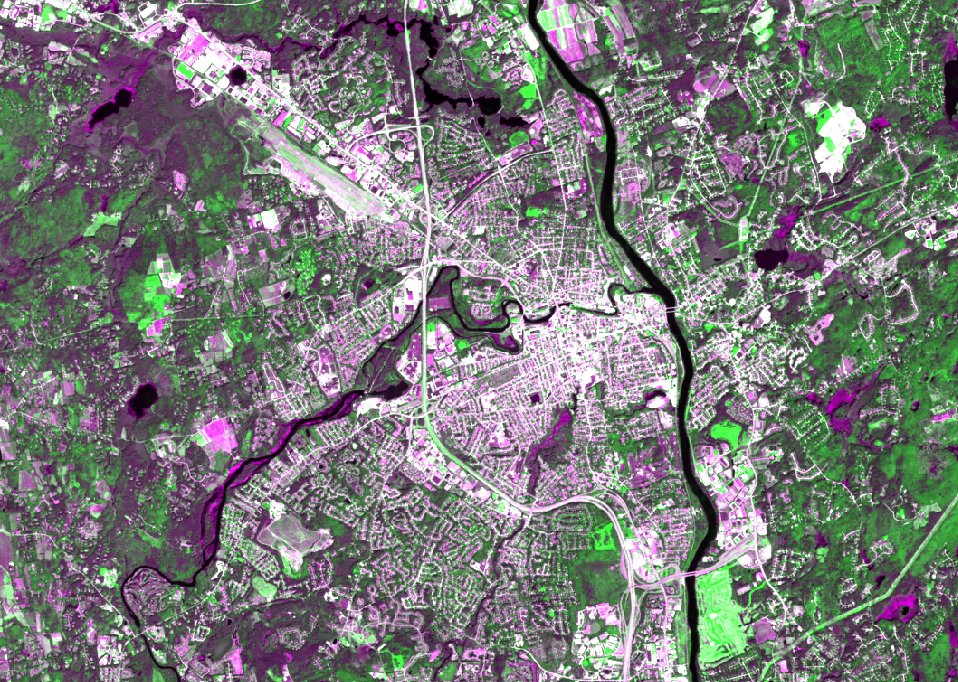
Granite State: Landsat False-Color
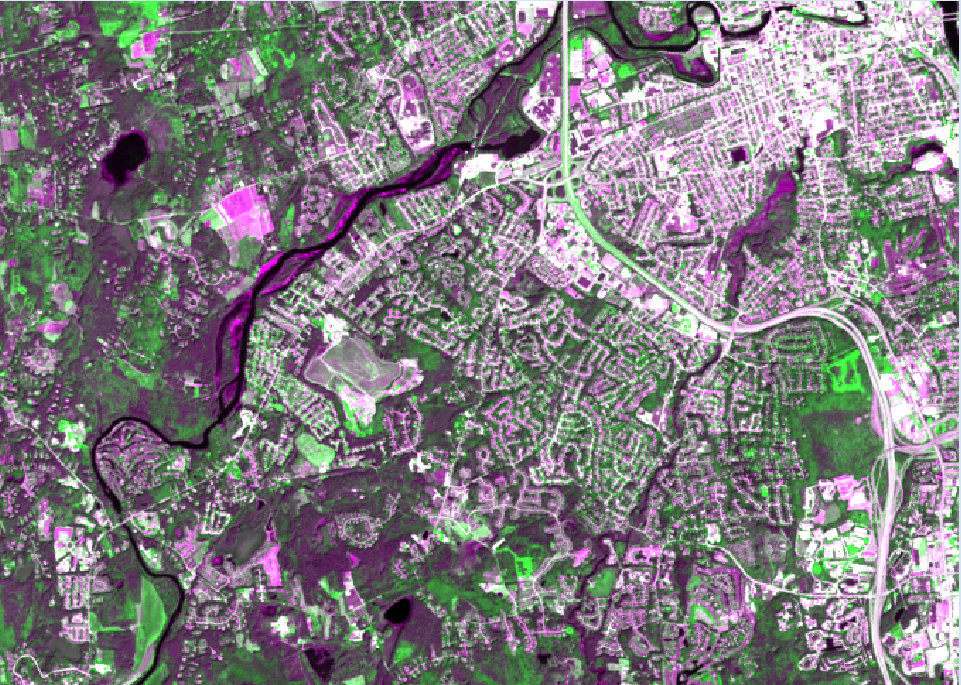
Granite State: Full Landsat False-Color Composite
Multitemporal Landsat 8/9 over greater Concord, NH. Green = vegetation, magenta = developed/disturbed surfaces.
Landsat 8/9
Remote Sensing
False Color
TerrSet
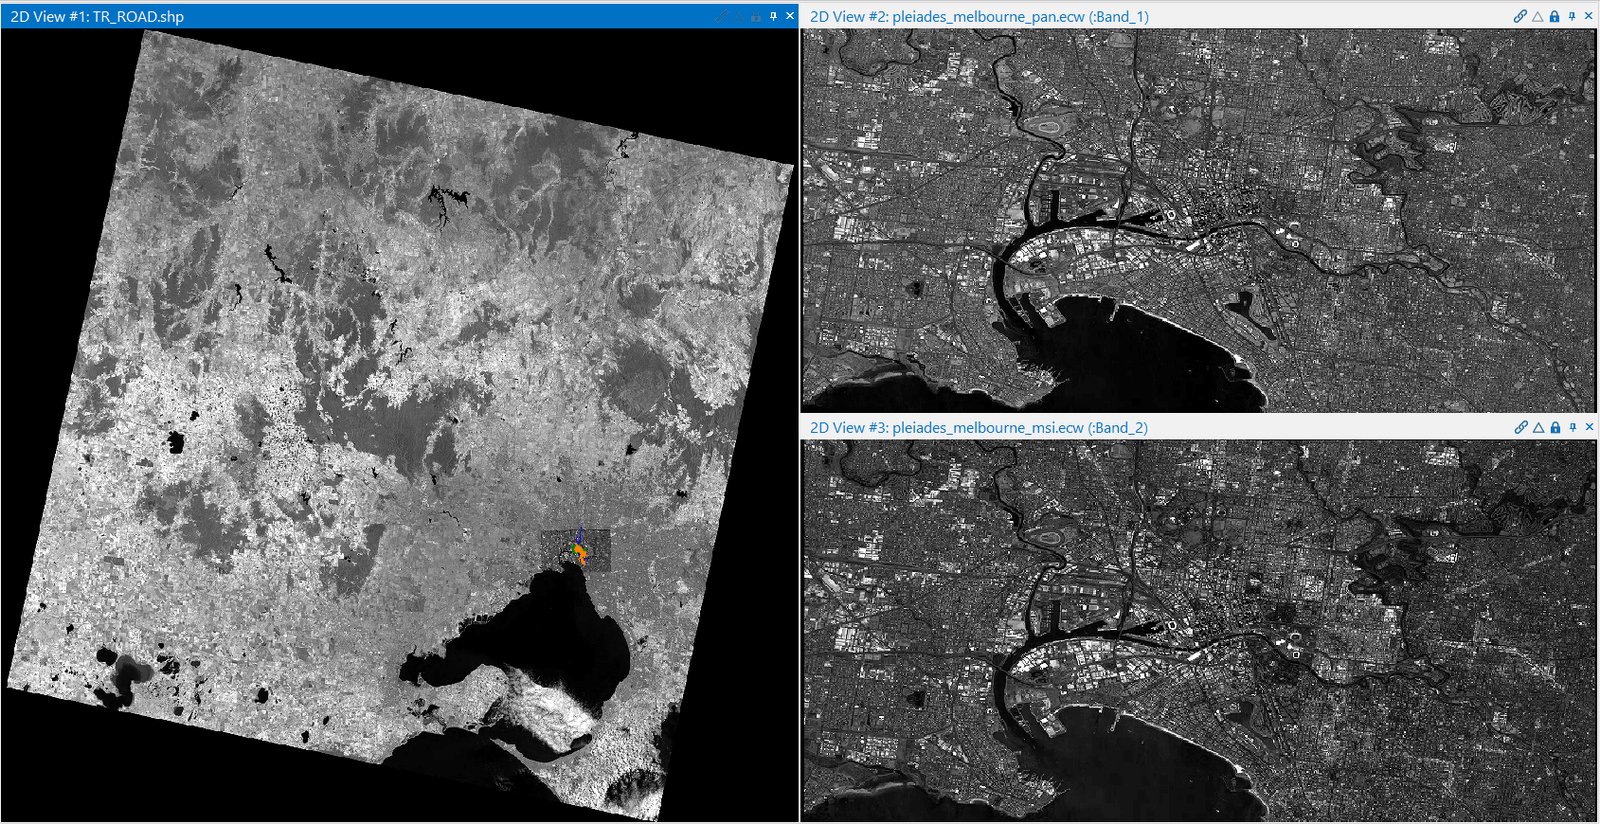
Pleiades: Melbourne Port
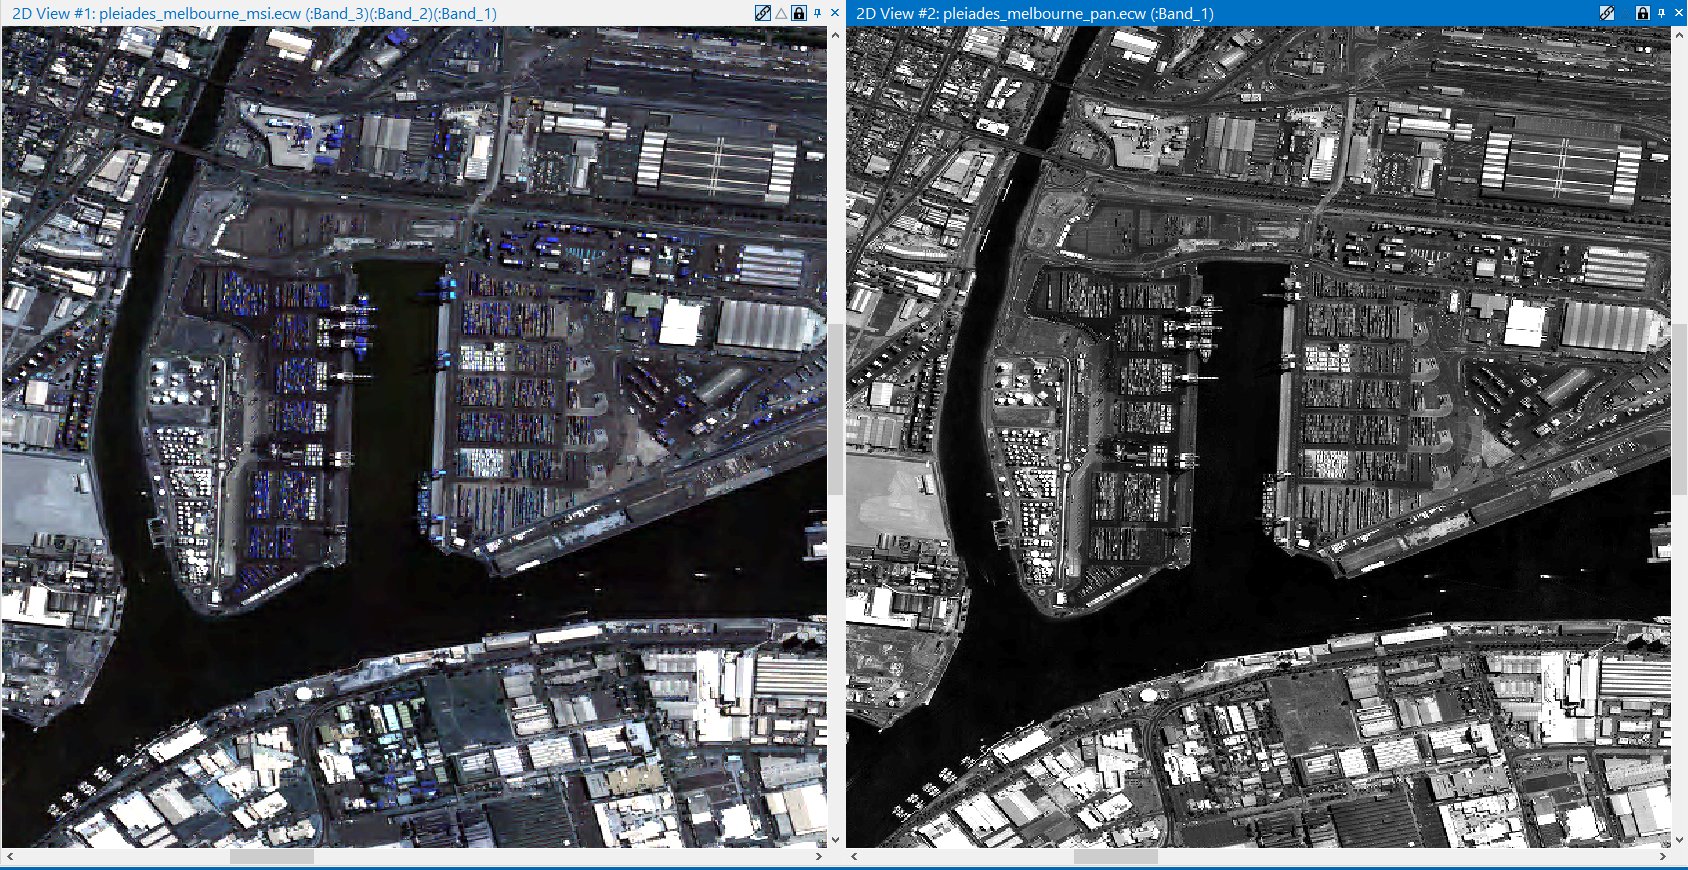
Pleiades Multispectral — Melbourne Port
Multispectral vs panchromatic Pleiades-1 imagery over the Port of Melbourne. Resolution fine enough to count individual shipping containers.
Pleiades-1
Remote Sensing
Multispectral
Pleiades: MCG Sports Precinct
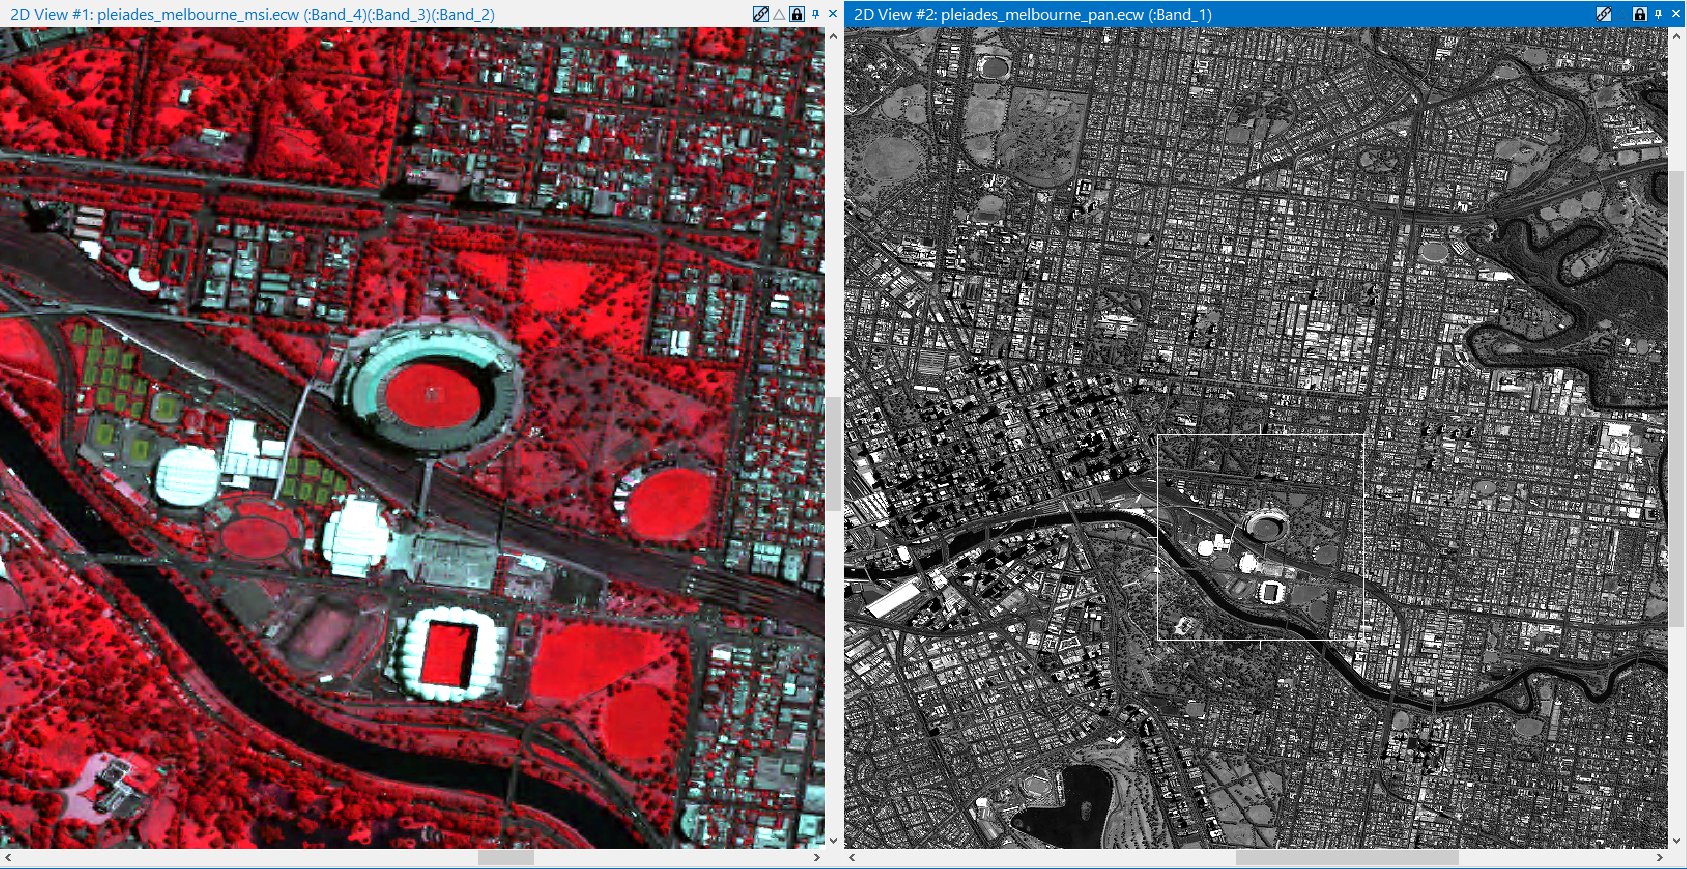
Pleiades Multispectral — Melbourne Cricket Ground
NIR-as-red mapping makes turf and trees burn crimson around the MCG. Multispectral (L) vs panchromatic (R).
Pleiades-1
Remote Sensing
NIR Composite
Pleiades: Melbourne Wide
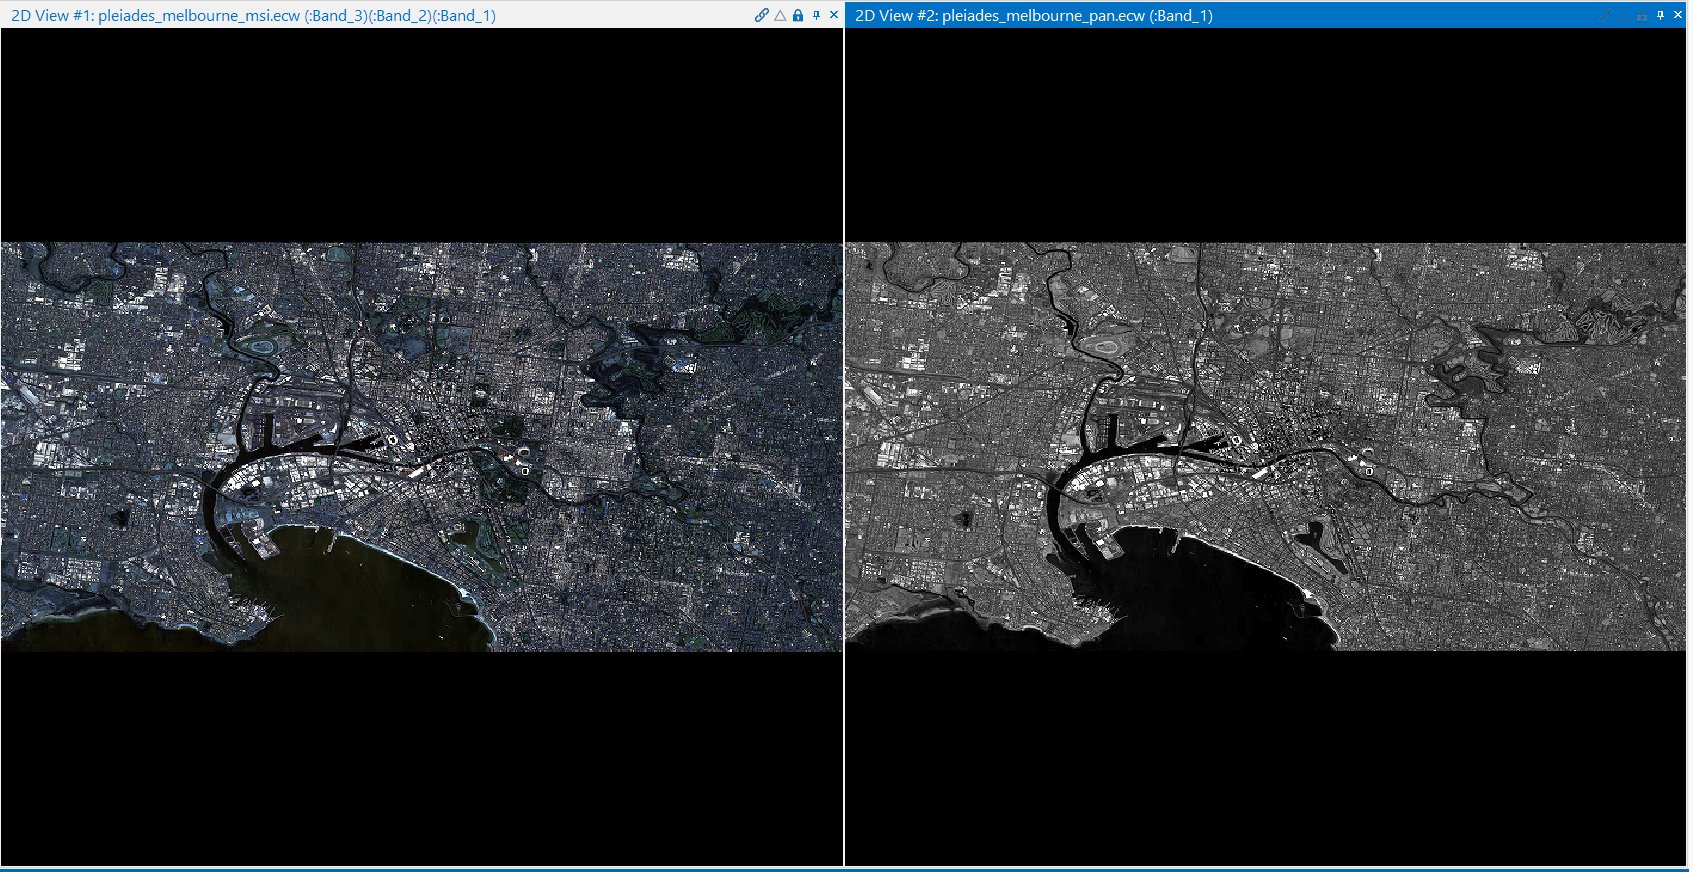
Pleiades Multispectral — Melbourne Wide View
Wide-area Pleiades-1 imagery of Melbourne, Port Phillip Bay, and surrounding suburbs. Multispectral vs panchromatic.
Pleiades-1
Remote Sensing
Multispectral
Salem Pantry: Users by CBG
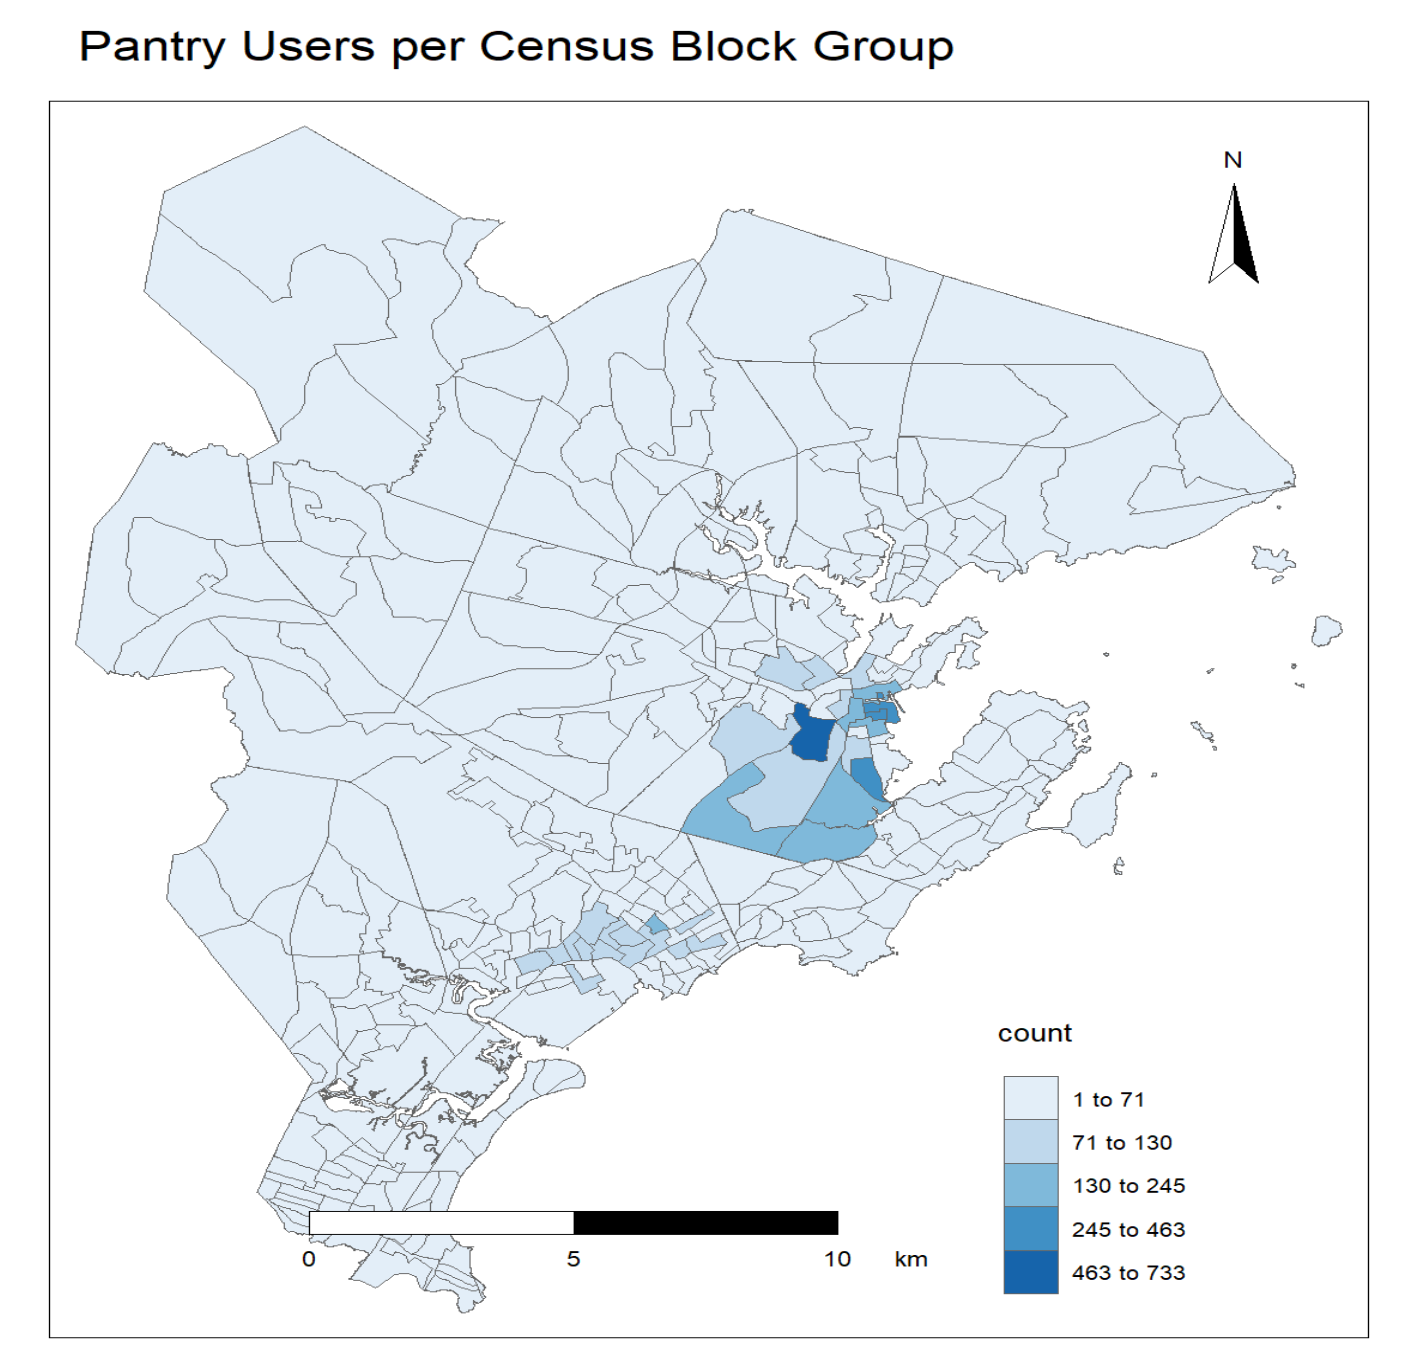
Salem Pantry: Users per Census Block Group
Pantry users per Census Block Group around Salem, MA.
R
Choropleth
Census
Salem Pantry
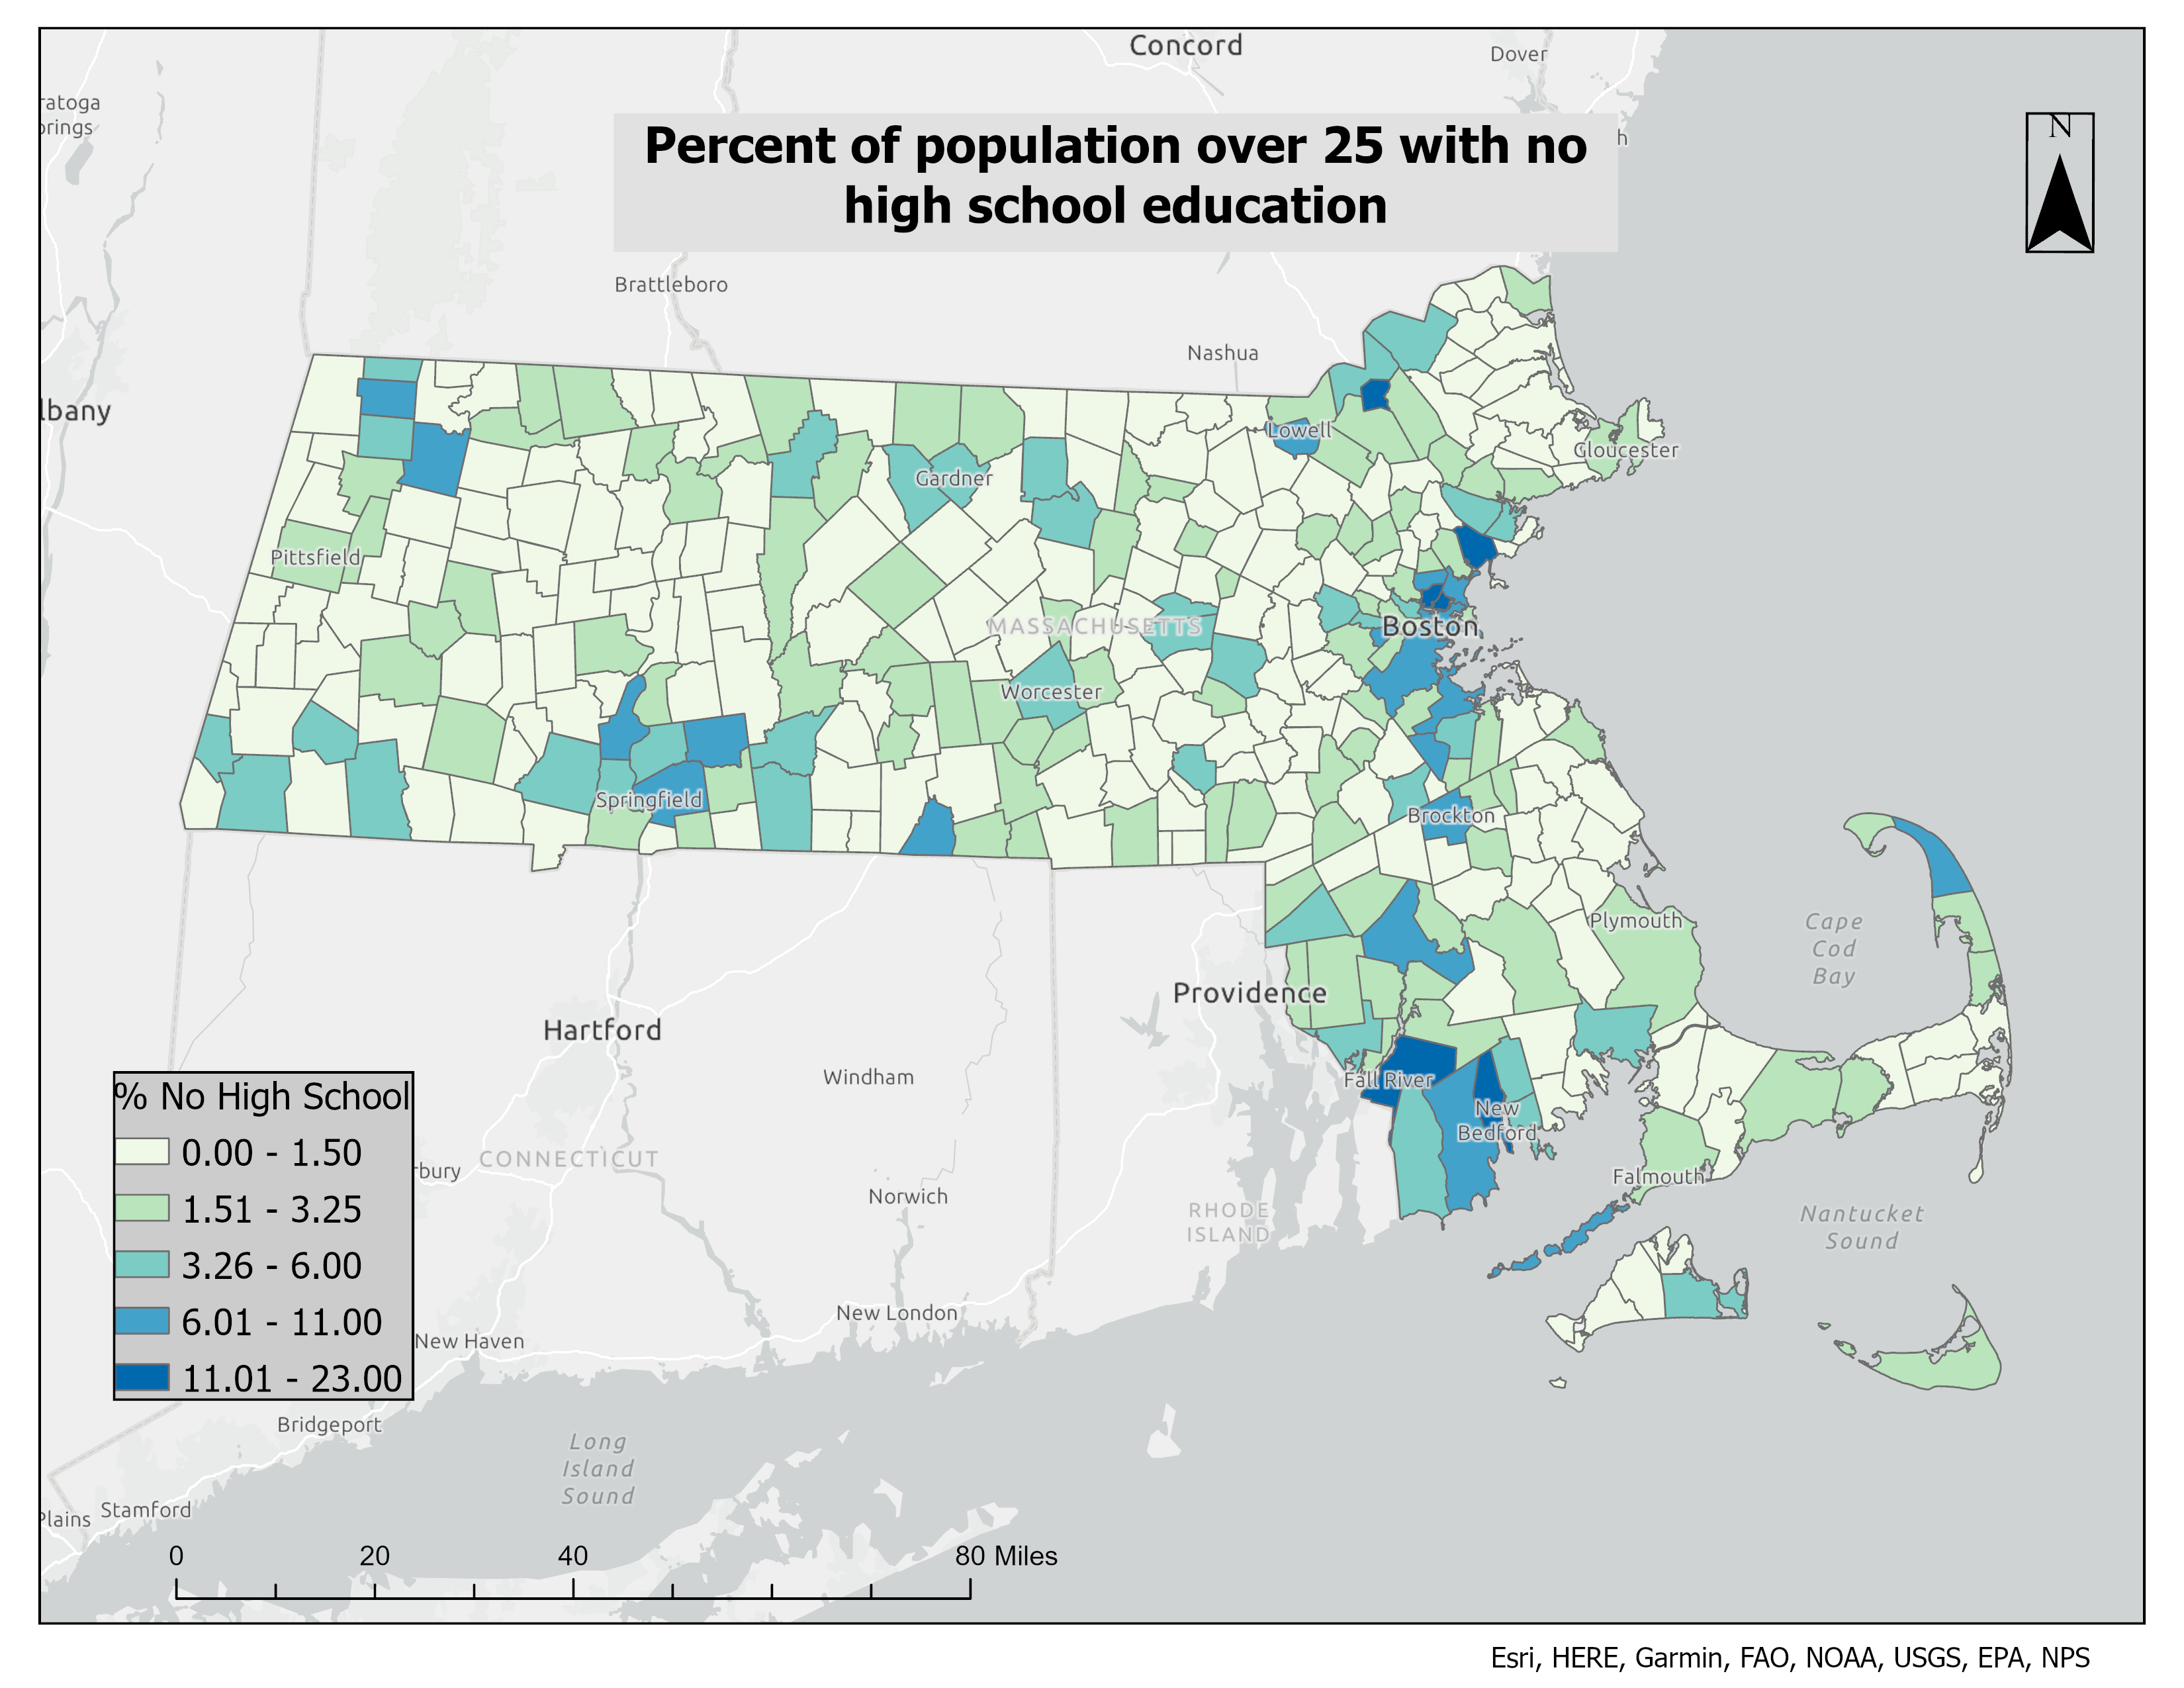
MA: No HS Diploma
MA: % Without a High School Diploma
% over 25 without a high school diploma, MA towns.
ArcGIS Pro
Choropleth
Census ACS
Education
North Concord (False Color)
North Concord, NH — Landsat False-Color
Tighter Landsat false-color NIR over northern Concord — West Concord / Penacook toward Boscawen and Canterbury.
Landsat 8/9
False Color NIR
Remote Sensing
Granite State
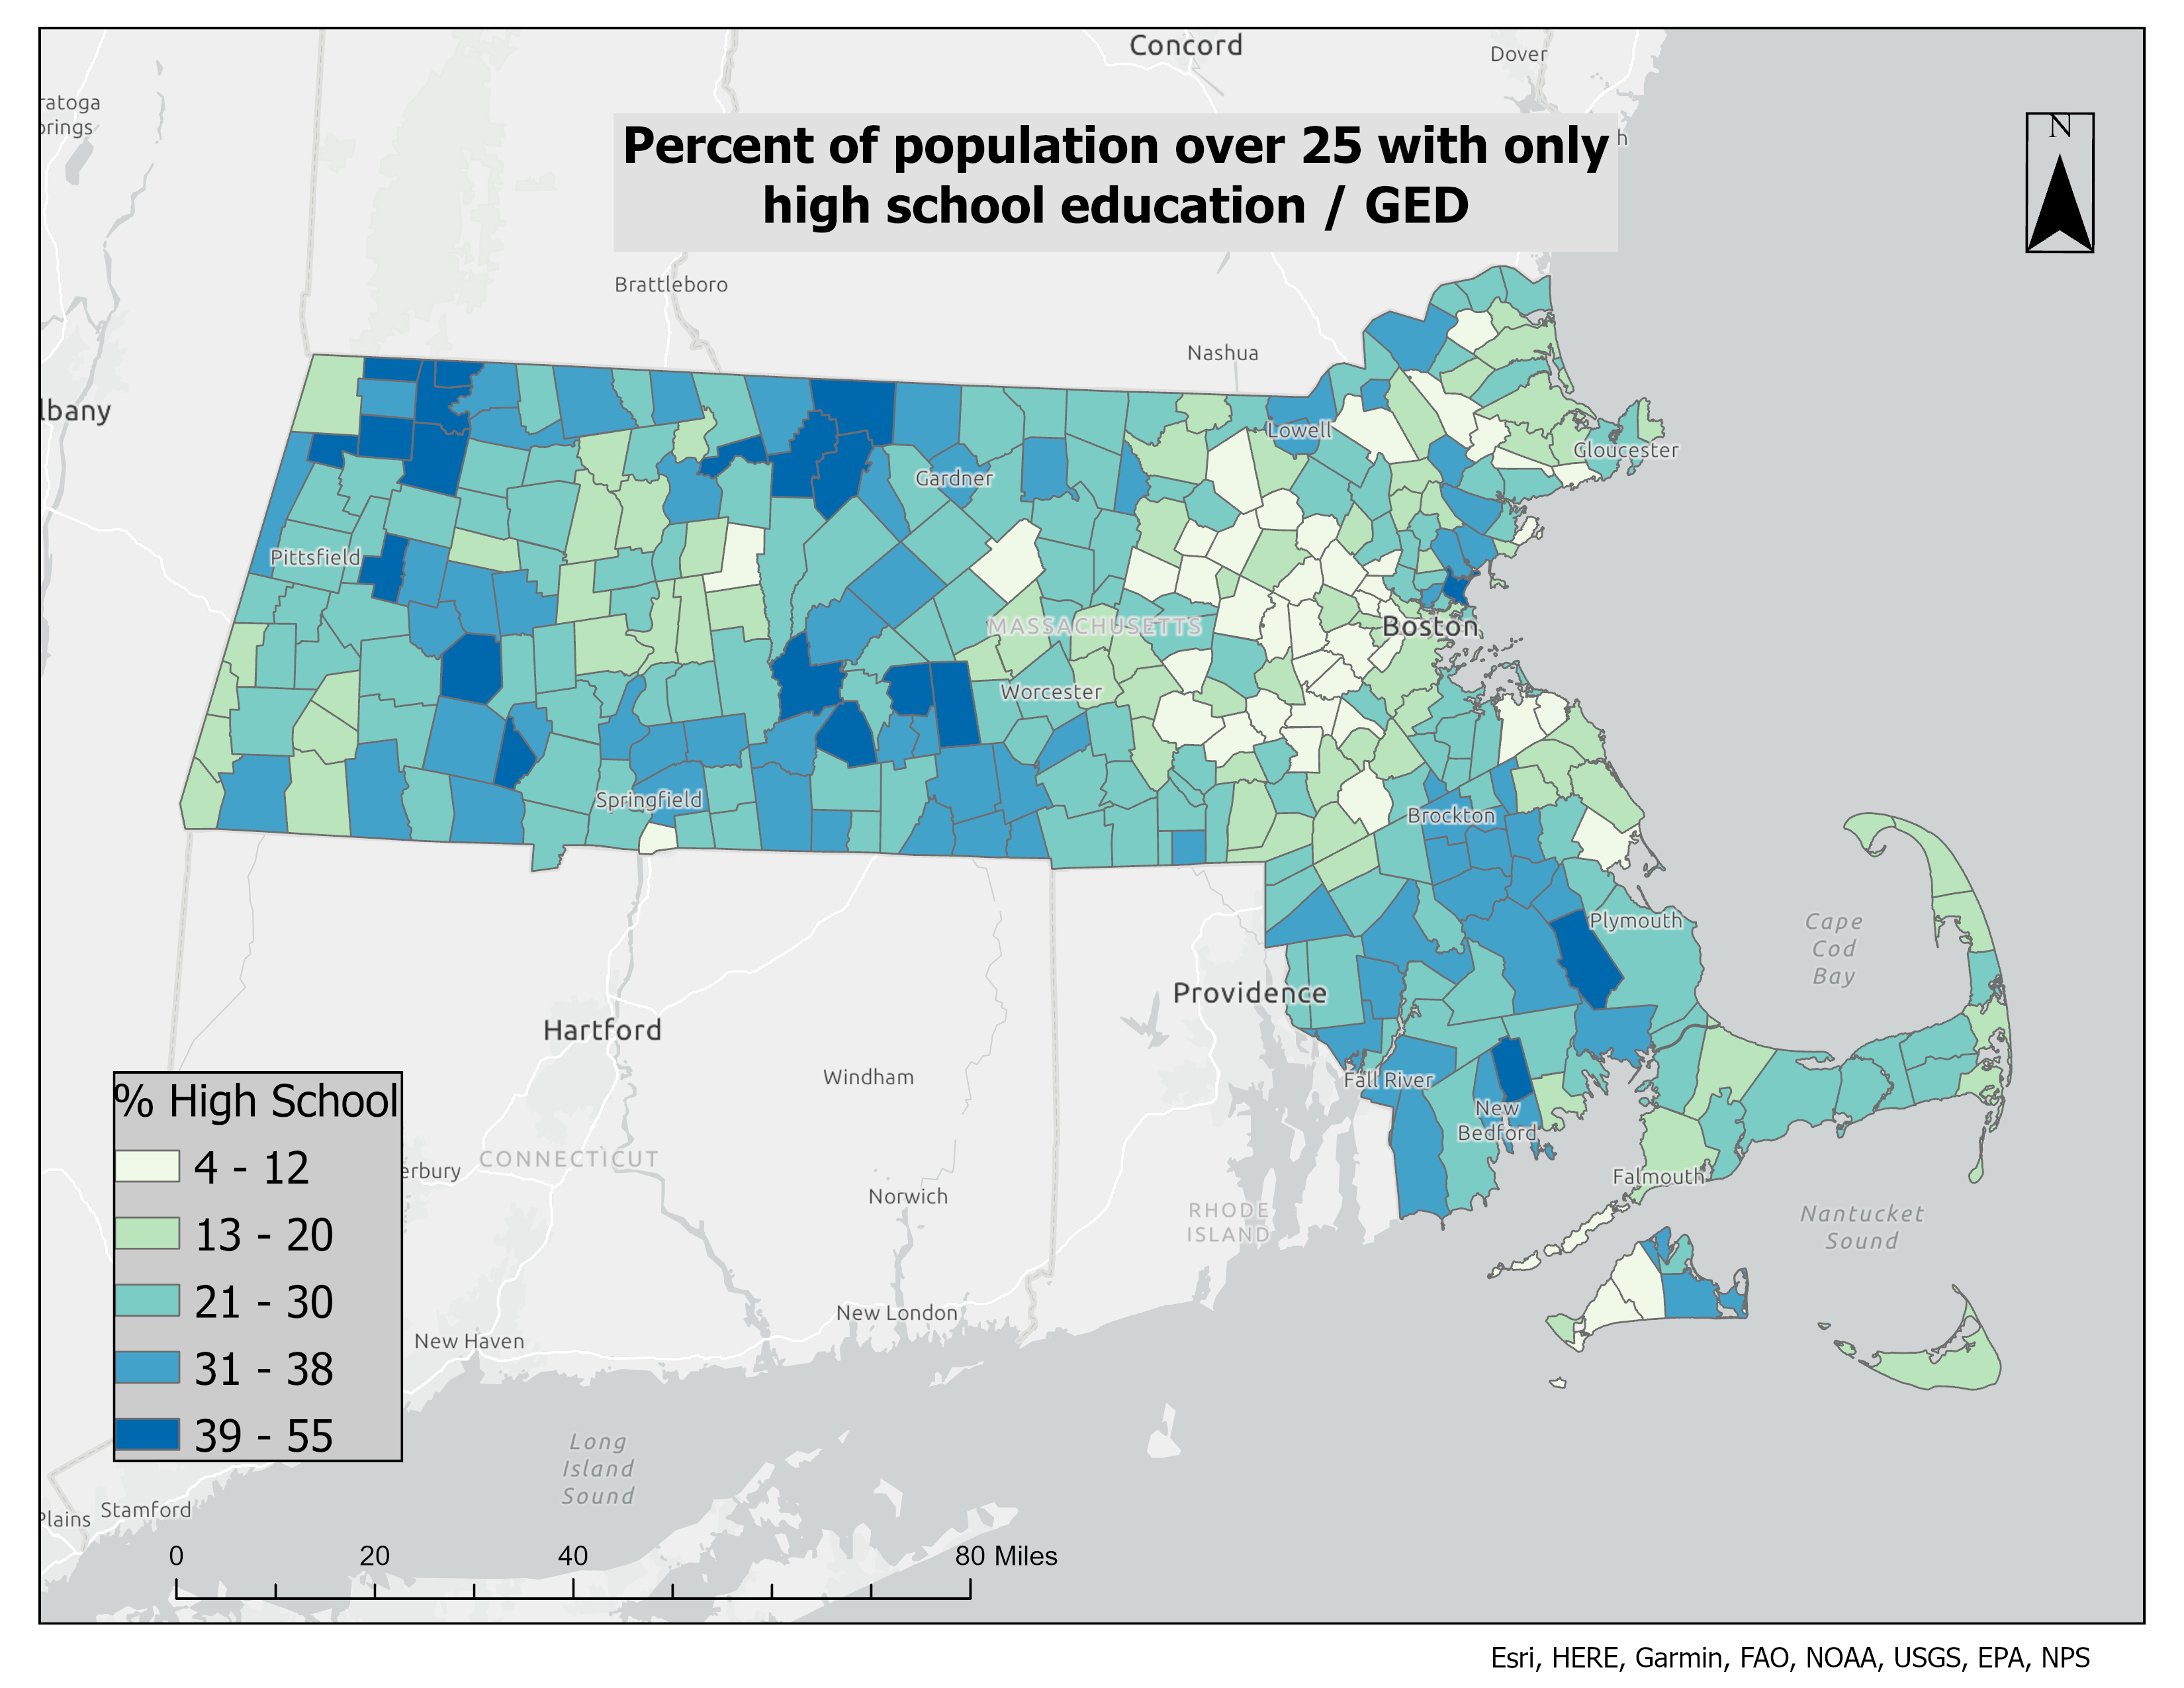
MA: HS / GED Only
MA: % with Only High School or GED
% over 25 whose highest education is HS / GED, MA towns.
ArcGIS Pro
Choropleth
Census ACS
Education
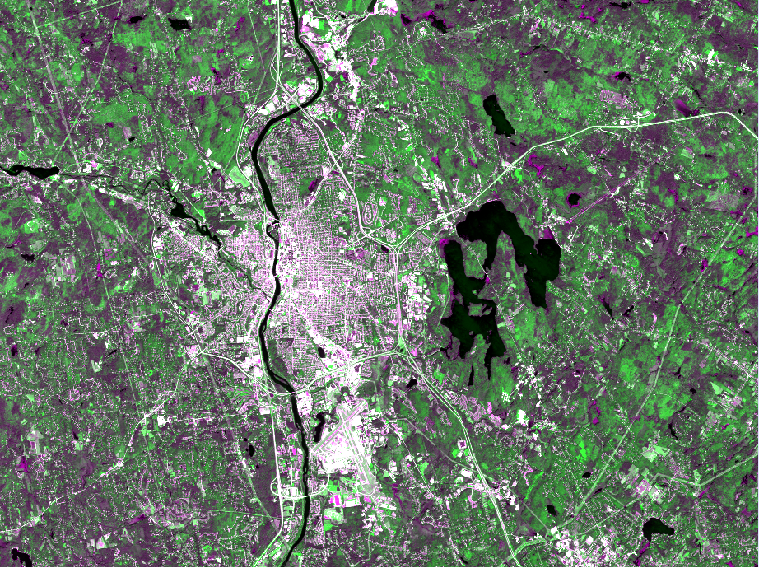
Manchester (False Color)
Manchester, NH — Landsat False-Color NIR
Landsat false-color NIR composite over Manchester, NH.
Landsat 8/9
False Color NIR
Remote Sensing
Granite State
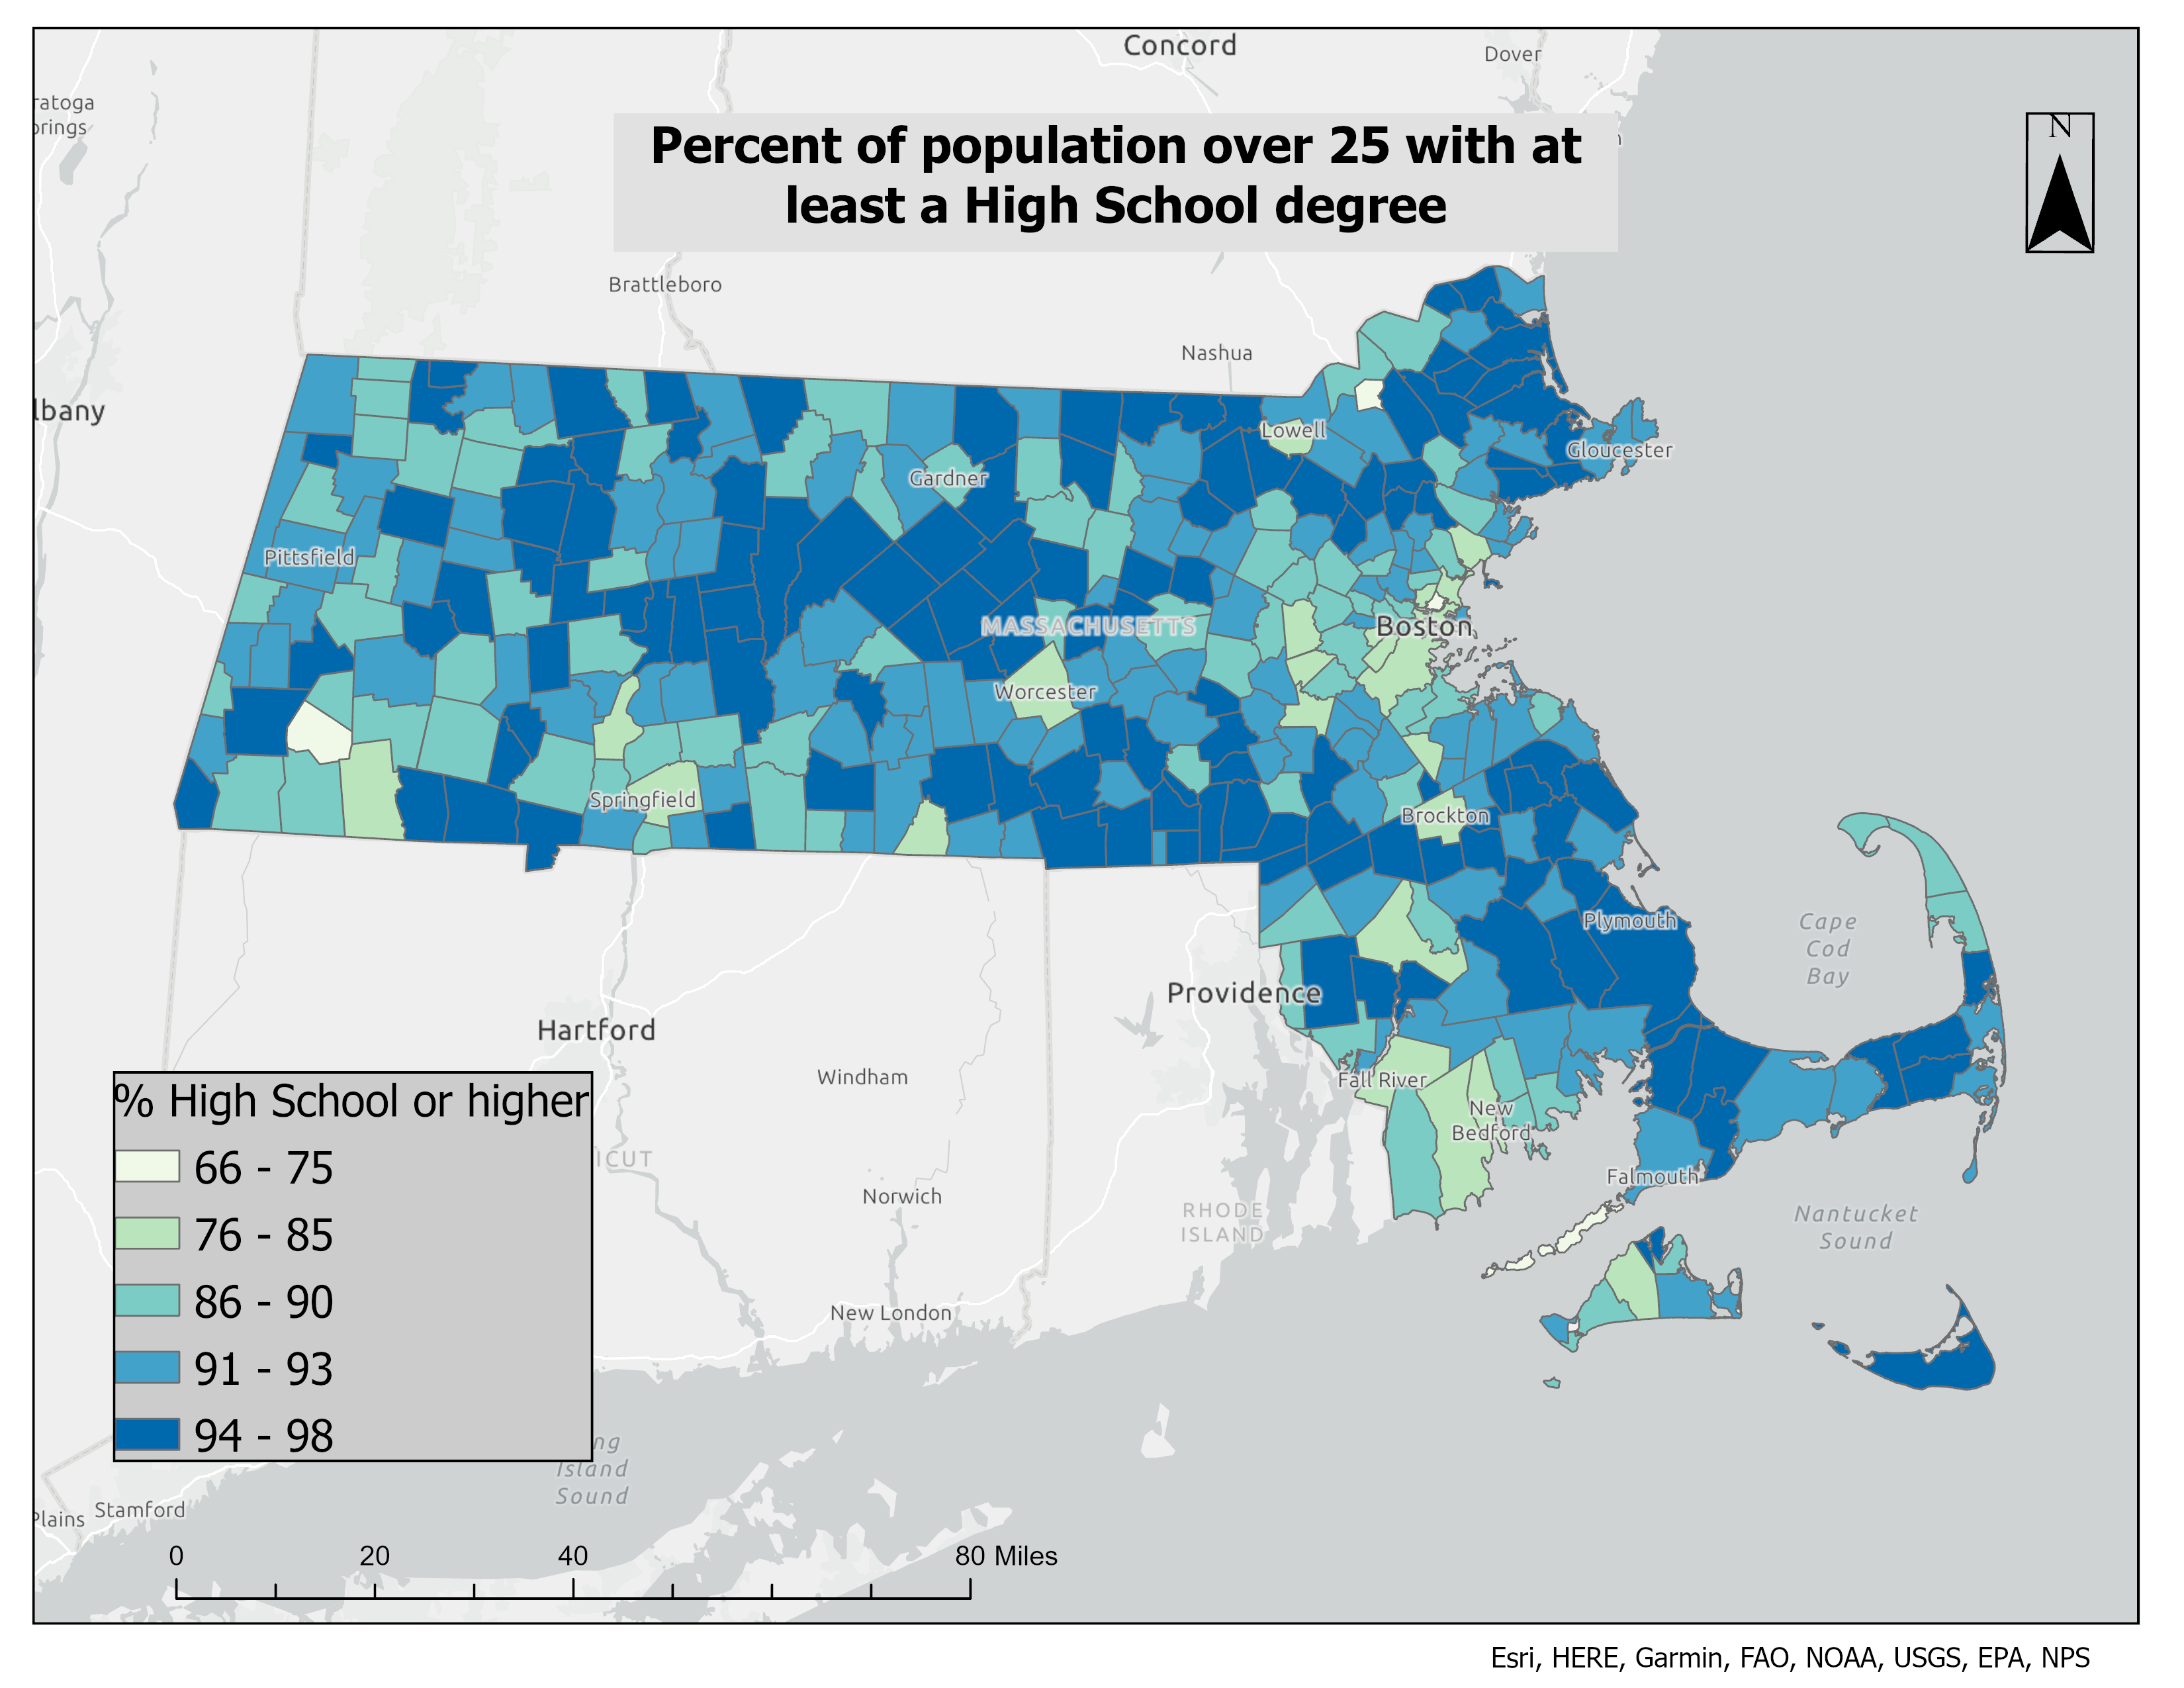
MA: ≥ HS Degree
MA: % with High School Degree or Higher
% over 25 with a HS degree or higher, MA towns.
ArcGIS Pro
Choropleth
Census ACS
Education
Manchester (Dense Footprint)
Manchester, NH — Landsat False-Color NIR (Dense Footprint)
Landsat false-color NIR over Manchester, NH — dense built core, little remaining vegetation.
Landsat 8/9
False Color NIR
Remote Sensing
Granite State
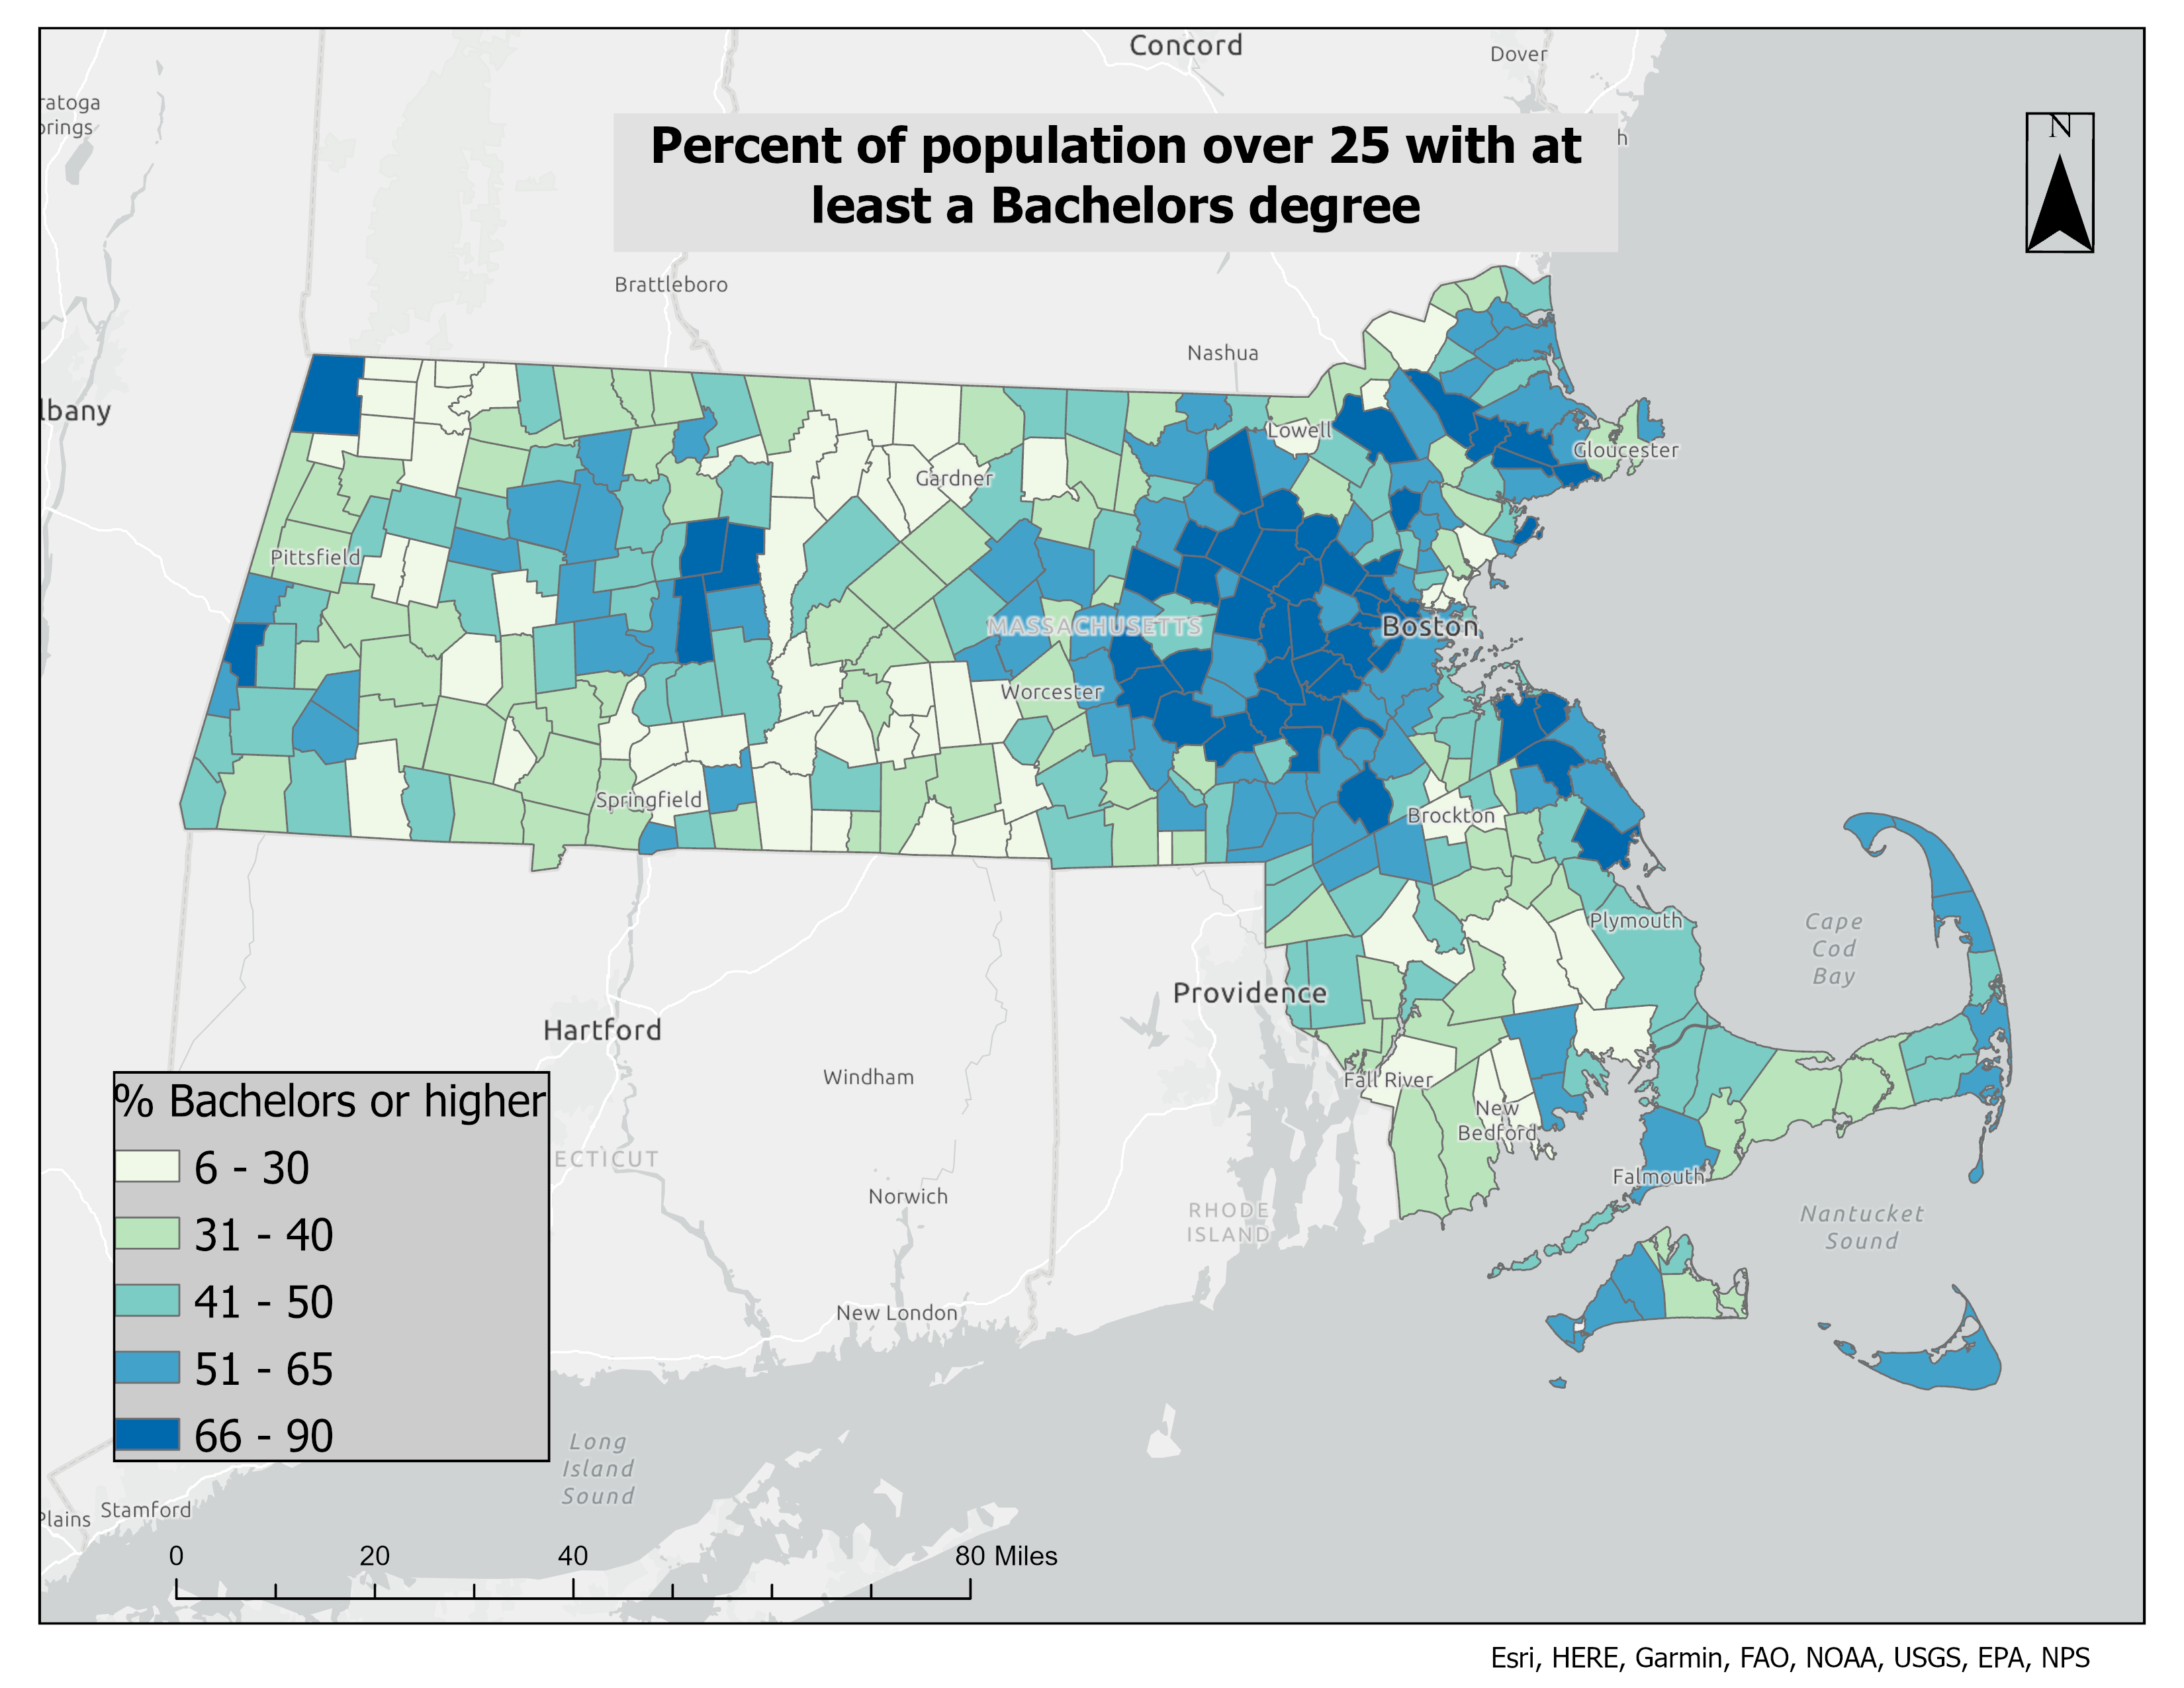
MA: ≥ Bachelor's
MA: % with a Bachelor's Degree or Higher
% over 25 with bachelor's or higher, MA towns.
ArcGIS Pro
Choropleth
Census ACS
Education
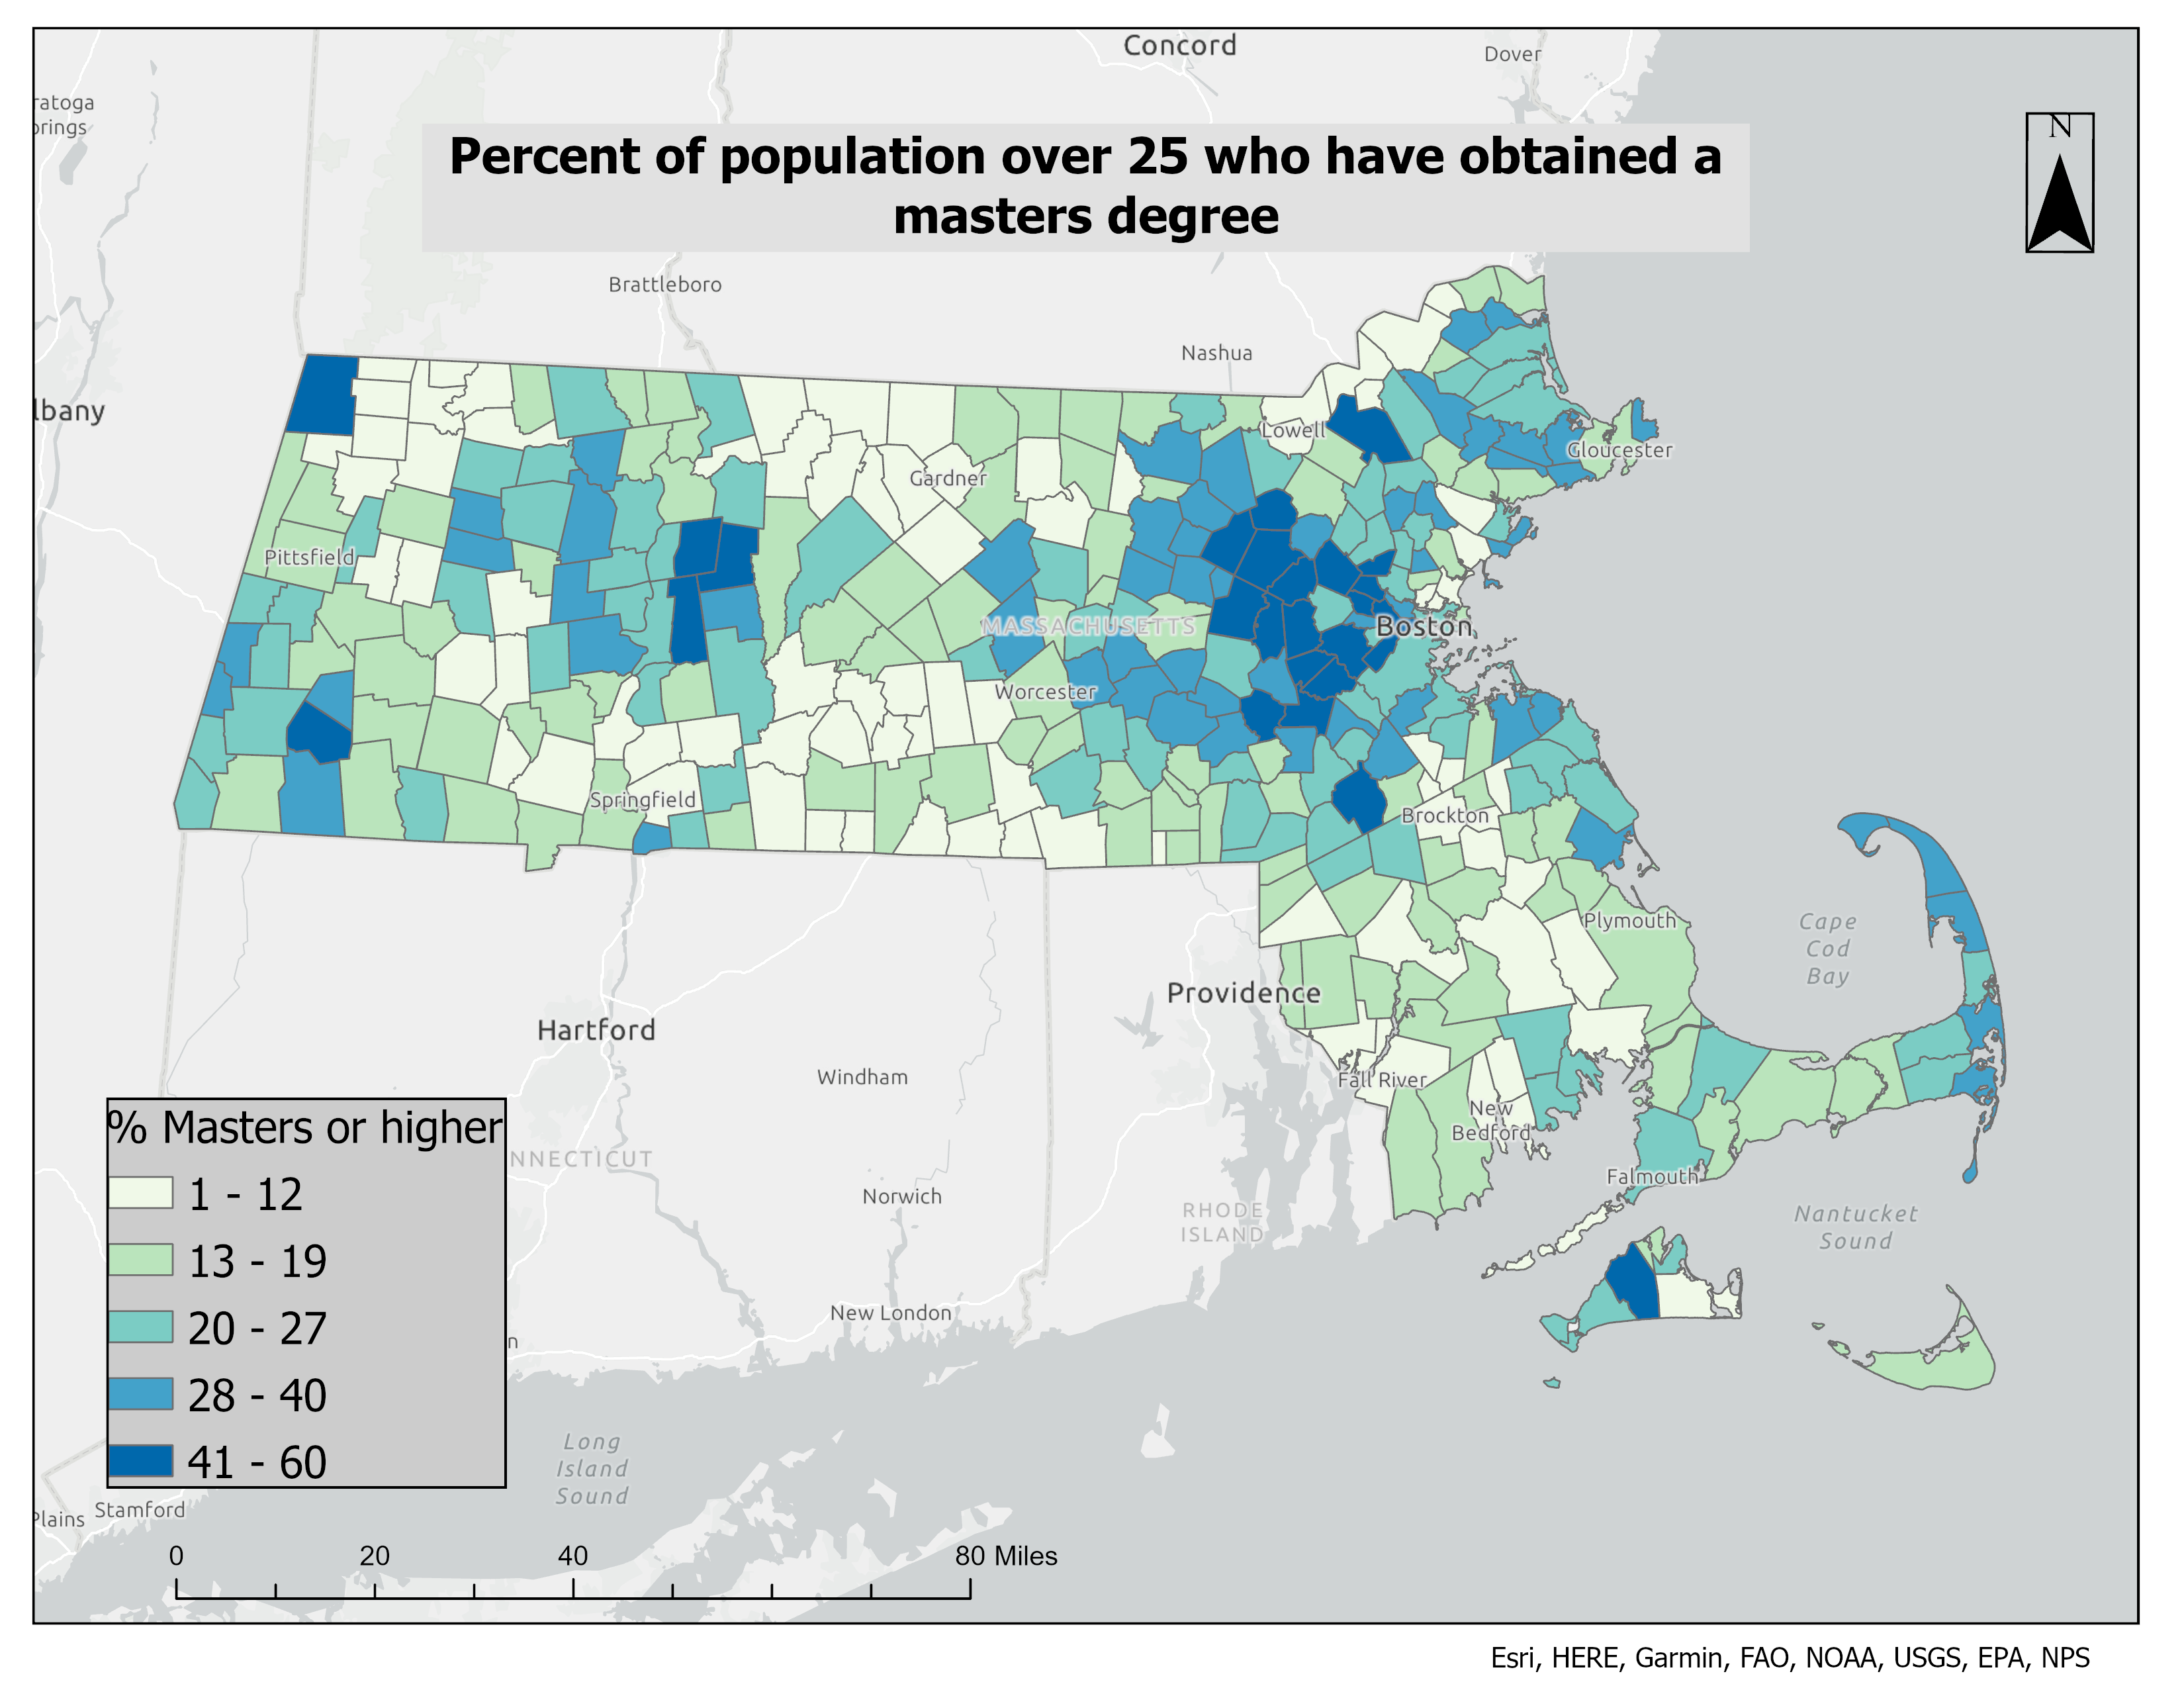
MA: ≥ Master's
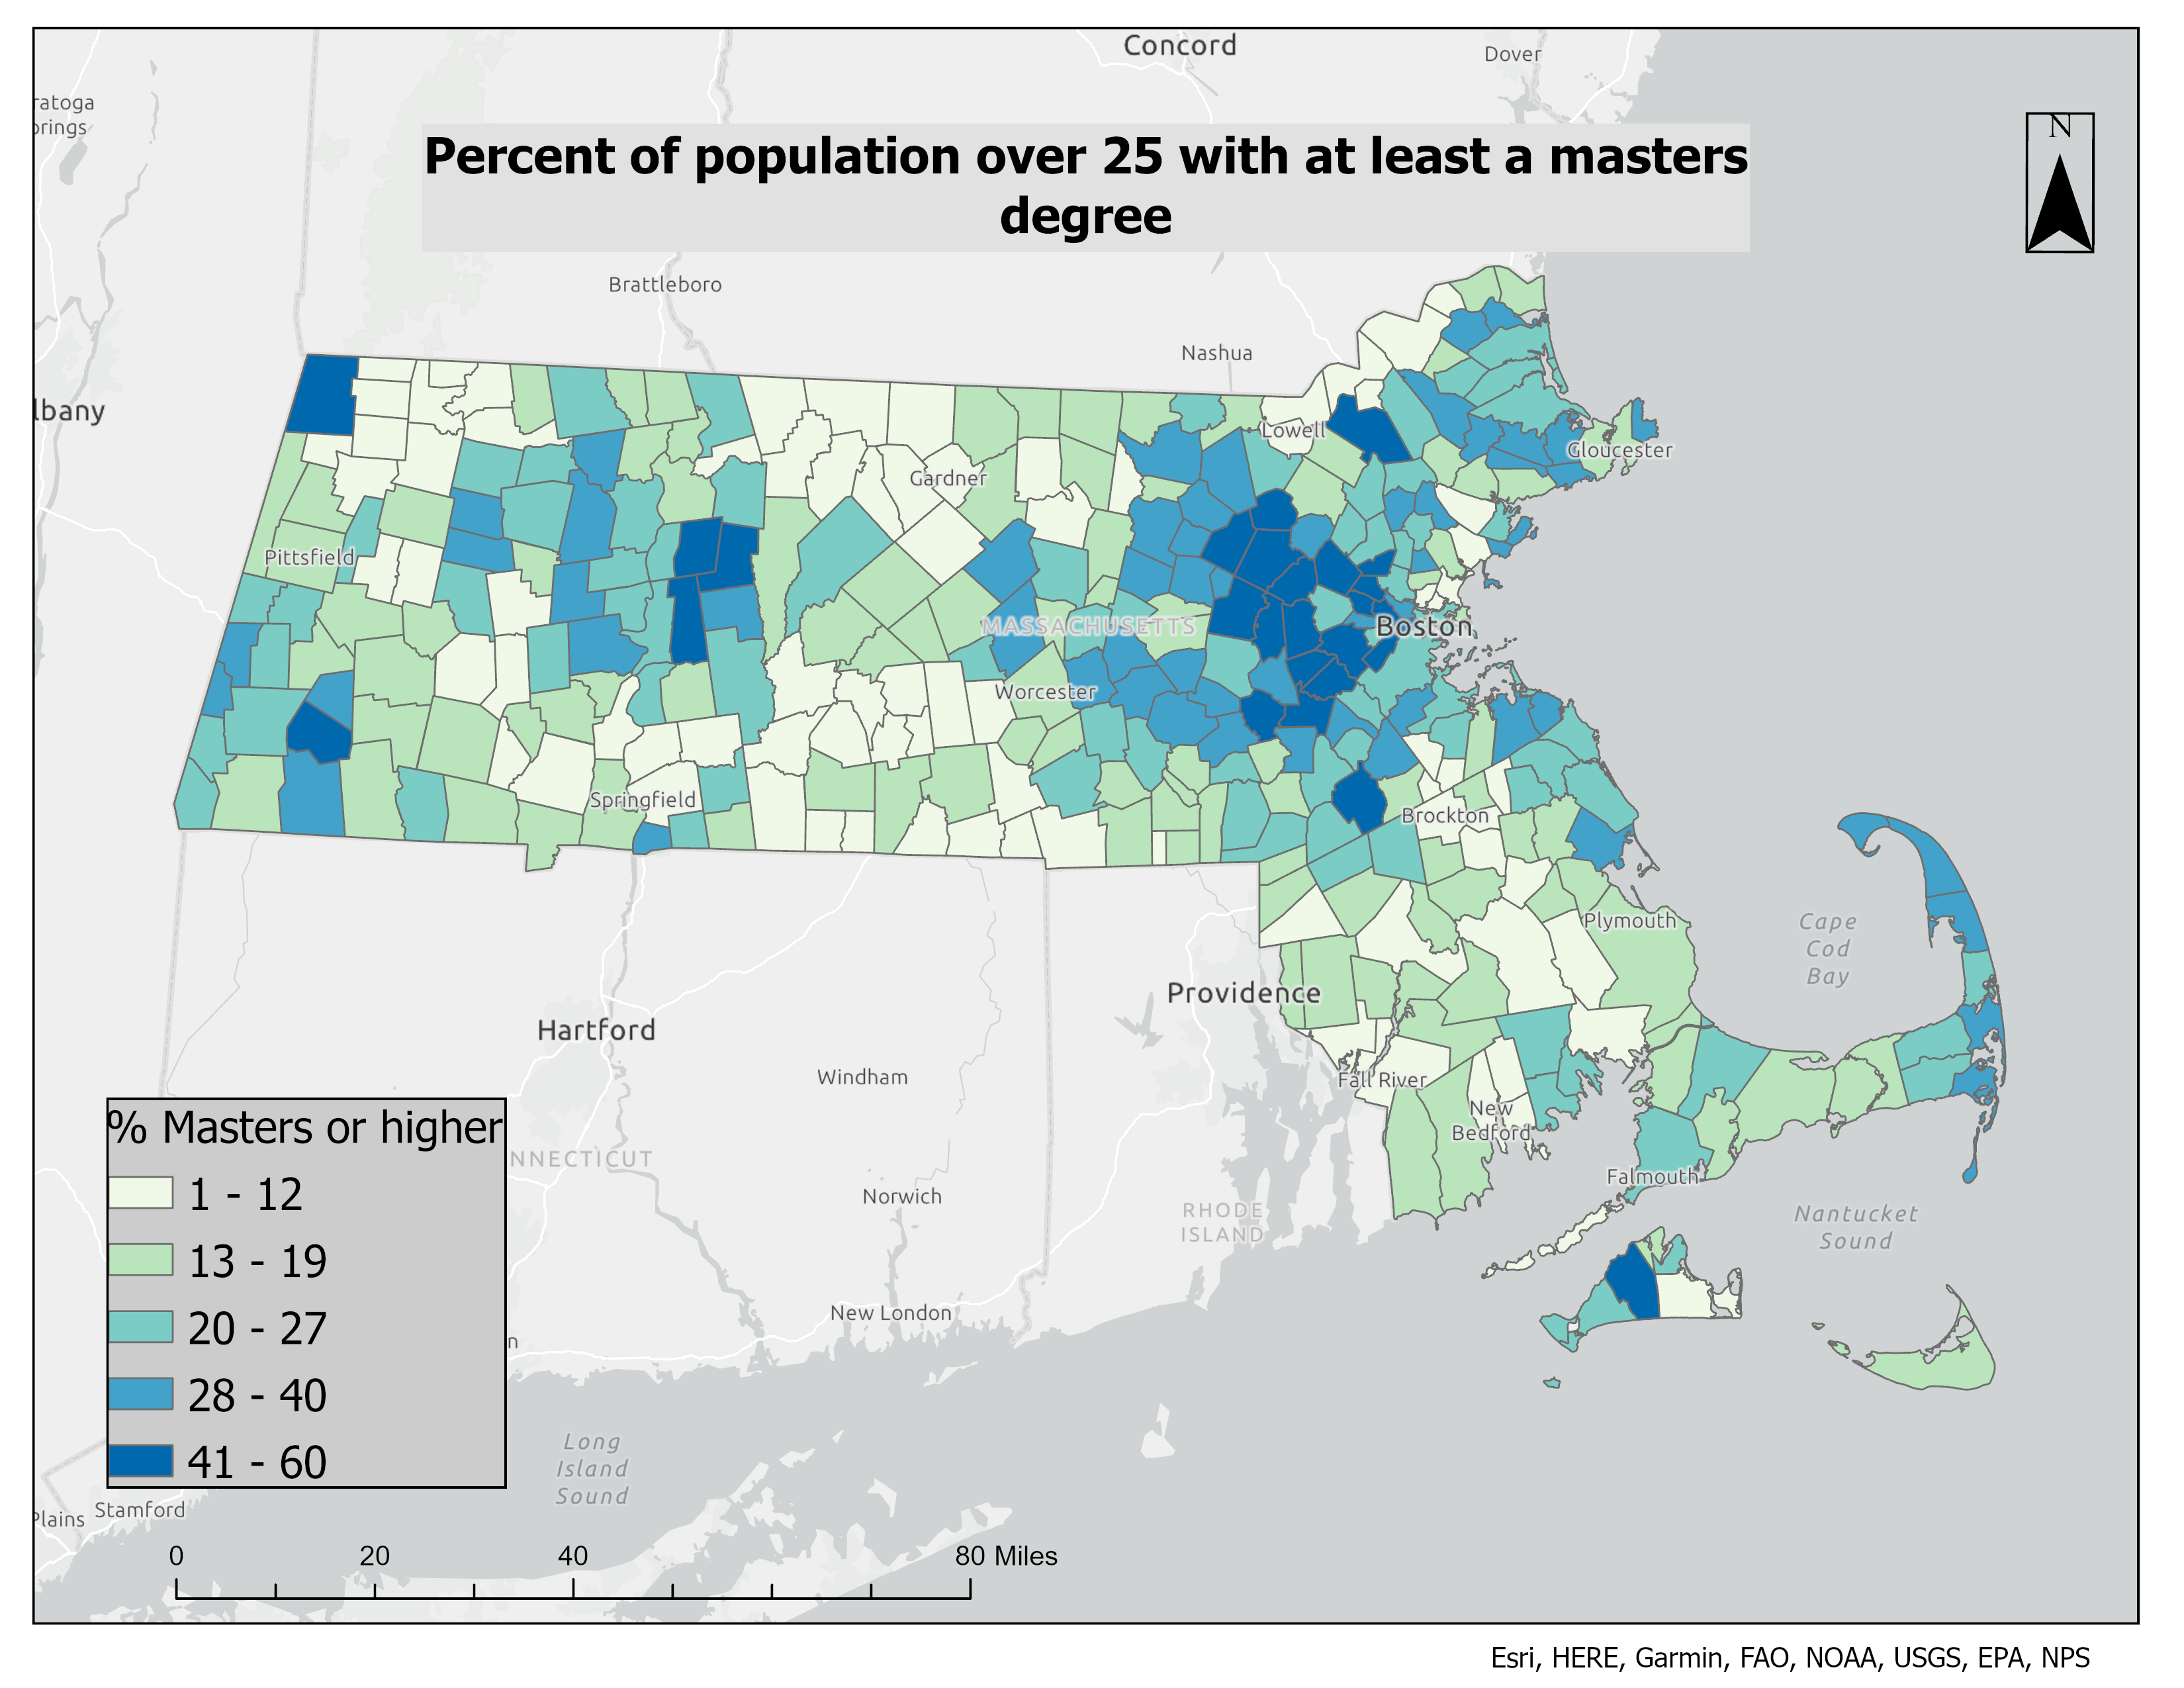
MA: % with a Master's Degree or Higher
% over 25 with master's or higher, MA towns.
ArcGIS Pro
Choropleth
Census ACS
Education
Concord (Detail)
Concord, NH — Landsat False-Color (Detail)
Tighter Landsat false-color NIR over Concord, NH — neighborhoods and open pockets resolvable.
Landsat 8/9
False Color NIR
Remote Sensing
Granite State
MA: ≥ Doctorate
MA: % with a Doctorate-Level Degree
% over 25 with a doctoral-level degree, MA towns.
ArcGIS Pro
Choropleth
Census ACS
Education
MA: PhD
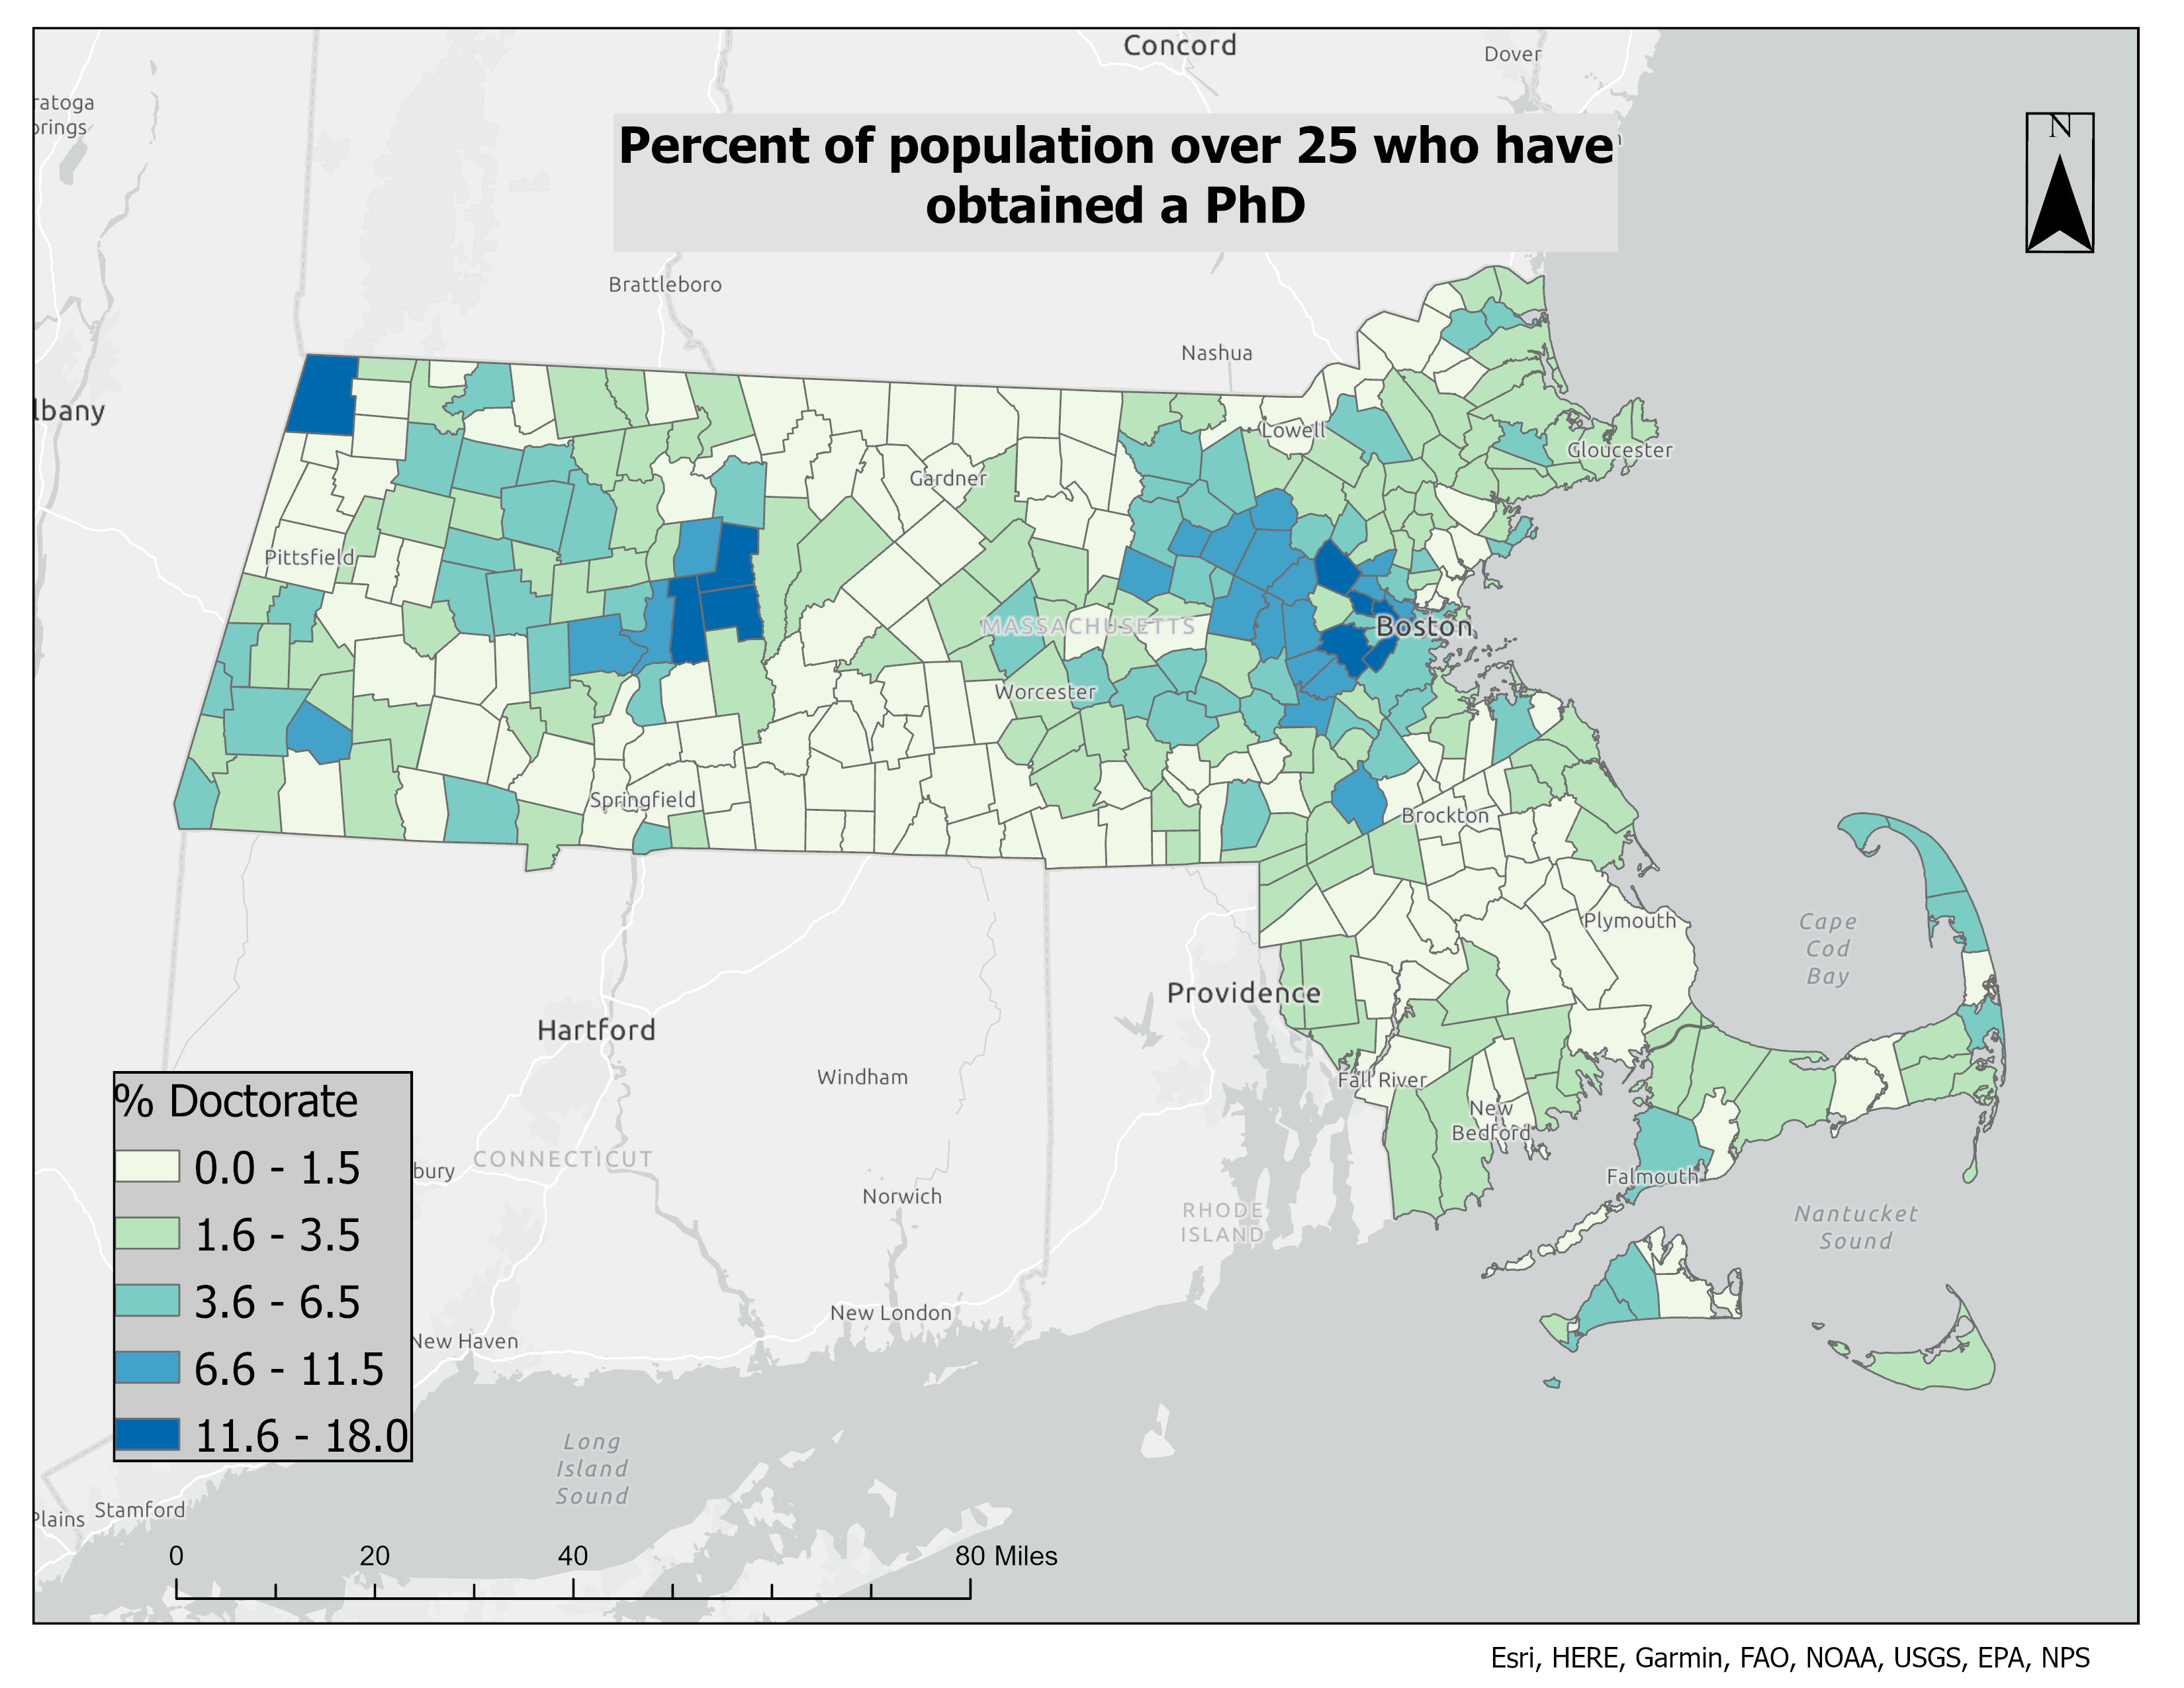
MA: % with a PhD
% over 25 with a PhD, MA towns.
ArcGIS Pro
Choropleth
Census ACS
Education
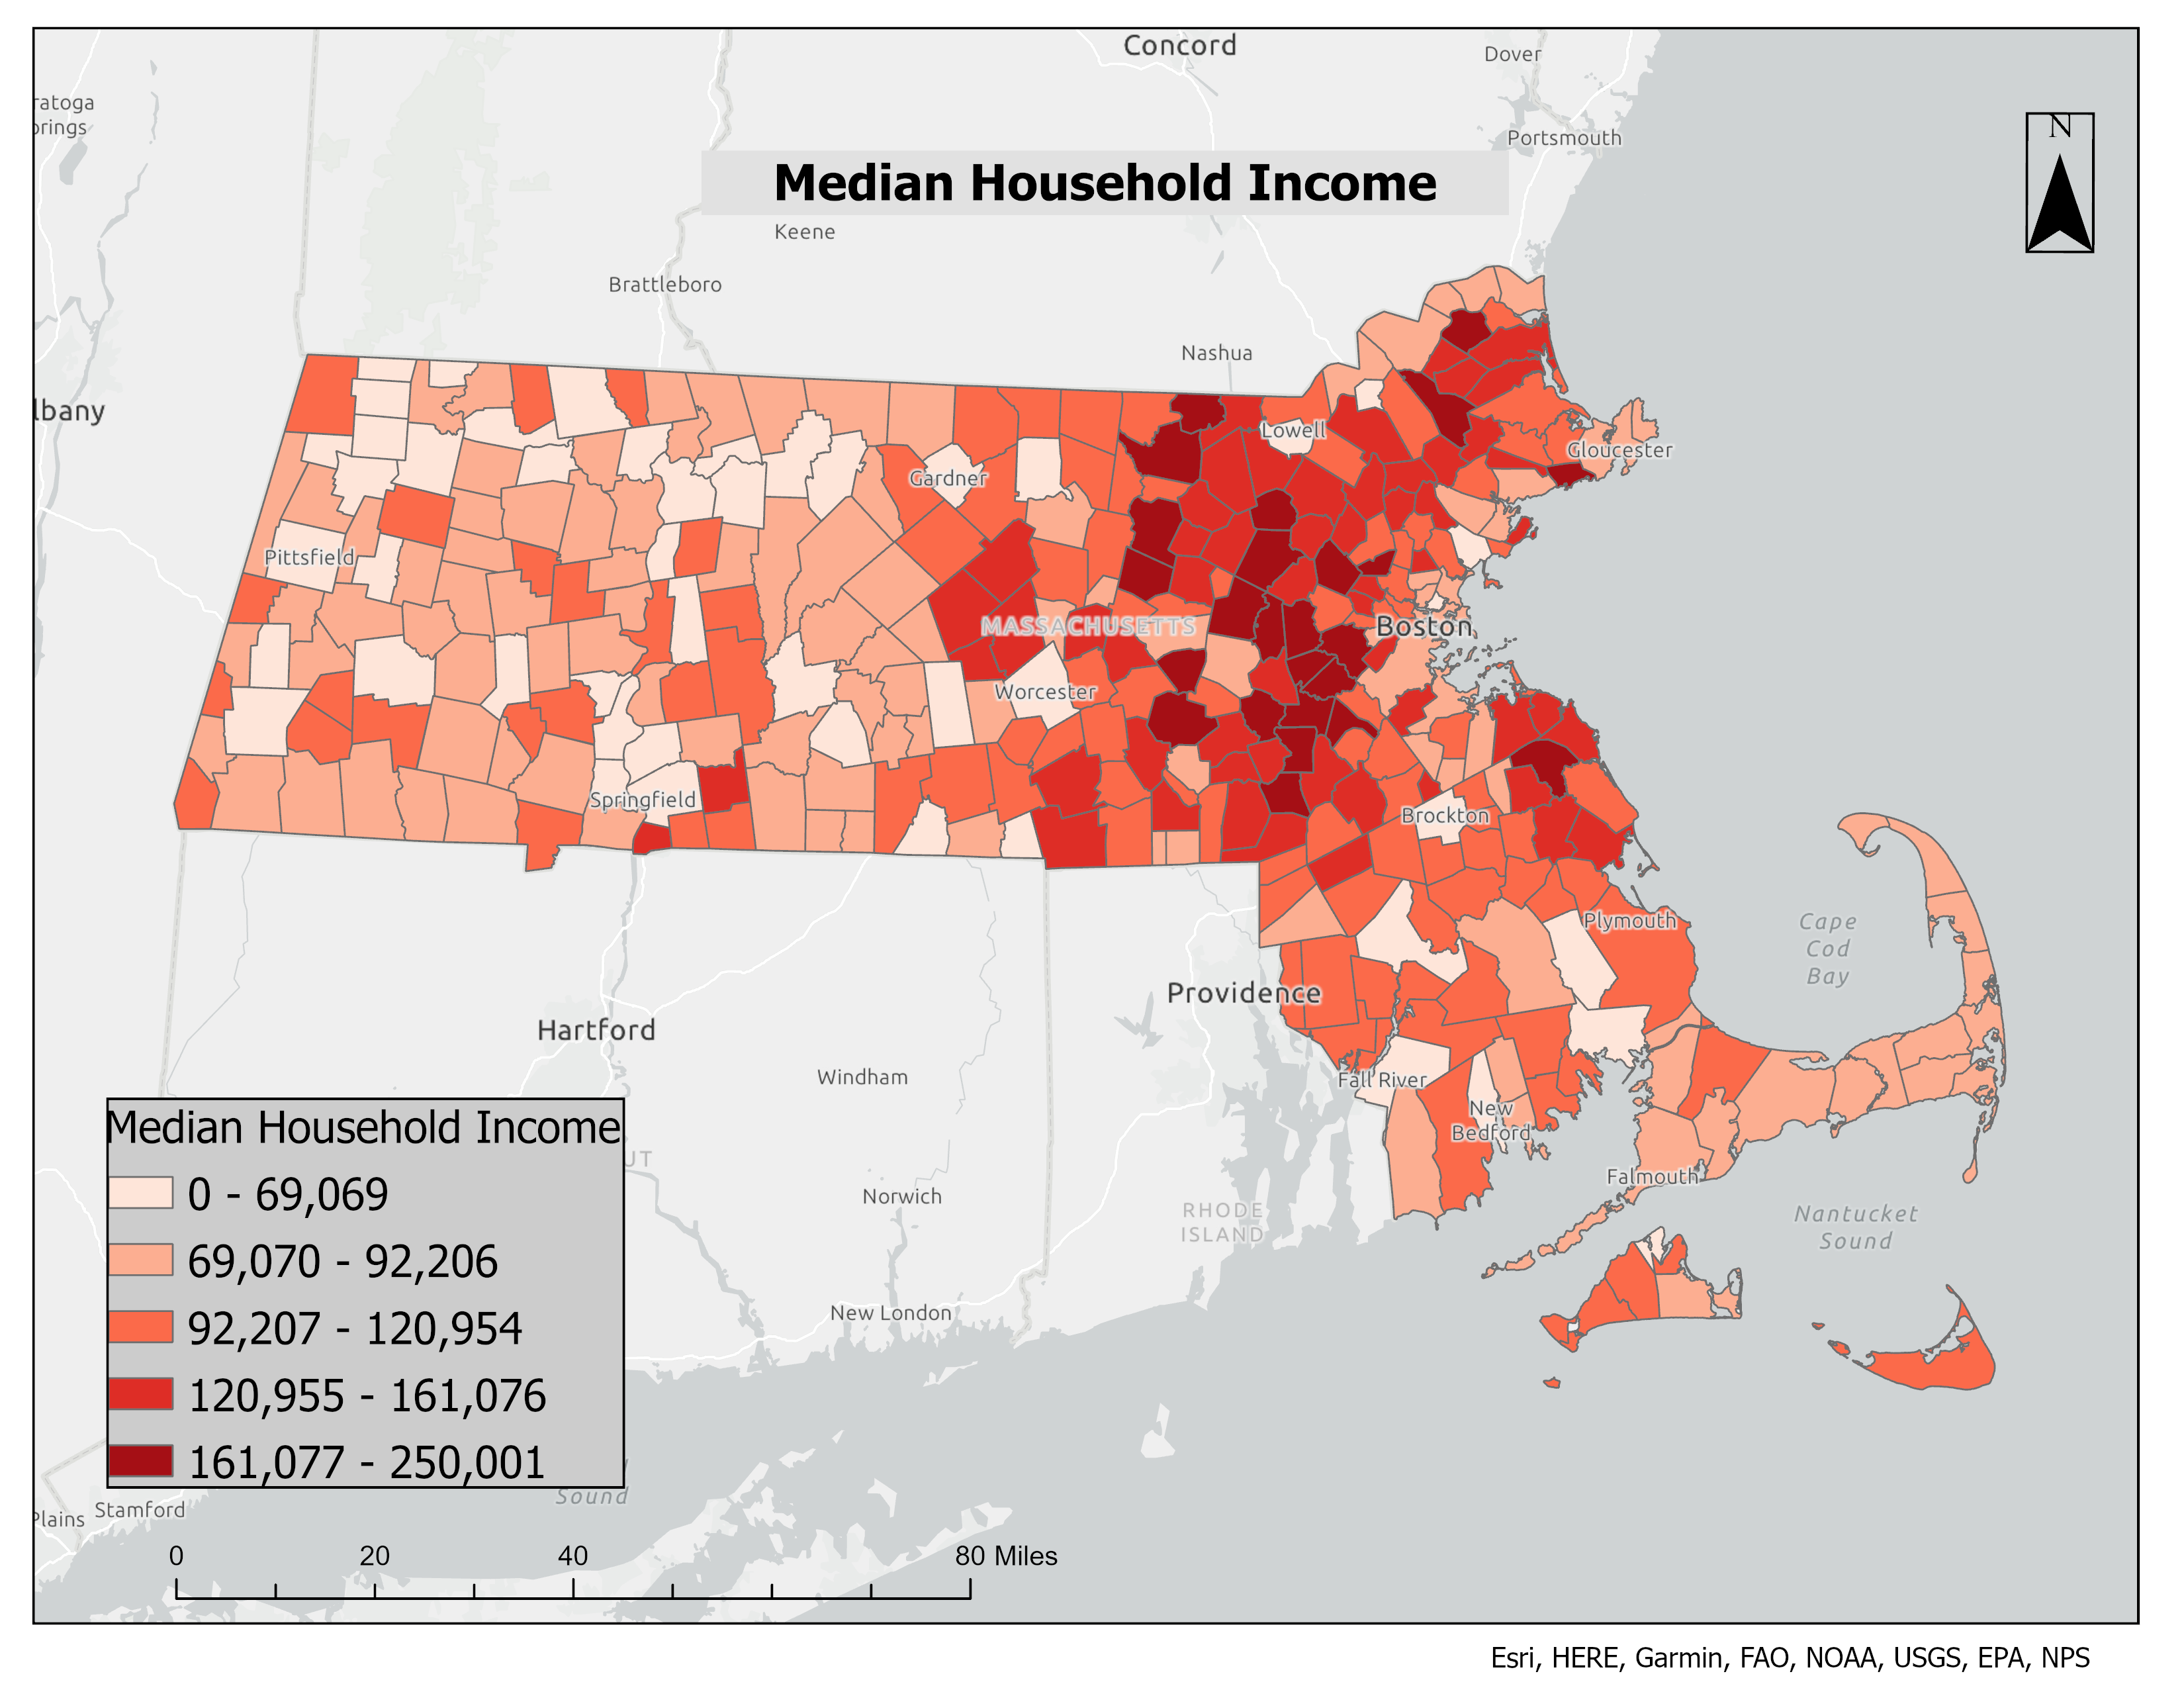
MA: Median Income
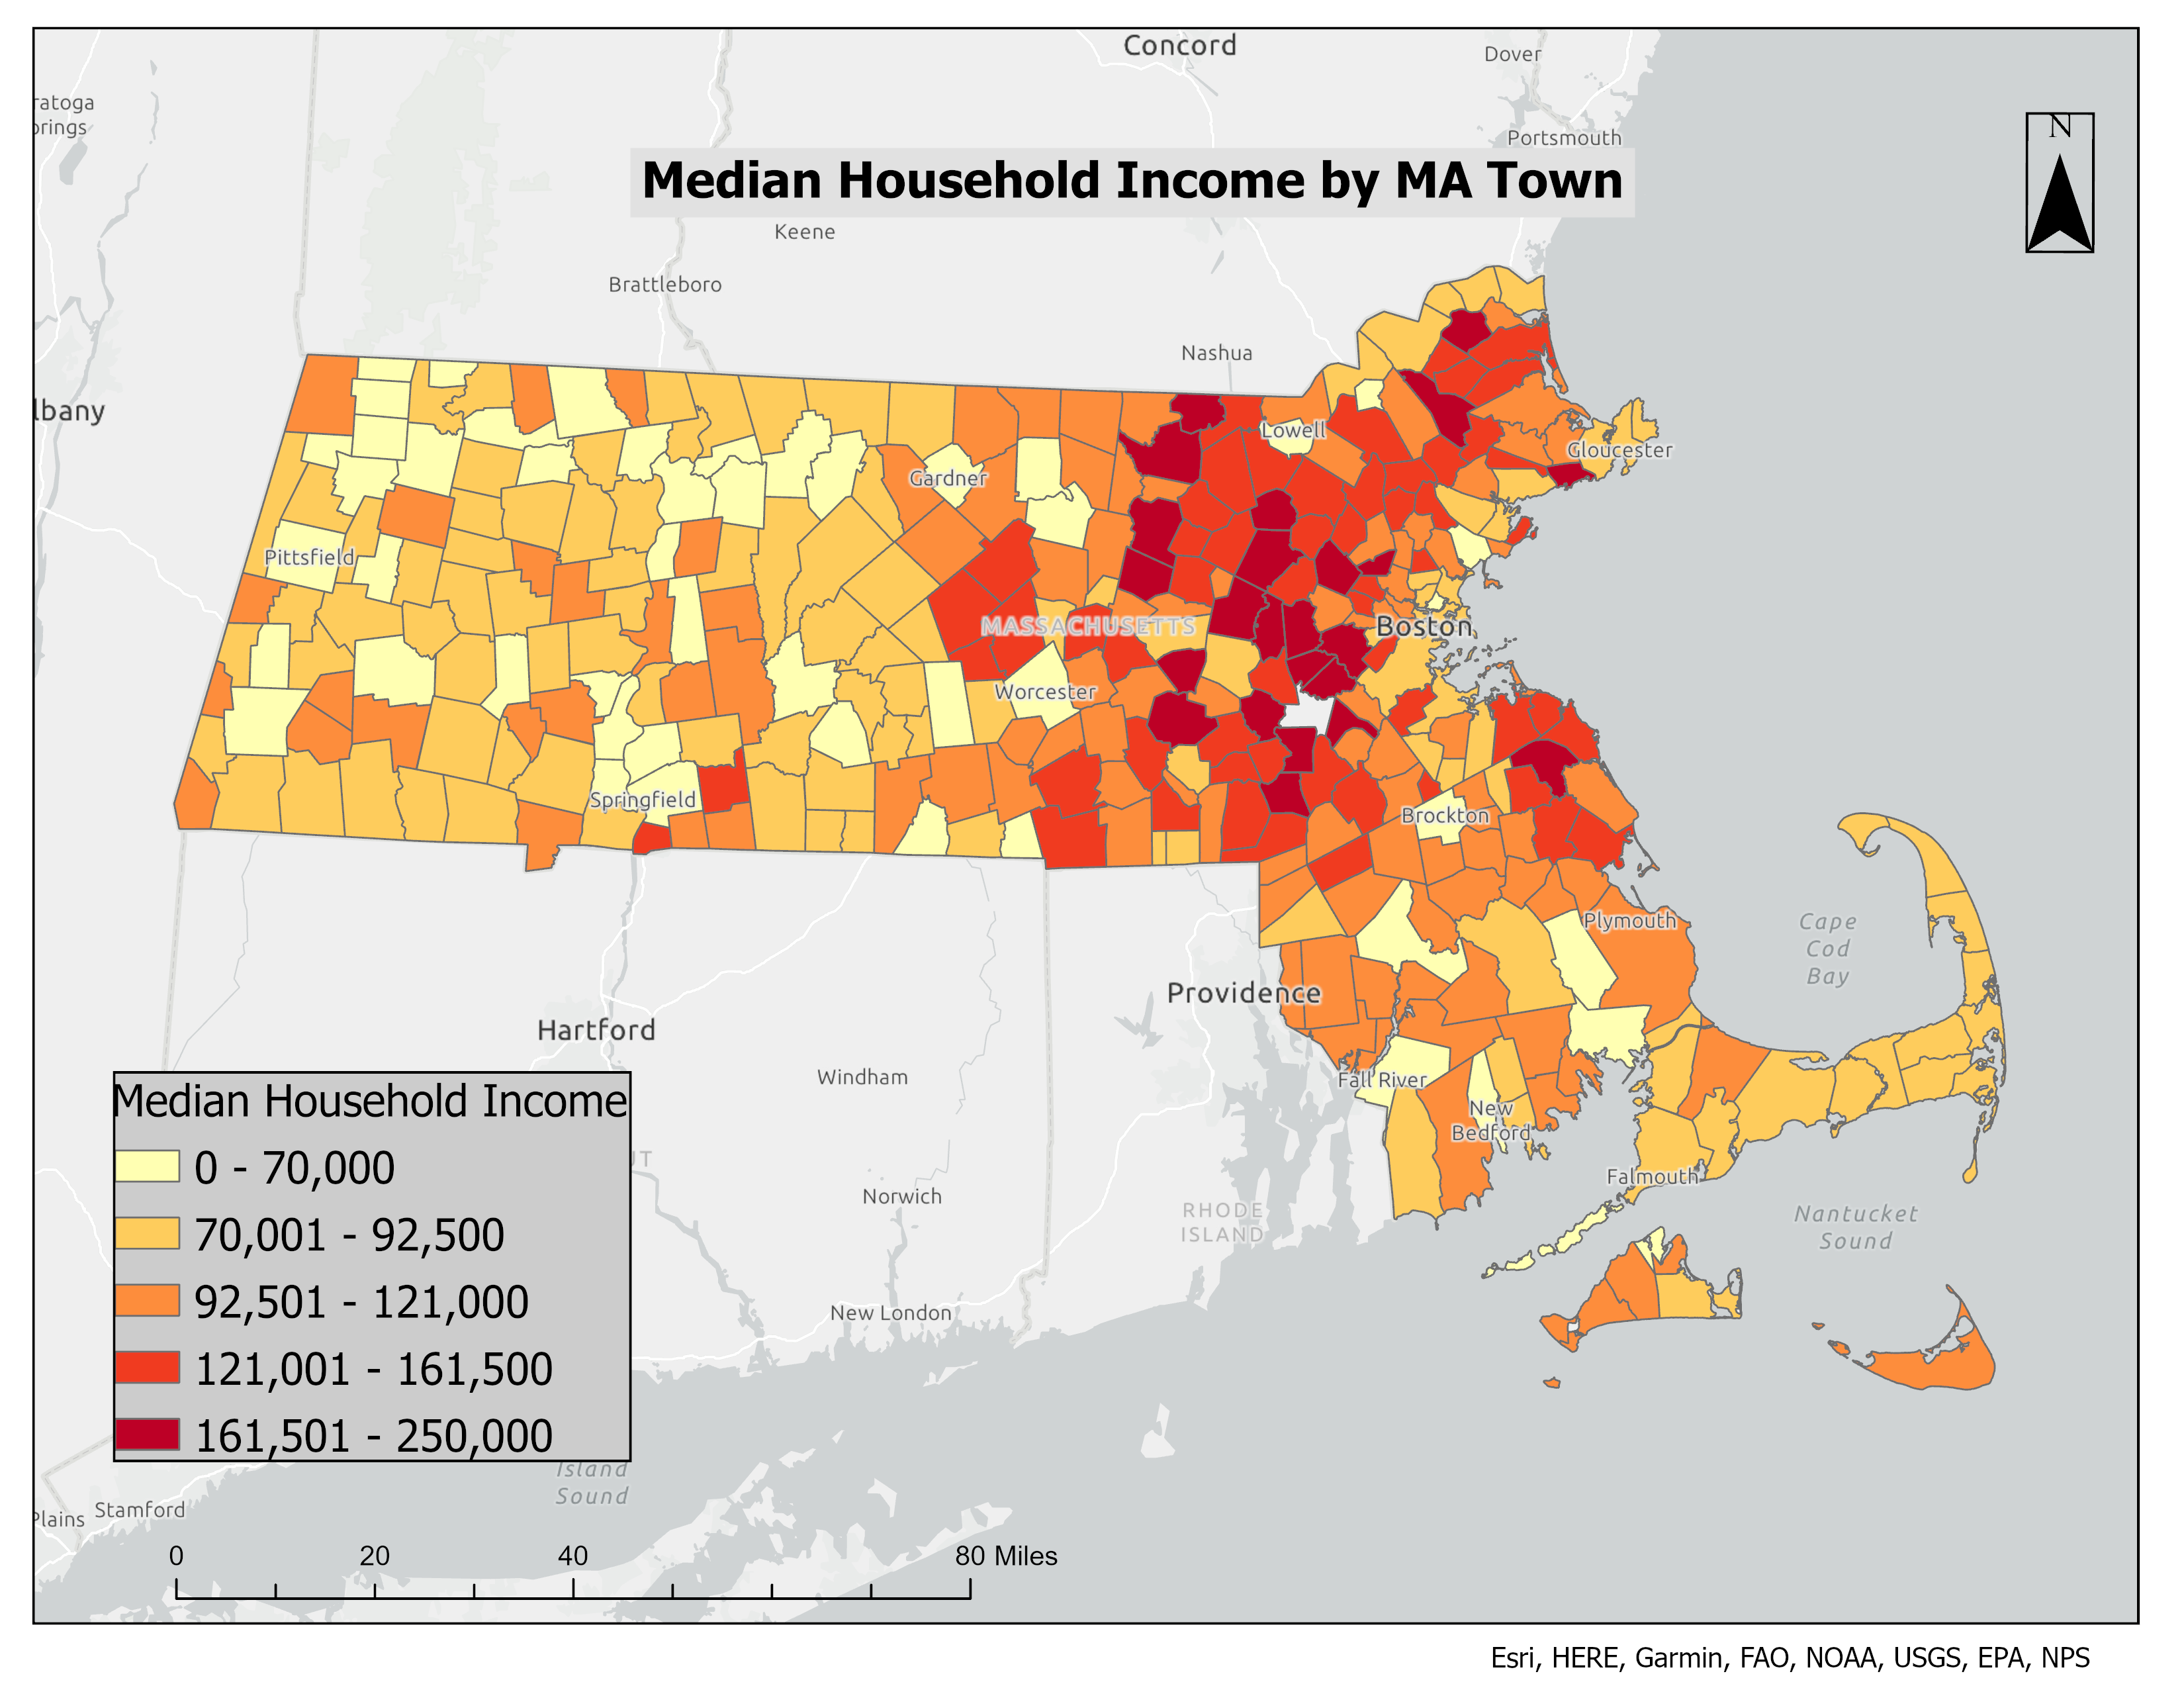
MA: Median Household Income by Town
Median household income by MA town, 5-class choropleth.
ArcGIS Pro
Choropleth
Census ACS
Income
Manchester (Urban Core)
Manchester, NH — Landsat False-Color (Urban Core)
Tight Landsat false-color NIR composite over Manchester's urban core.
Landsat 8/9
False Color NIR
Remote Sensing
Granite State
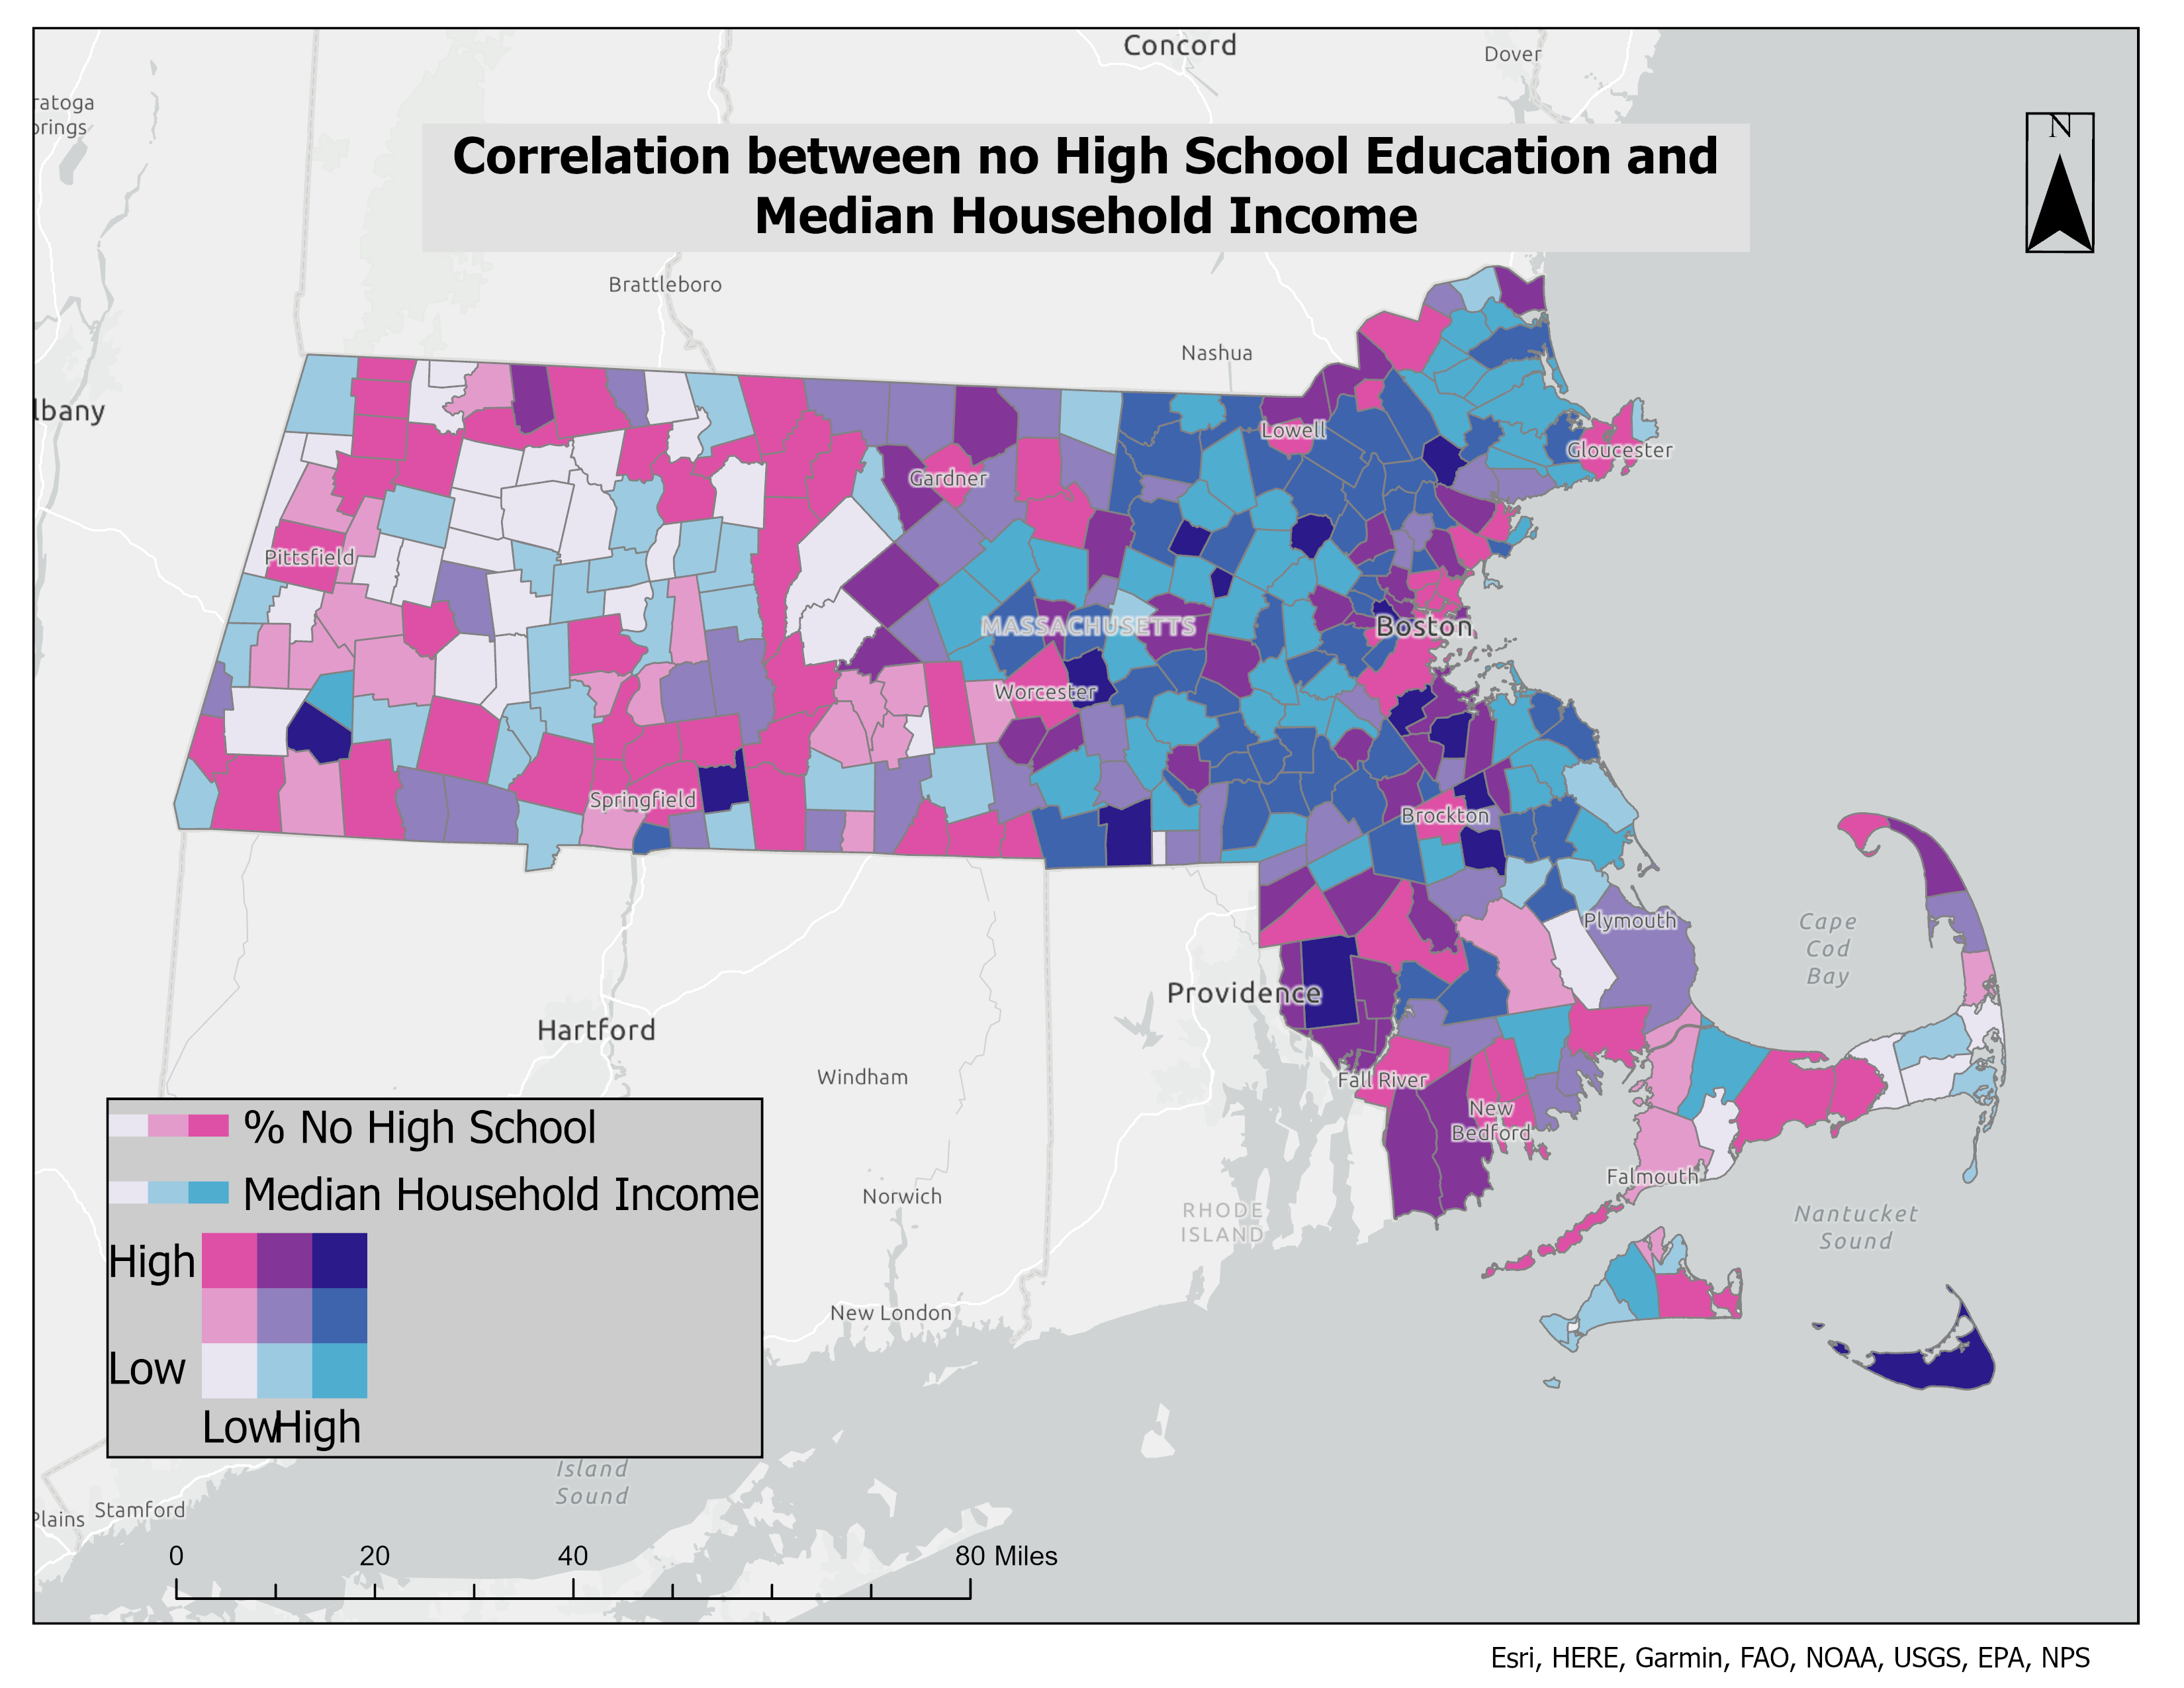
MA: No HS × Income
MA: No HS × Median Income (Bivariate)
Bivariate: % no HS × median income, MA towns.
ArcGIS Pro
Bivariate
Census ACS
Correlation
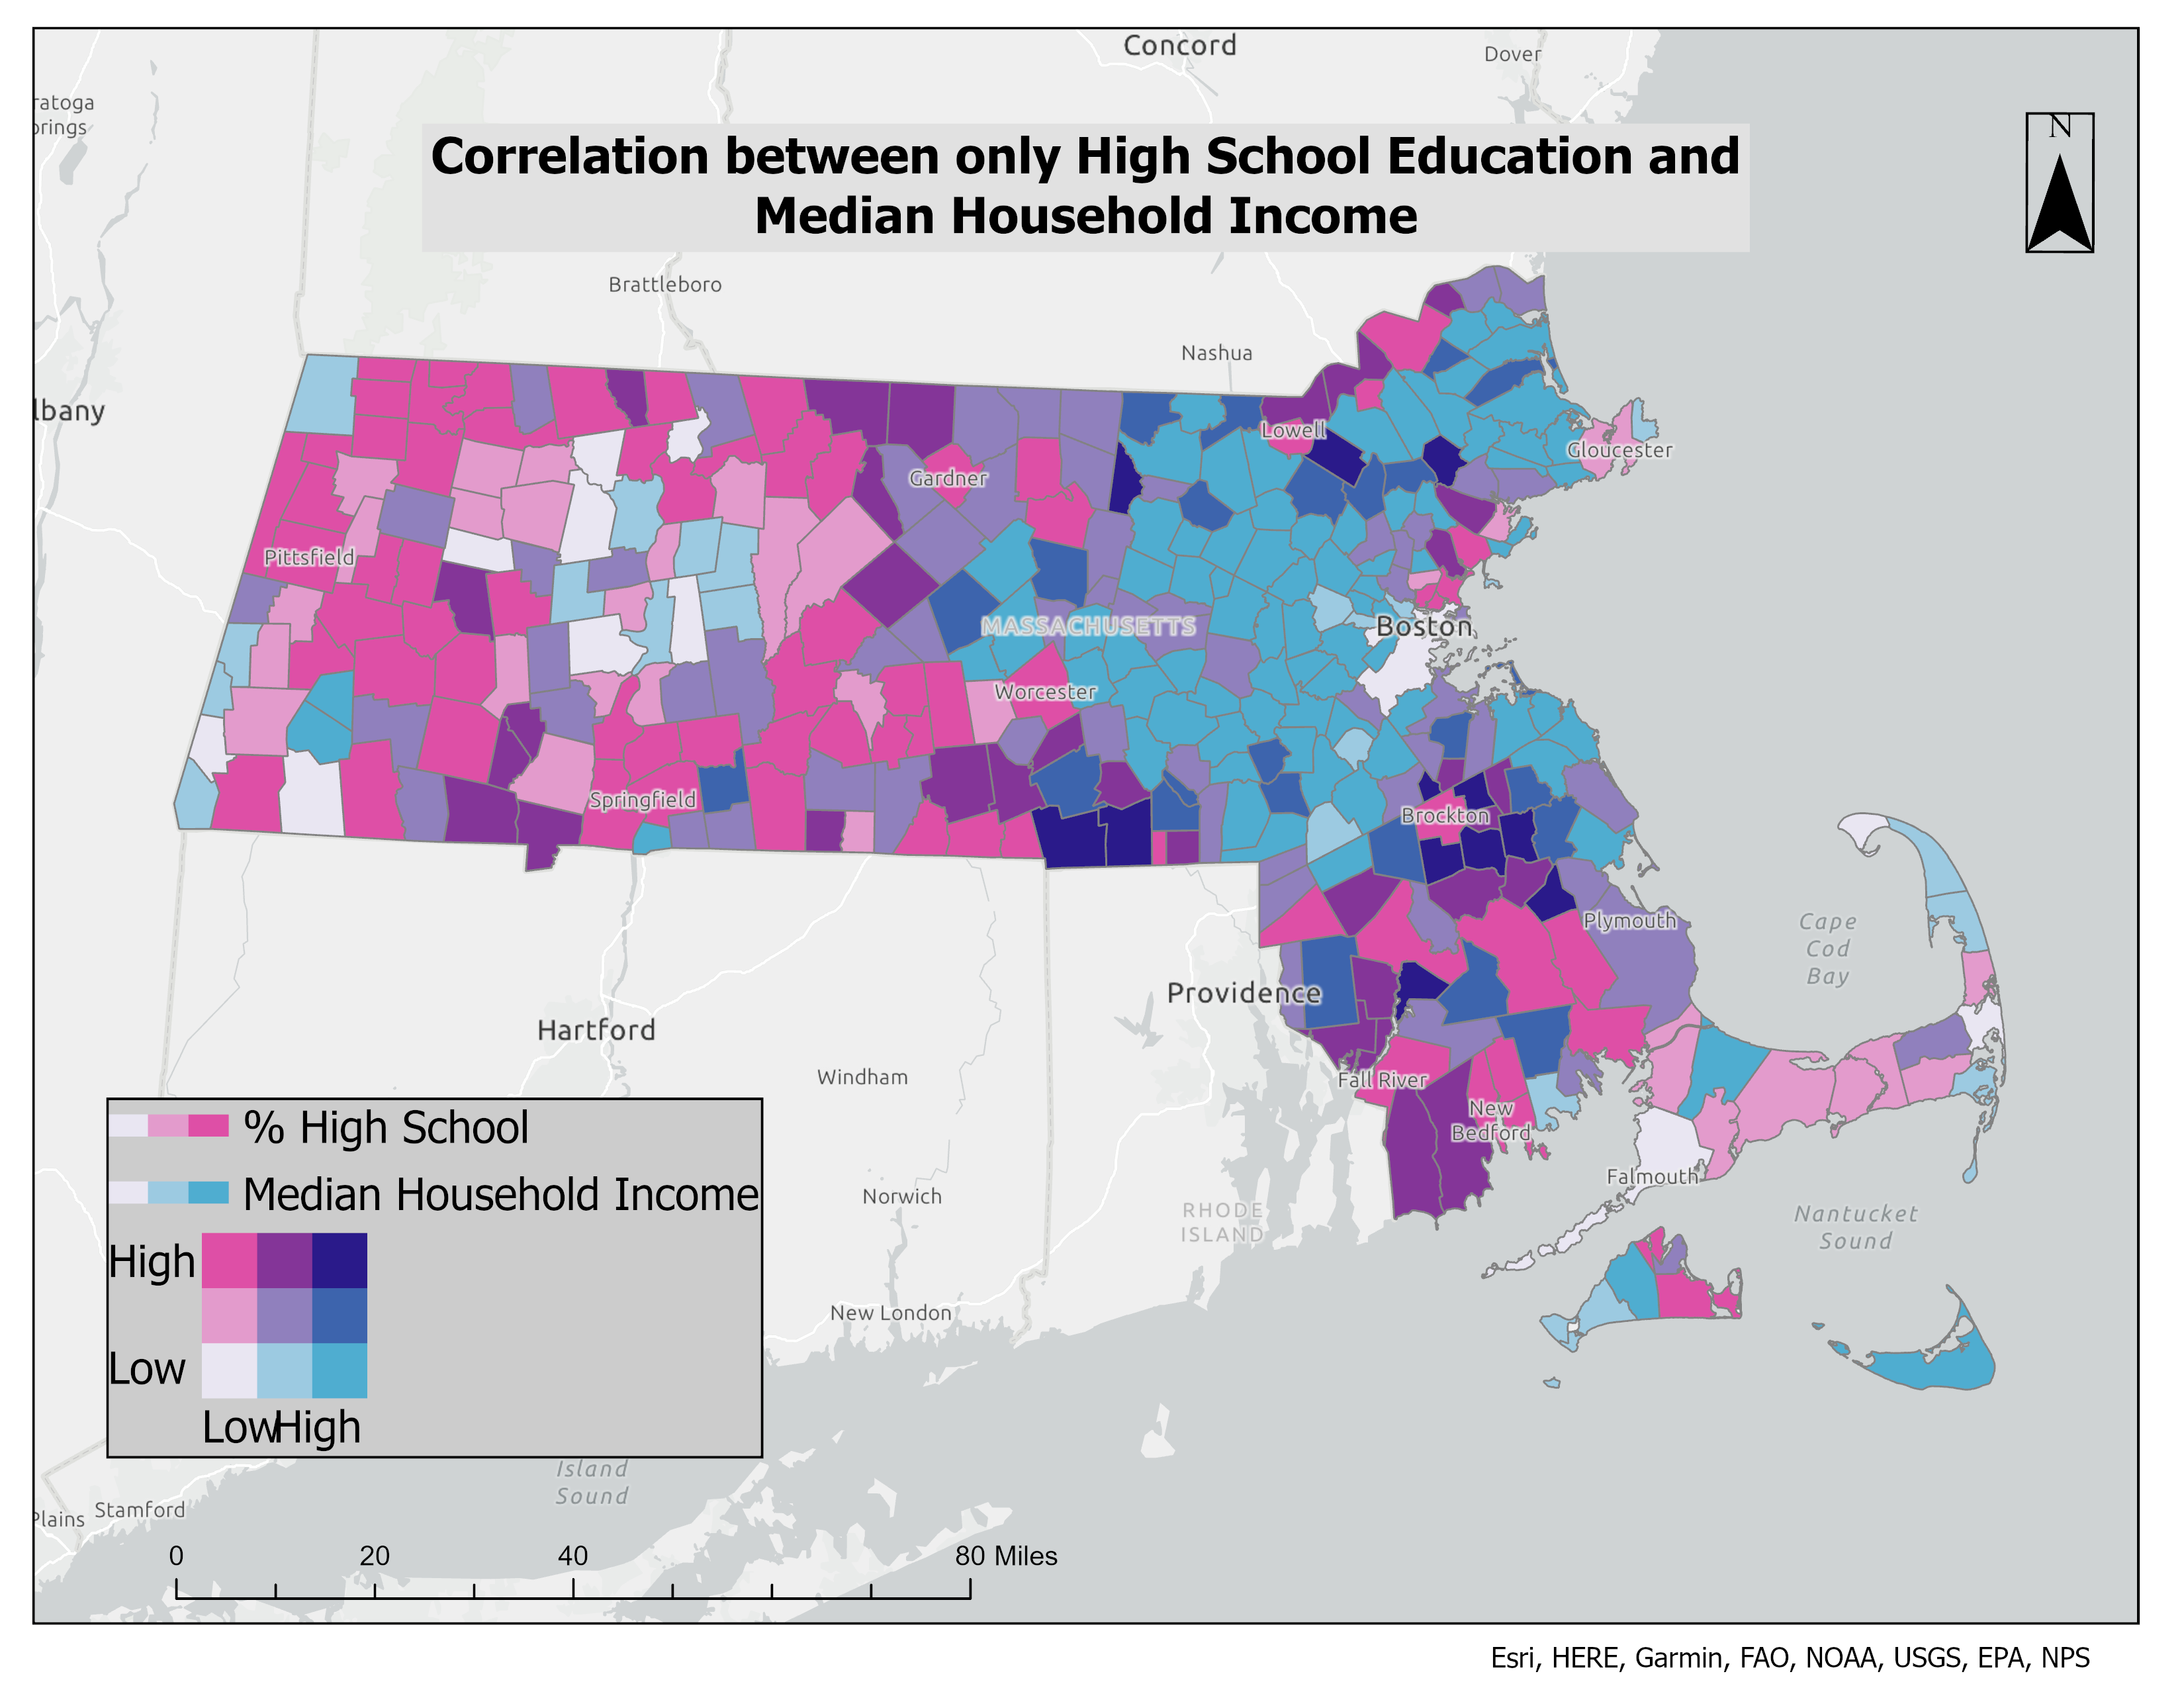
MA: HS-Only × Income
MA: HS-Only × Median Income (Bivariate)
Bivariate: % HS-only × median income, MA towns.
ArcGIS Pro
Bivariate
Census ACS
Correlation
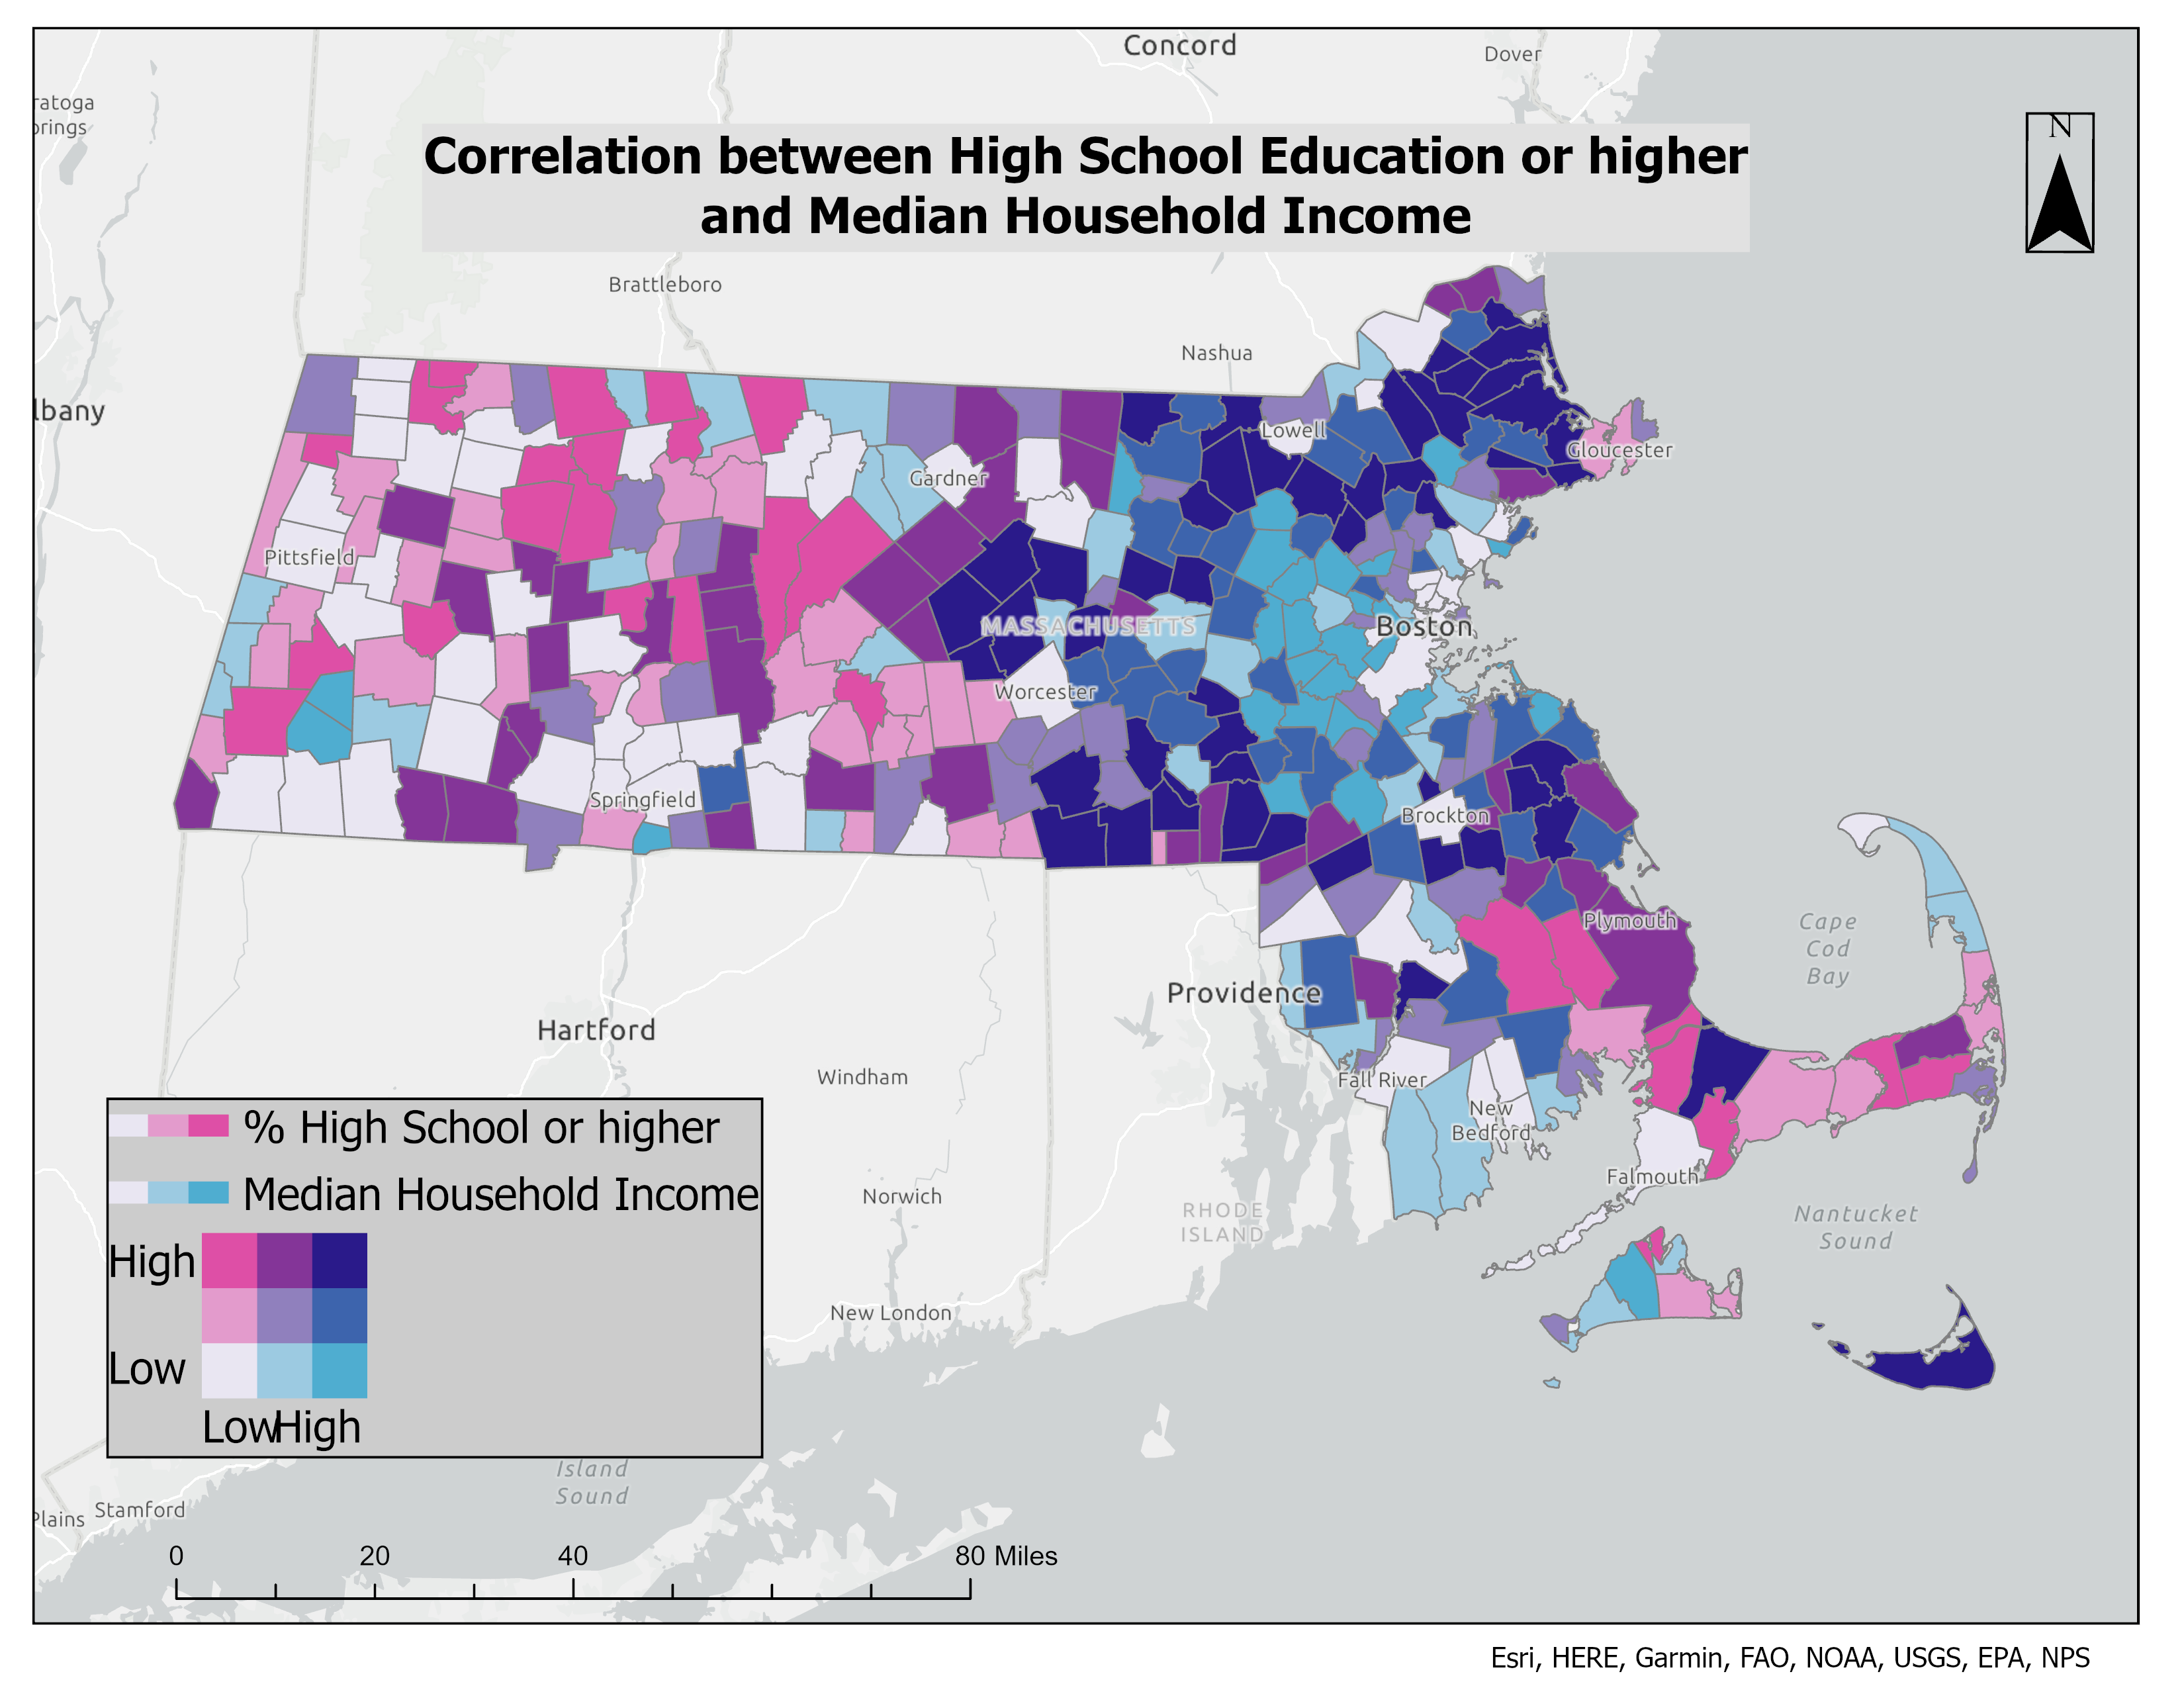
MA: ≥HS × Income
MA: HS-or-Higher × Median Income (Bivariate)
Bivariate: % ≥HS × median income, MA towns.
ArcGIS Pro
Bivariate
Census ACS
Correlation
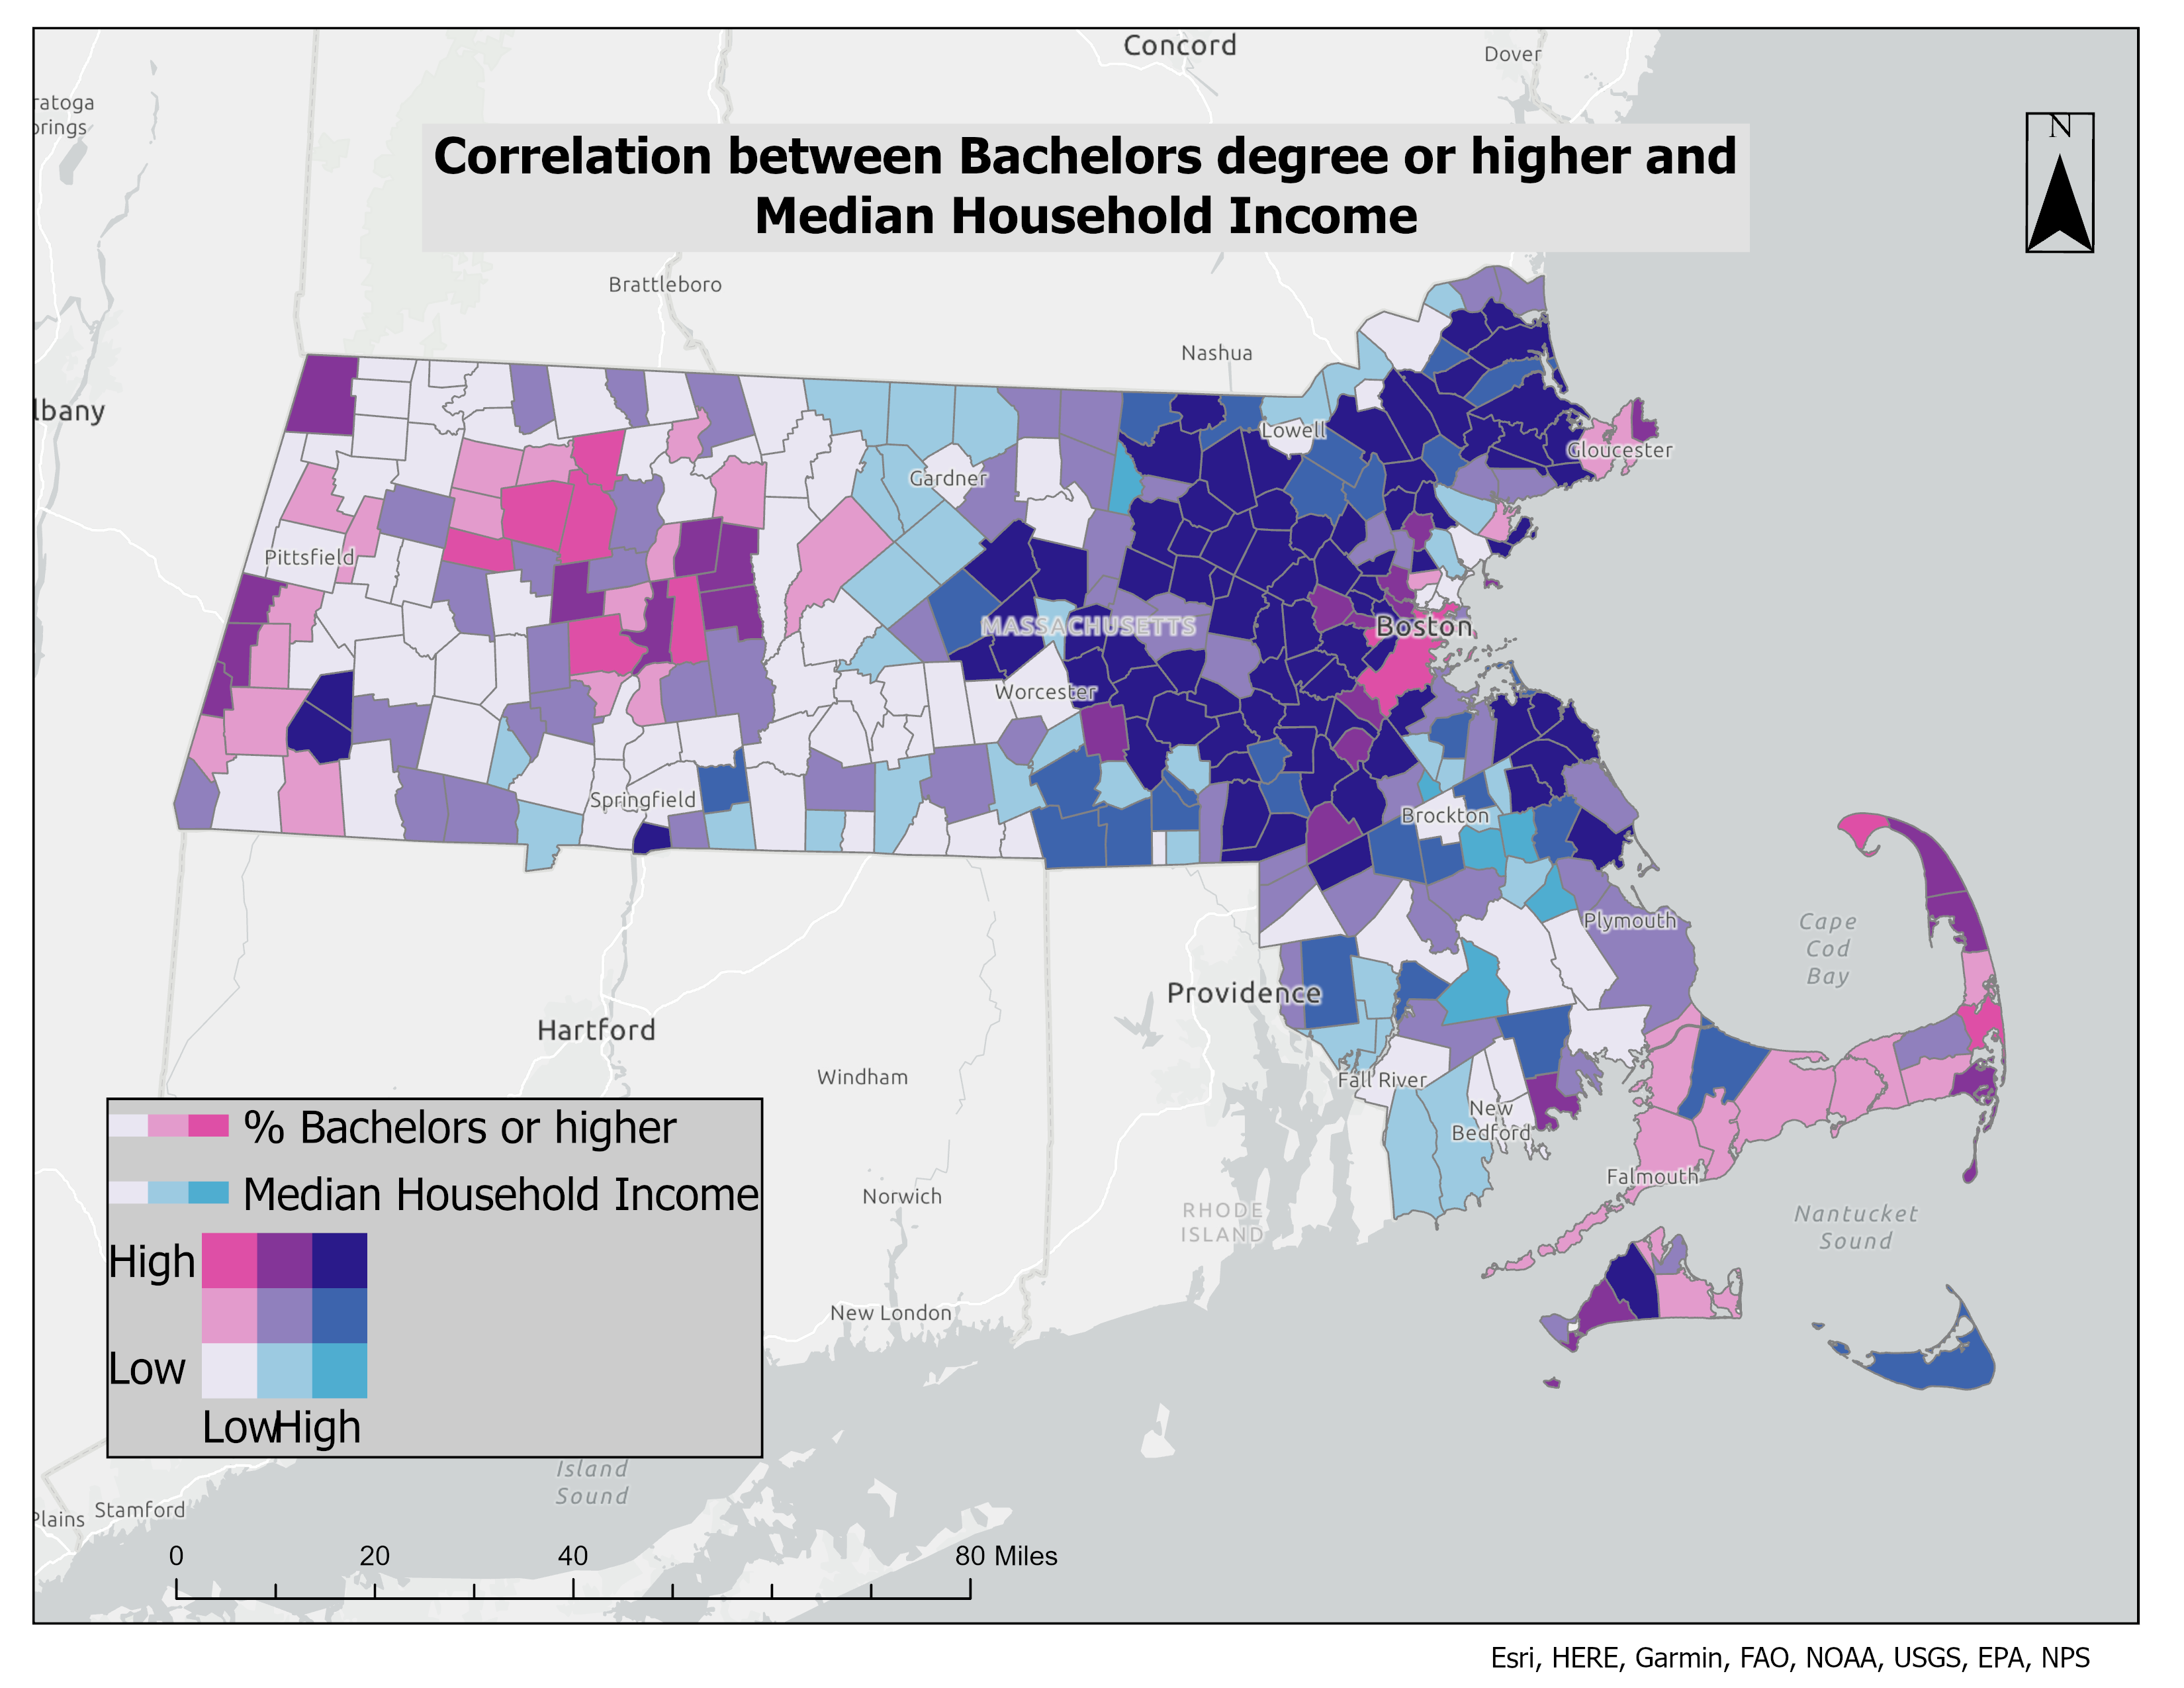
MA: ≥Bachelor's × Income
MA: Bachelor's-or-Higher × Median Income (Bivariate)
Bivariate: % ≥bachelor's × median income, MA towns.
ArcGIS Pro
Bivariate
Census ACS
Correlation
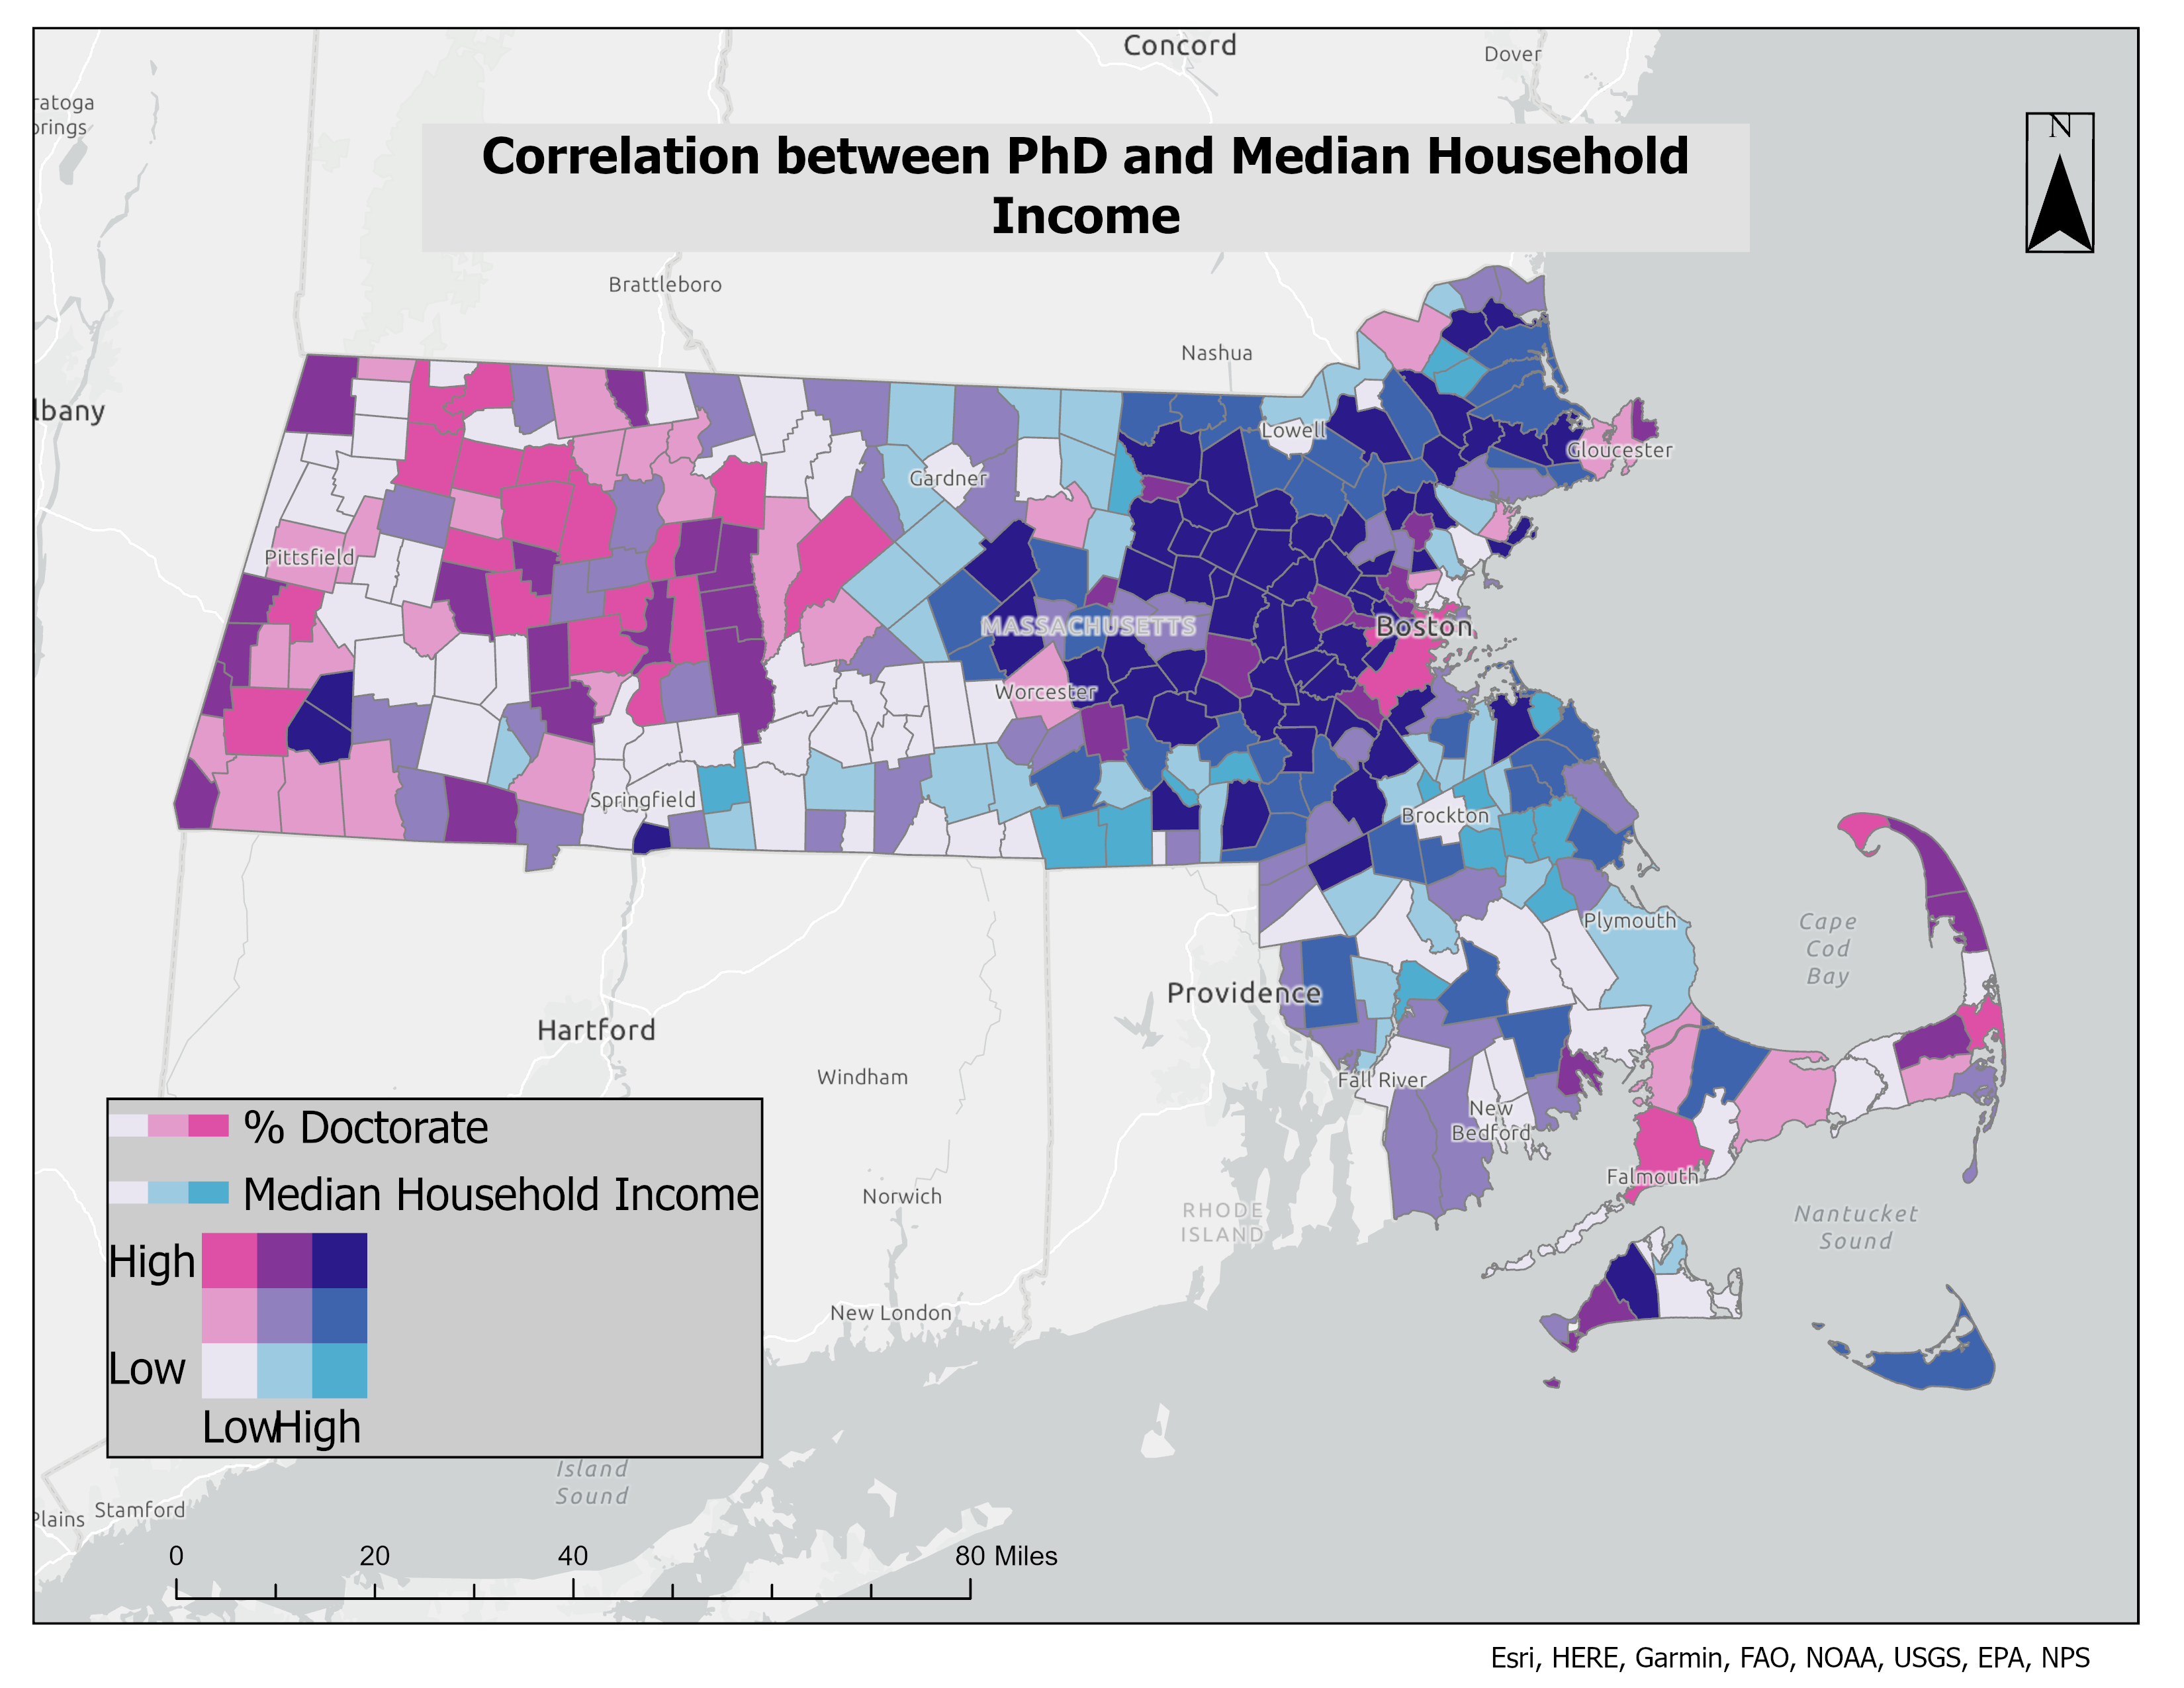
MA: PhD × Income
MA: PhD × Median Income (Bivariate)
Bivariate: % PhD × median income, MA towns.
ArcGIS Pro
Bivariate
Census ACS
Correlation
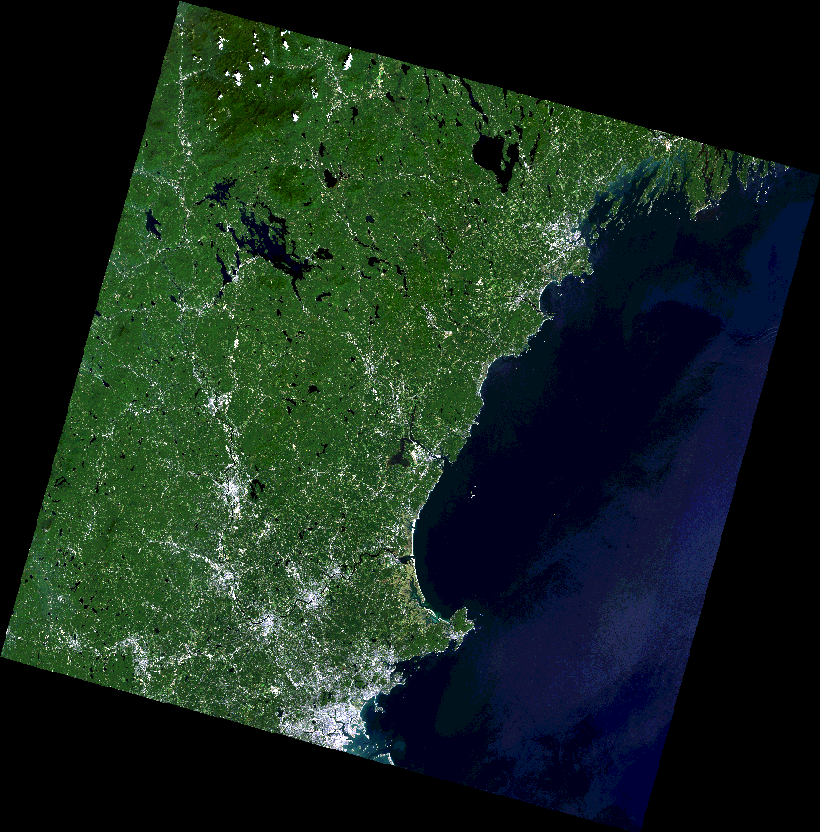
NH Coast (Natural Color)
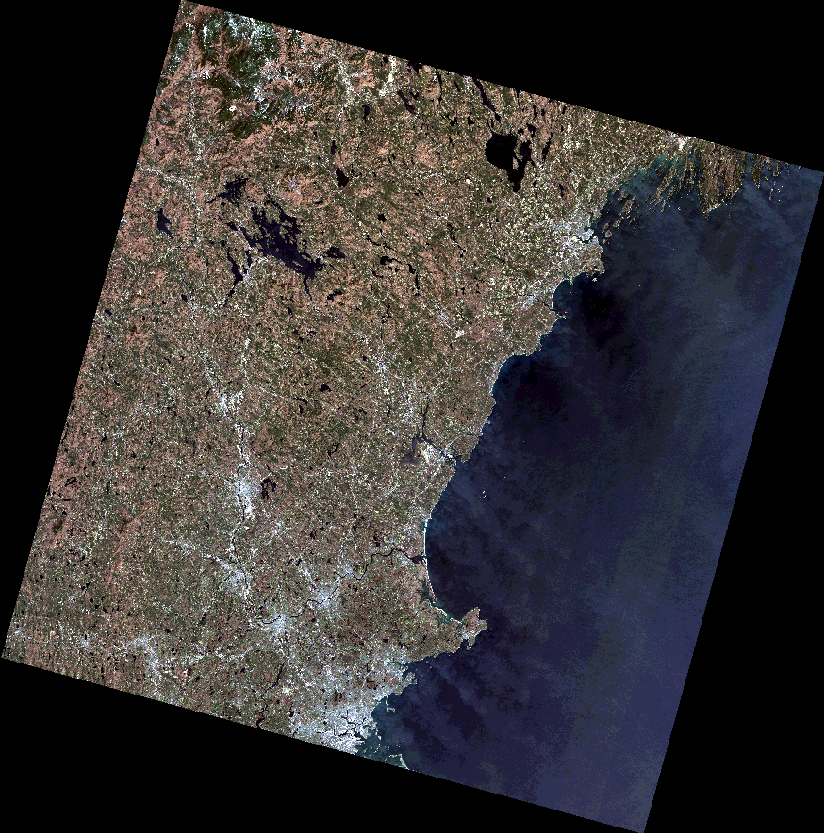
Coastal New Hampshire — Landsat 8/9 Natural Color
Full-scene Landsat 8/9 natural color over coastal NH.
Landsat 8/9
Natural Color
Remote Sensing
Granite State
Salem Pantry: Household Clusters
Salem Pantry: Pantry-Using Households by Cluster
Pantry-using households around Salem clustered by demographic profile.
R
Clustering
KDE
Salem Pantry
Southern NH (Natural Color)
Southern New Hampshire — Landsat 8/9 (Alt Capture)
Alt-date Landsat 8/9 natural color over southern NH.
Landsat 8/9
Natural Color
Remote Sensing
Granite State
Nashua (Natural Color)
Nashua, NH — Landsat Natural Color
Landsat natural color over Nashua, NH — densest footprint, on the Massachusetts border.
Landsat 8/9
Natural Color
Remote Sensing
Granite State
Concord (Natural Color)
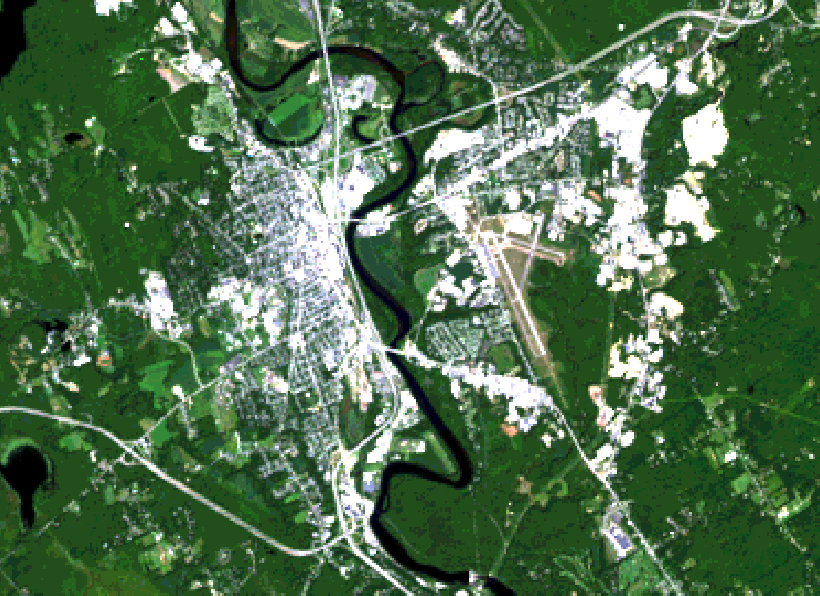
Concord, NH — Landsat Natural Color
Landsat natural color over Concord, NH.
Landsat 8/9
Natural Color
Remote Sensing
Granite State
Manchester (Natural Color)
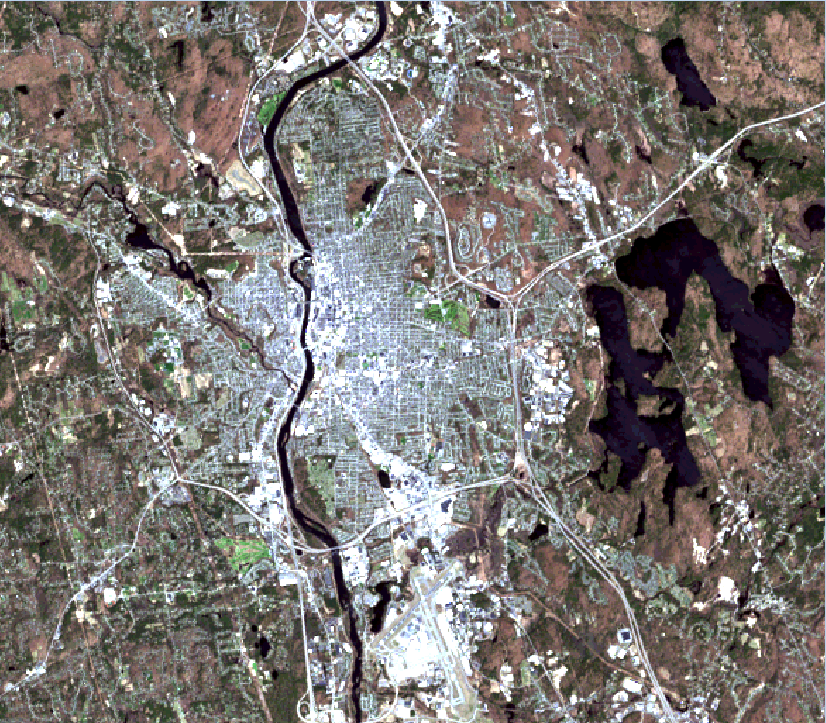
Manchester, NH — Landsat Natural Color
Landsat natural color over Manchester, NH — Merrimack through the core, Massabesic to the east.
Landsat 8/9
Natural Color
Remote Sensing
Granite State
Concord + Lakes
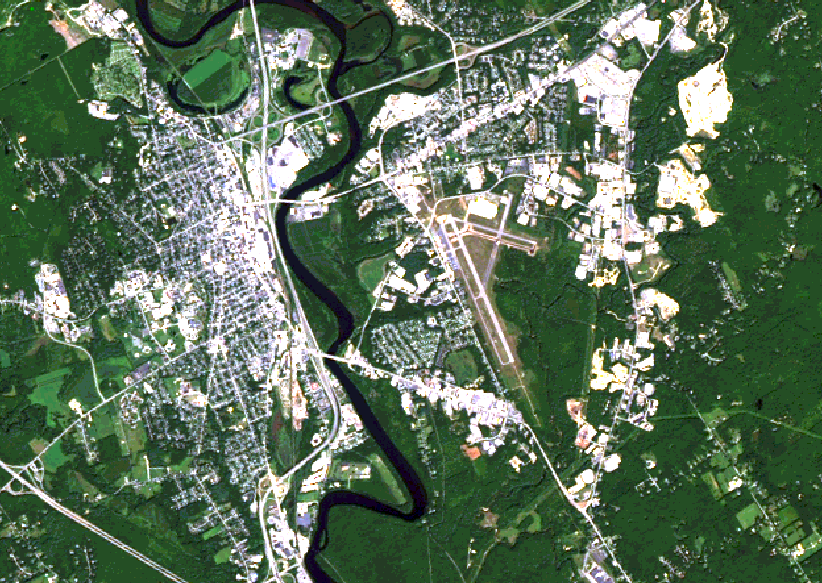
Concord with Surrounding Lakes — Landsat Natural Color
Wider Landsat natural color around Concord, NH (with lakes).
Landsat 8/9
Natural Color
Remote Sensing
Granite State
NH Coast (False Color)
Coastal NH — Landsat False-Color NIR Composite
Full-scene Landsat false-color NIR composite over coastal NH.
Landsat 8/9
False Color NIR
Remote Sensing
Granite State
Lynn — Street-Map Poster
Lynn, Massachusetts — Street-Map Poster
Minimalist black-and-white street-map poster of Lynn, MA — a personal piece made for a friend from the city.
Cartography
OpenStreetMap
Poster
Pleiades: Melbourne Band 5
Pleiades Band 5 — Melbourne
Pleiades-1 panchromatic single-band view over Melbourne — reference band for pan-sharpening.
Pleiades-1
Remote Sensing
Panchromatic
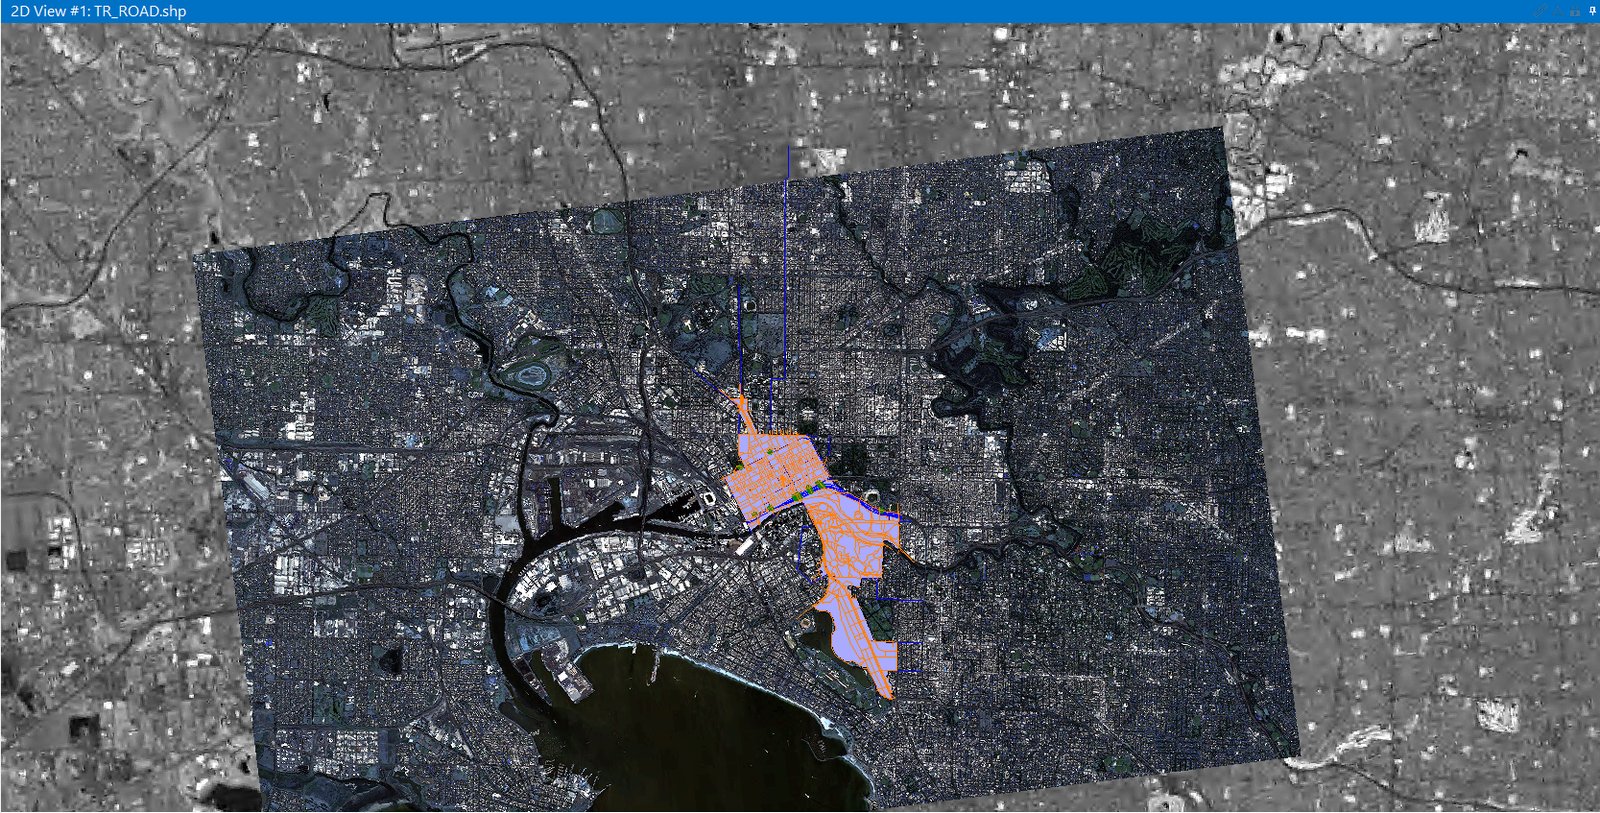
Roads on Satellite — Melbourne
Melbourne — Road Network on Satellite
Vector road network overlaid on Pleiades imagery for Melbourne. Vector-on-raster integration exercise.
ArcGIS Pro
Pleiades-1
Vector + Raster
Pleiades: Melbourne CBD
Pleiades Overview — Melbourne CBD
Pleiades-1 natural-color overview of Melbourne CBD and the Yarra River.
Pleiades-1
Remote Sensing
Natural Color
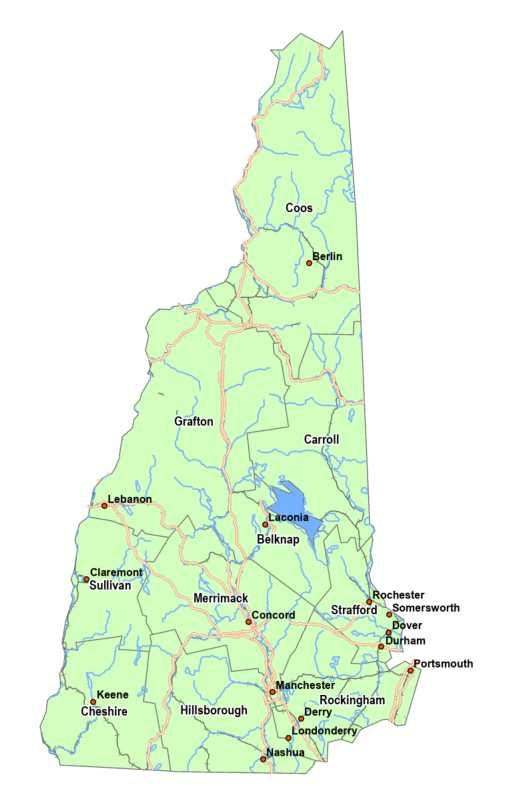
NH Counties Reference
New Hampshire — County Reference Map
Clean reference map of NH's ten counties with city annotations and hydrography.
ArcGIS Pro
Reference Map
New Hampshire
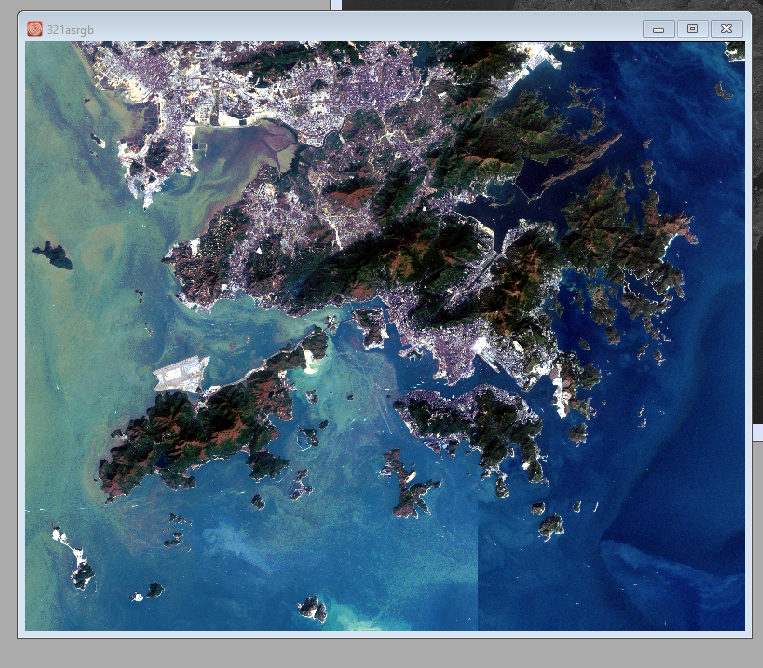
Hong Kong Natural Color
Hong Kong — Natural Color Landsat
Hong Kong / Pearl River Delta coastline in natural-color Landsat. Band combo exercise.
Landsat
Remote Sensing
Hong Kong
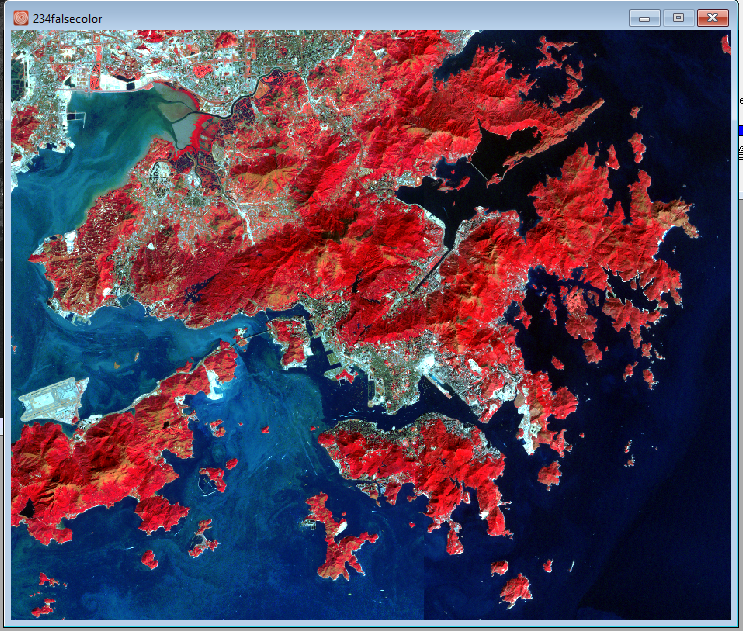
Hong Kong NIR False Color
Hong Kong — False Color (NIR as Red)
Hong Kong Landsat false-color composite — NIR mapped to red, vegetation burns crimson.
Landsat
NIR Composite
Hong Kong
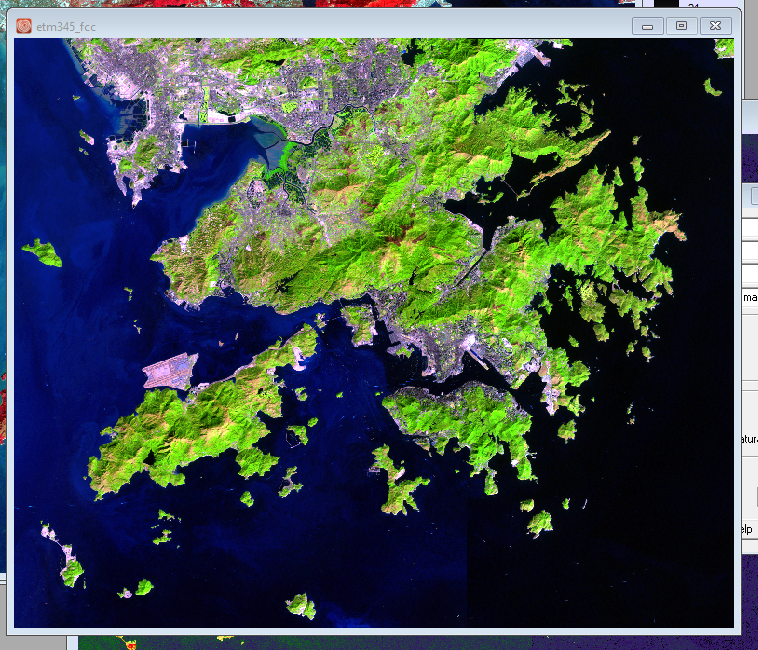
Hong Kong Vegetation Bands
Hong Kong — Vegetation Band Combination
Hong Kong Landsat composite emphasizing vegetation — same scene, different spectral story.
Landsat
Remote Sensing
Band Composite
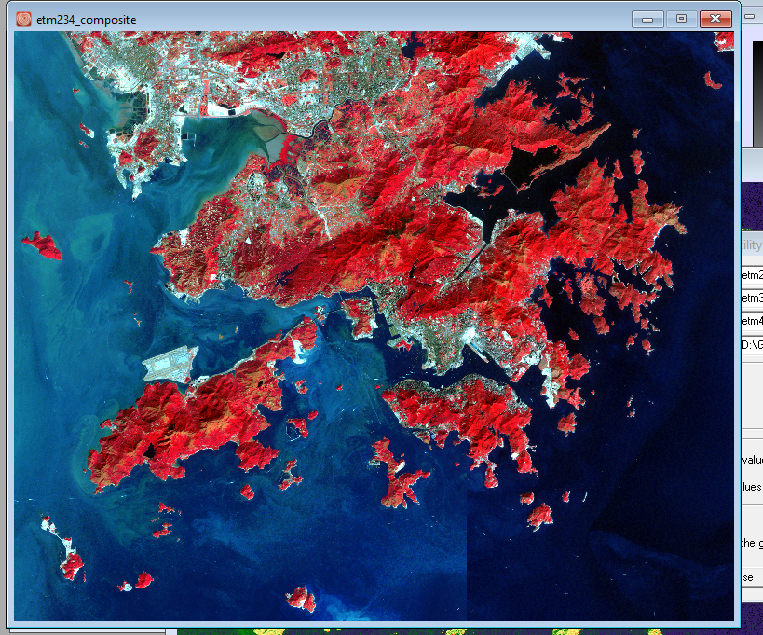
Hong Kong Alt NIR
Hong Kong — Alternate NIR Composite
Alternate NIR-as-red Landsat composite over Hong Kong from the band-stack exploration.
Landsat
NIR Composite
Hong Kong
Hong Kong Natural Color (2)
Hong Kong — Natural Color
Working natural-color view of Hong Kong Landsat from the band-combination exercise.
Landsat
Remote Sensing
Hong Kong
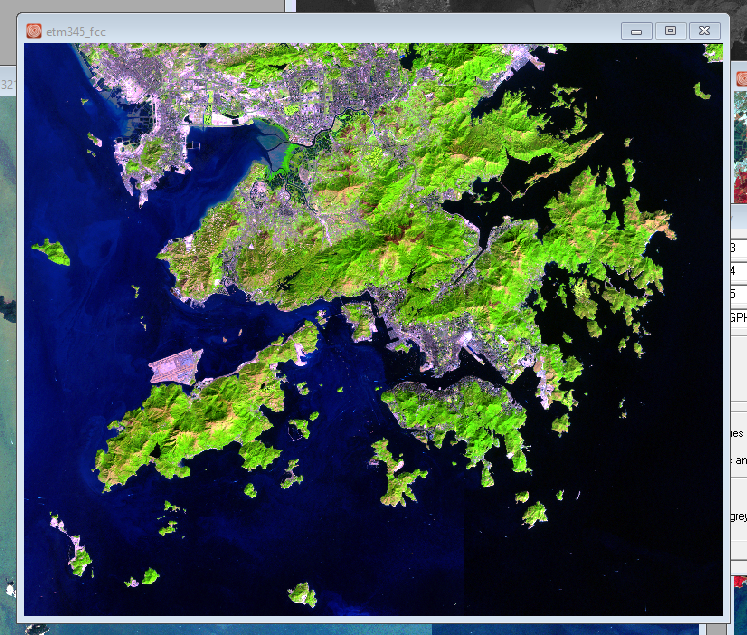
Hong Kong FCC — Final
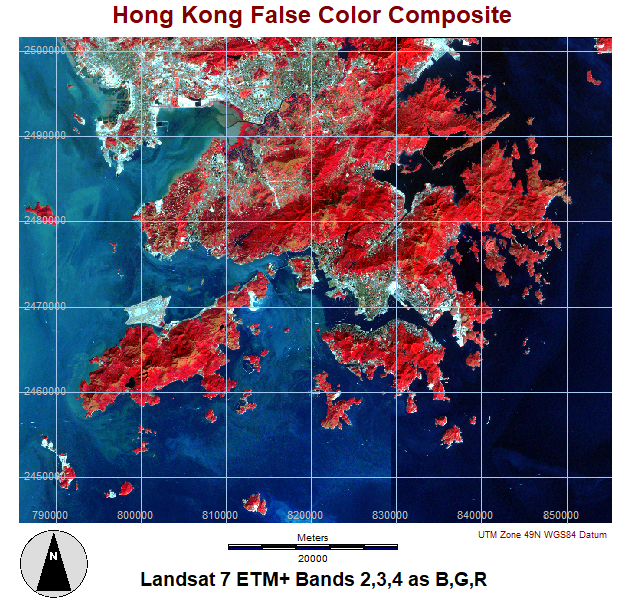
Hong Kong False Color Composite
Finished layout: Hong Kong false-color using Landsat 7 ETM+ Bands 2,3,4 as B,G,R.
Landsat 7 ETM+
False Color
Final Layout
Hong Kong 3D Drape
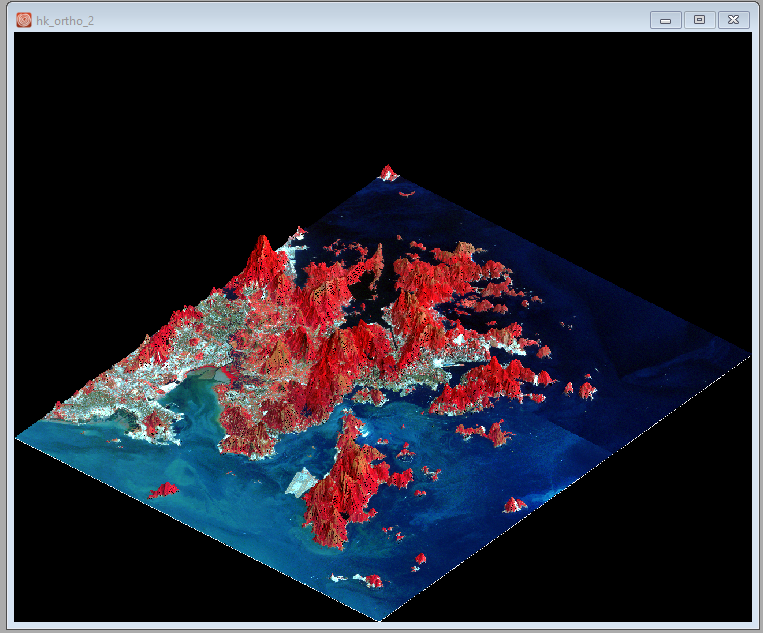
Hong Kong — 3D Draped Terrain
False-color Landsat draped over a DEM and rendered in 3D. Same scene, with topography.
ArcGIS Pro
3D
Terrain
Africa Feb False Color
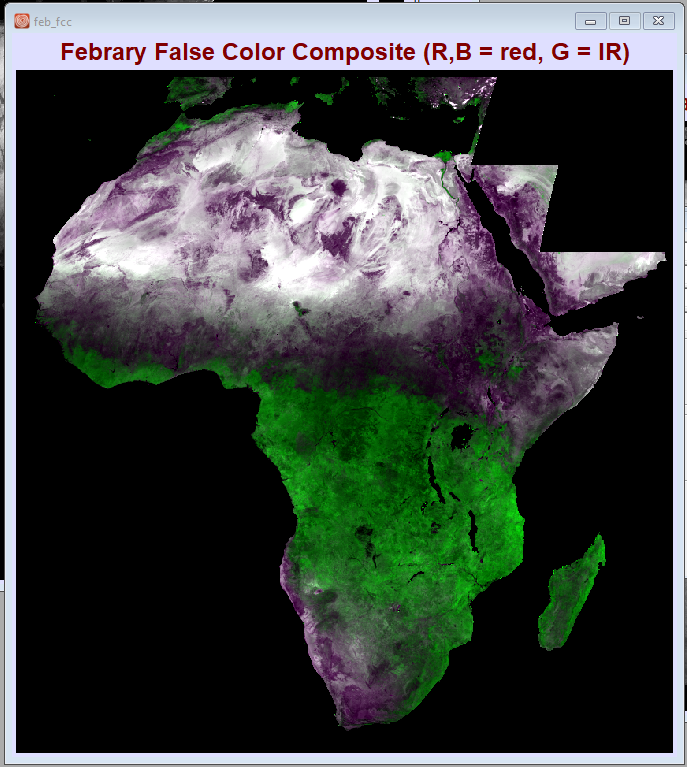
Africa — February False Color Composite
Continental false-color composite of Africa for February — visible red on R/B, infrared on G.
Remote Sensing
Africa
False Color
Africa NDVI
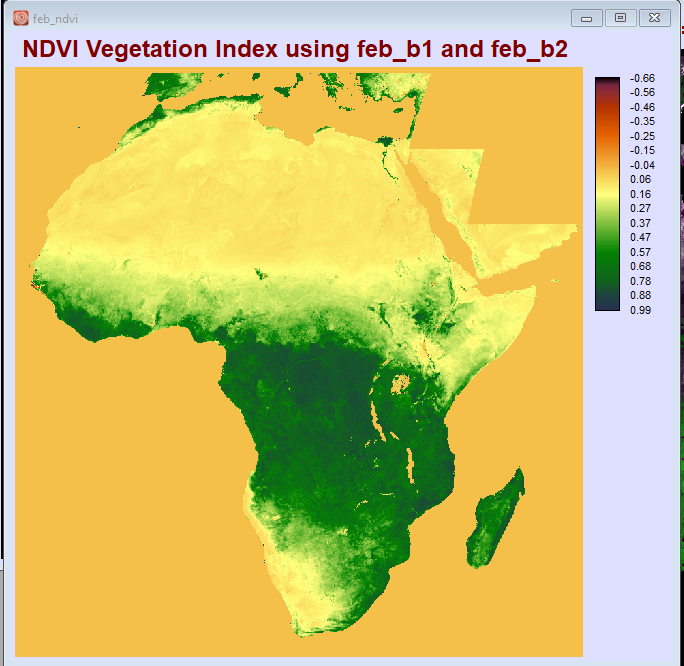
Africa — NDVI Vegetation Index
Continental NDVI of Africa from February imagery. Deep green = dense vegetation, red = bare/desert.
NDVI
Remote Sensing
Africa
Cape Ann FCC
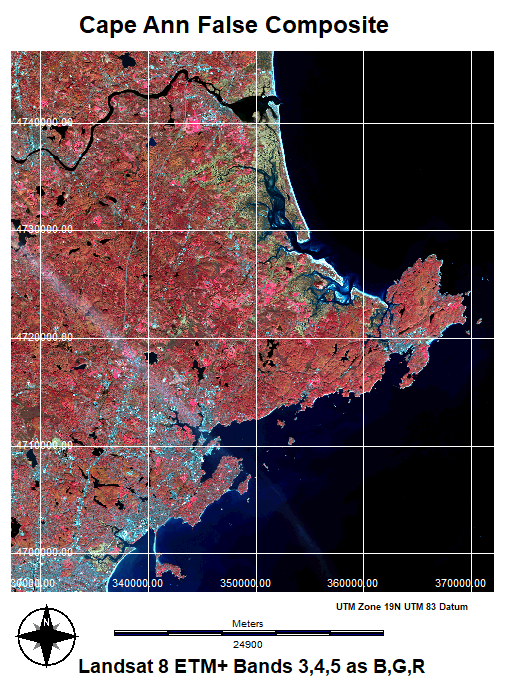
Cape Ann False Composite
Cape Ann (MA) false-color composite — Landsat 8 ETM+ Bands 3,4,5 as B,G,R.
Landsat 8
False Color
Cape Ann
Eastern MA Landsat Mosaic
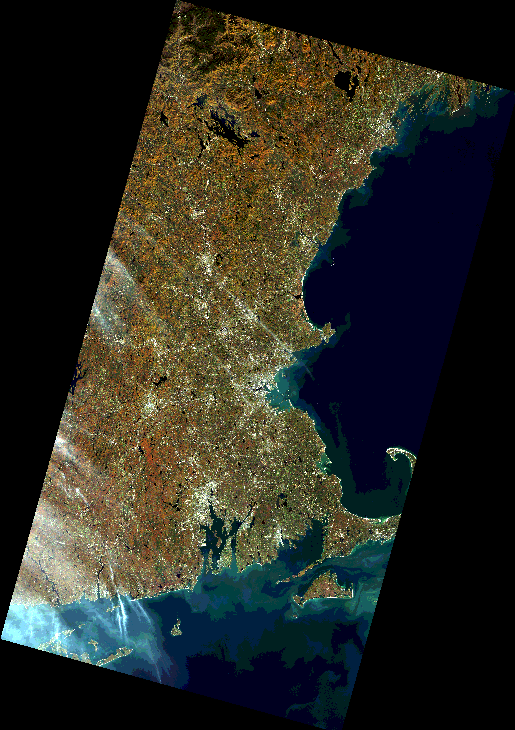
Eastern Massachusetts — Coastal Landsat Mosaic
Two Landsat scenes mosaicked and edge-matched in GIS — Boston metro, South Shore, Cape Cod, Buzzards Bay.
Landsat
Mosaic
Remote Sensing
Massachusetts
Boston UHI Classification
Urban Heat Classification — Boston Metro
Classified urban heat island analysis — categorical raster over Boston metro built vs vegetated zones.
Classification
Remote Sensing
UHI
Lynn: Student Distribution
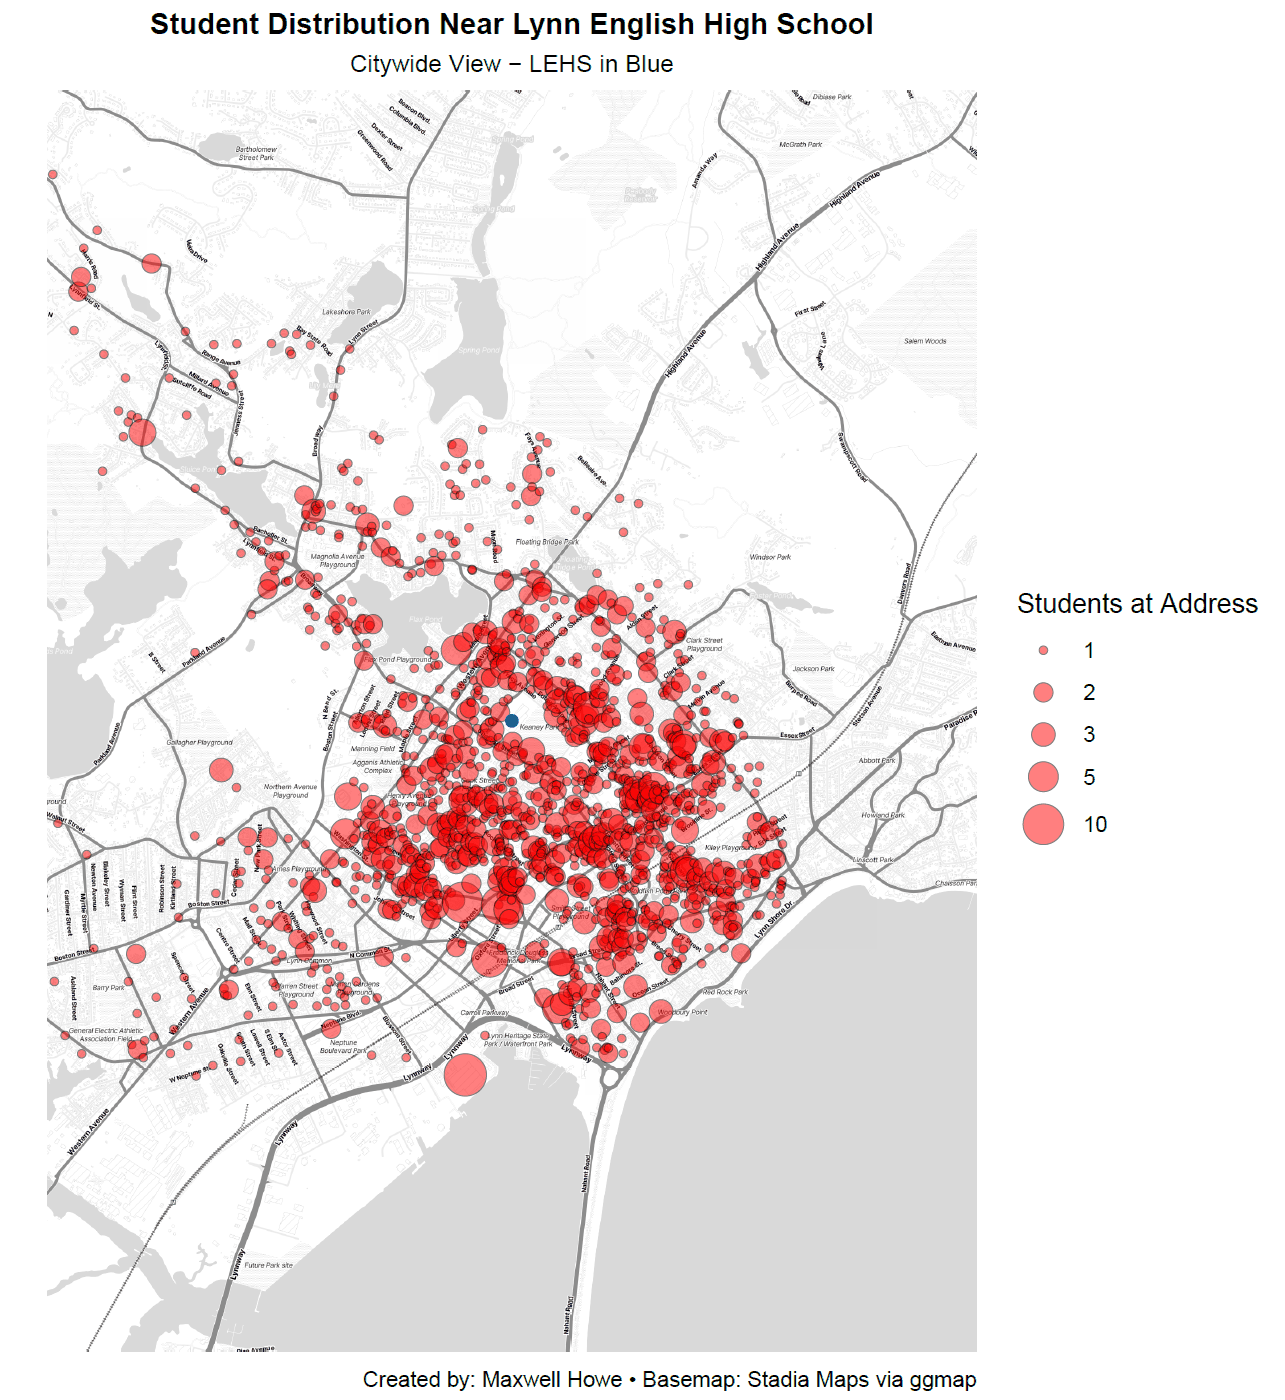
Lynn: Student Address Distribution (Citywide)
Citywide bubble dot map of LEHS student home addresses.
R
ggplot2
Capstone
Lynn
View full project →
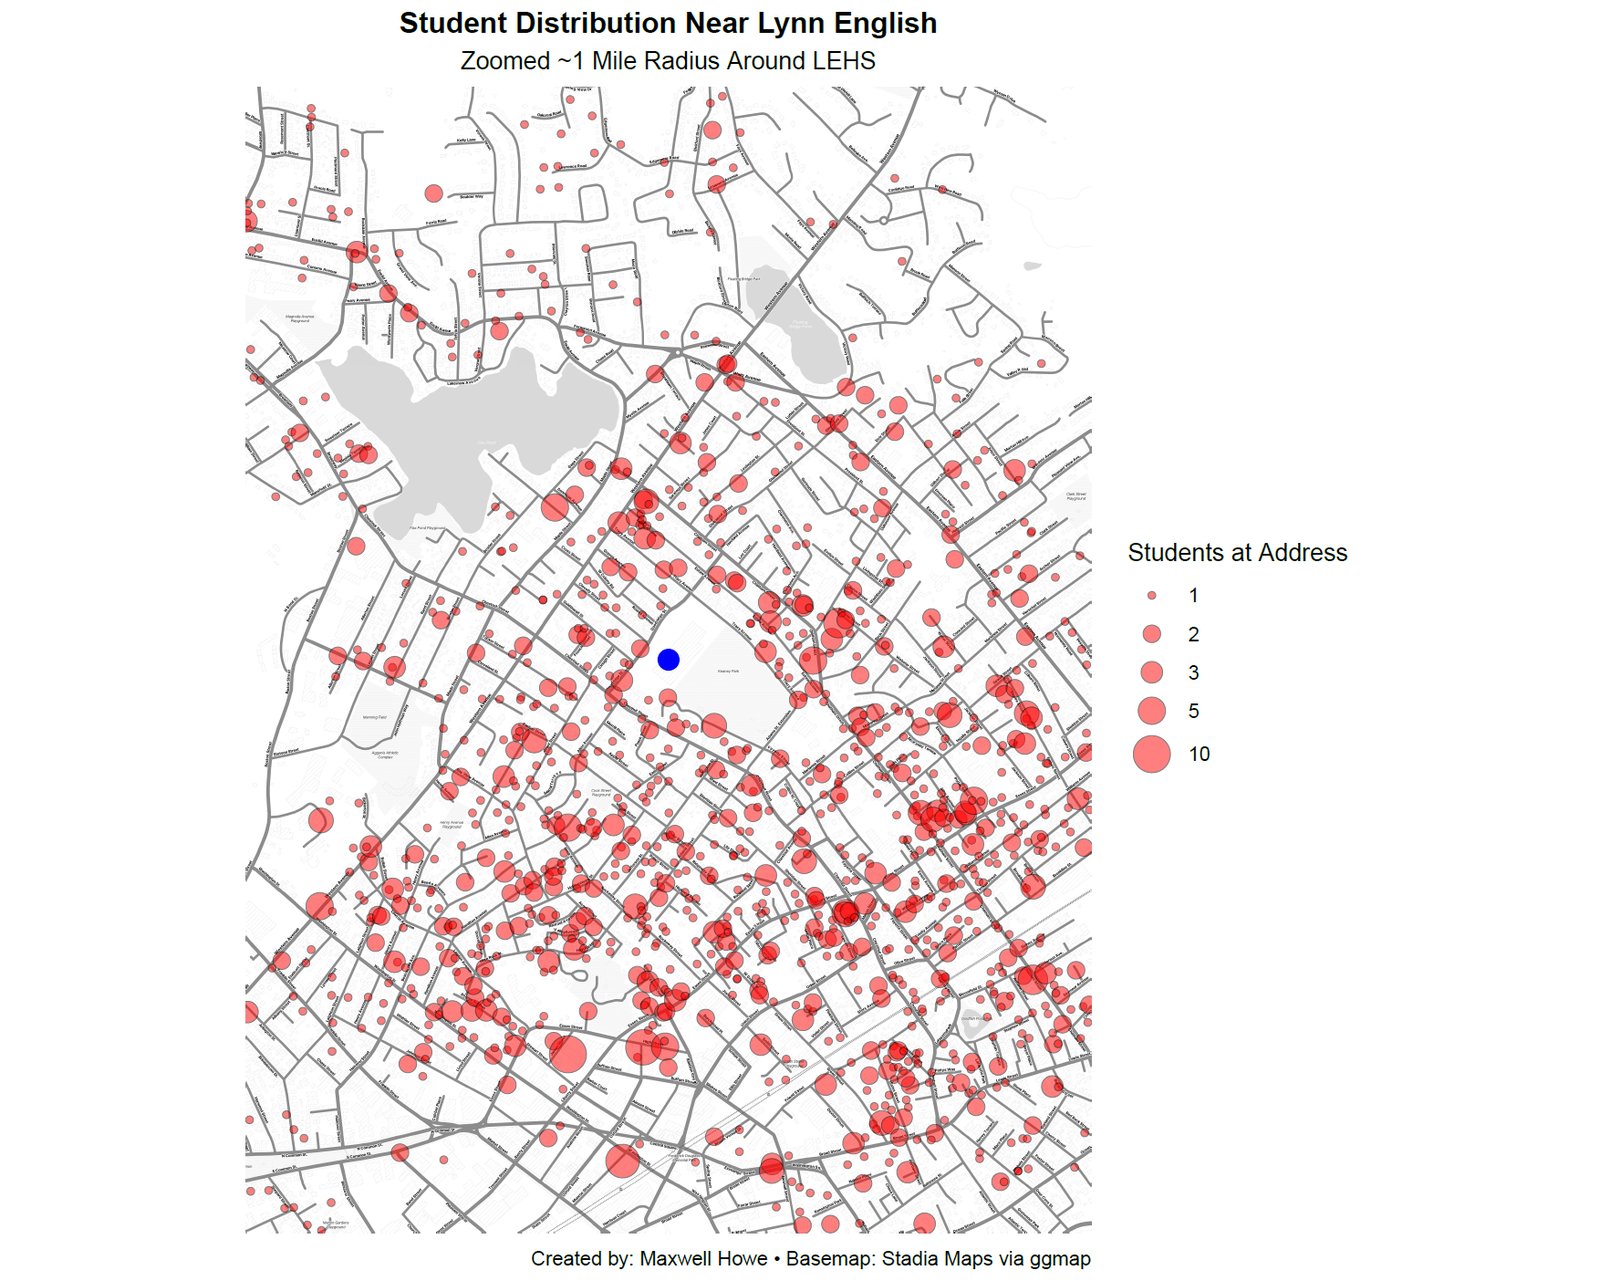
Lynn: Near LEHS (1 mi)
Lynn: Student Addresses near LEHS (1-Mile Zoom)
1-mile zoom of LEHS student home addresses with bubble sizing.
R
ggplot2
Capstone
Lynn
View full project →
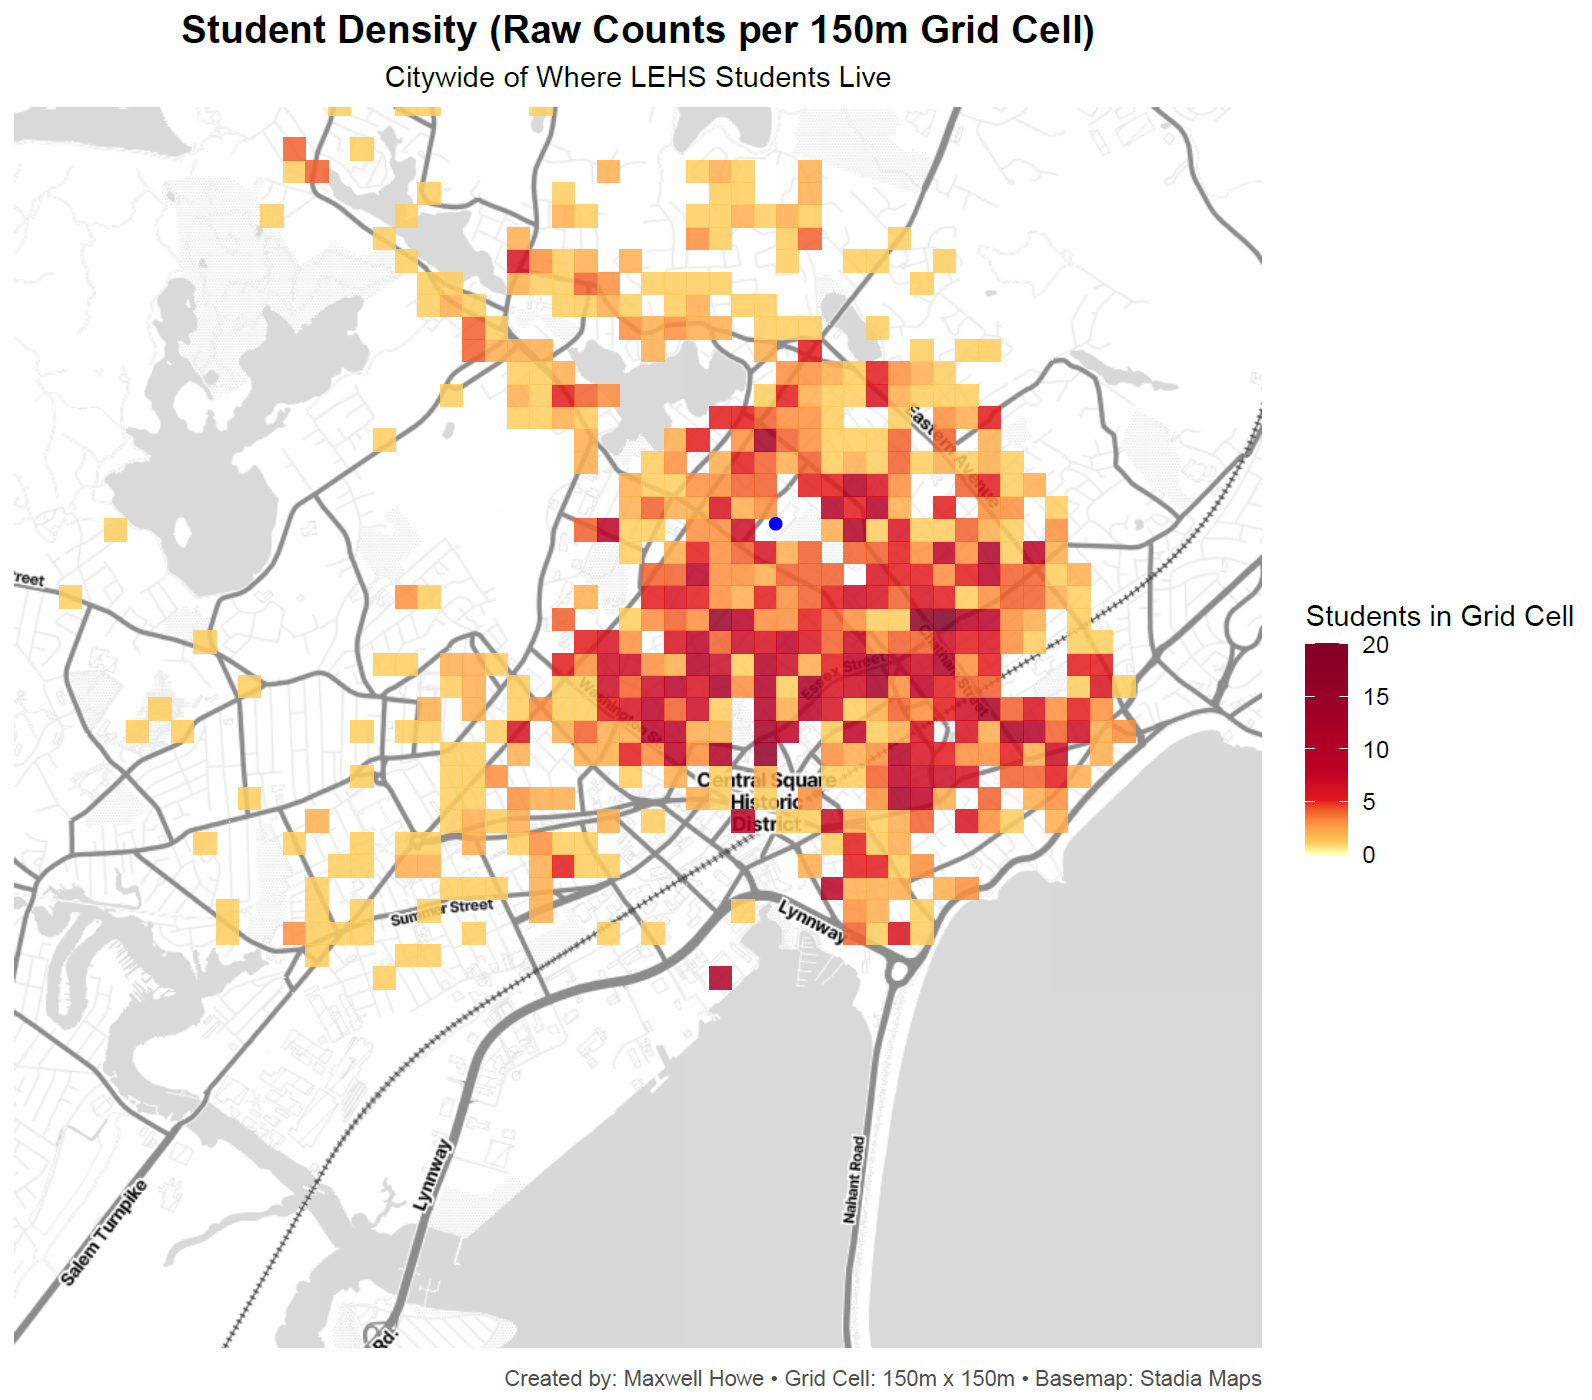
Lynn: Student Density Grid
Lynn: Student Density Grid (150 m cells)
Citywide student density — raw counts per 150m grid cell.
R
ggplot2
Capstone
Lynn
View full project →
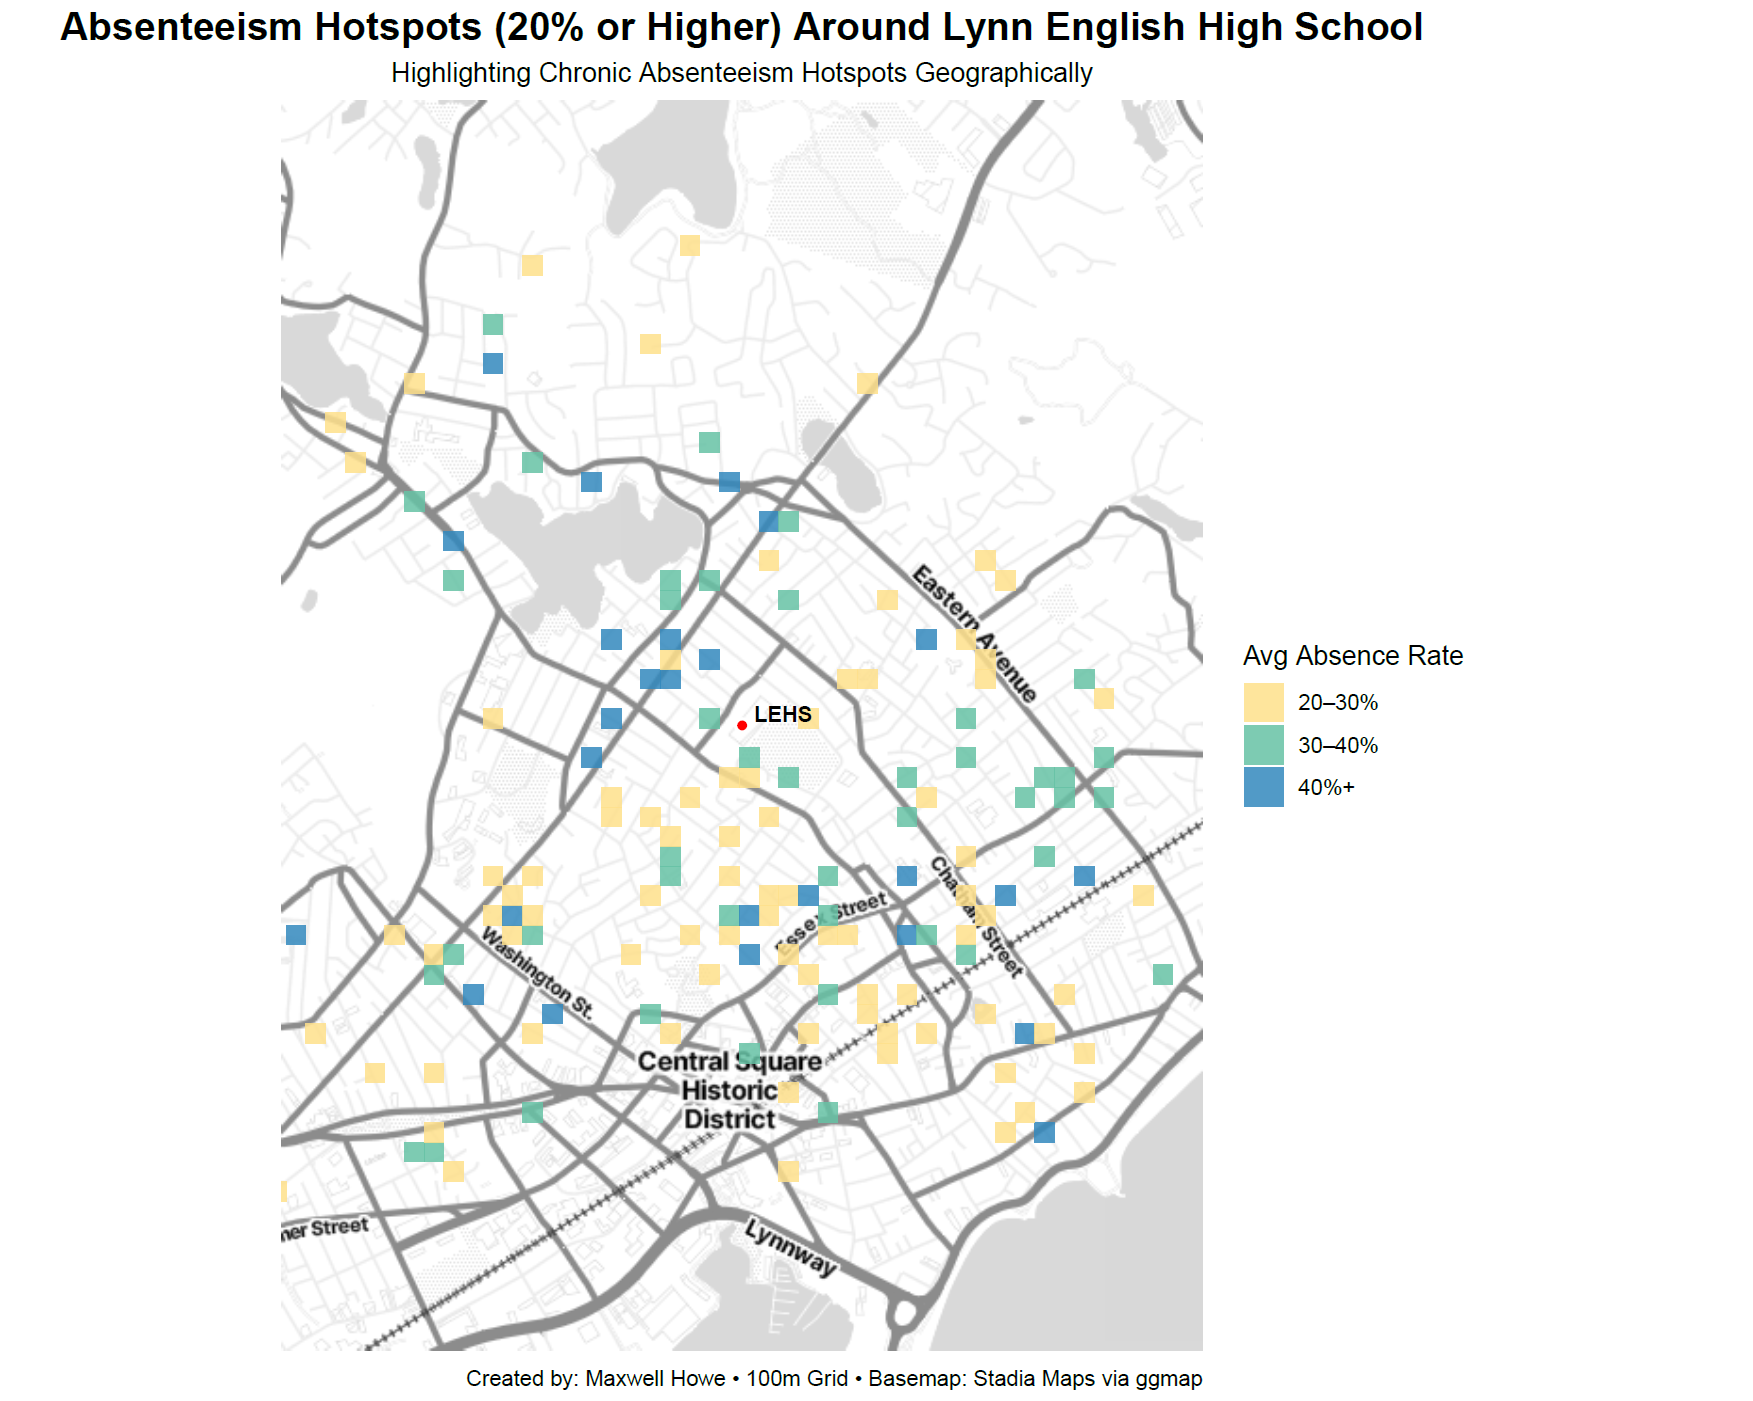
Lynn: Absence Hotspots ≥20%
Lynn: Absenteeism Hotspots (≥20%) around LEHS
Square-grid hotspot map of ≥20% absence rate cells around LEHS.
R
ggplot2
Capstone
Lynn
View full project →
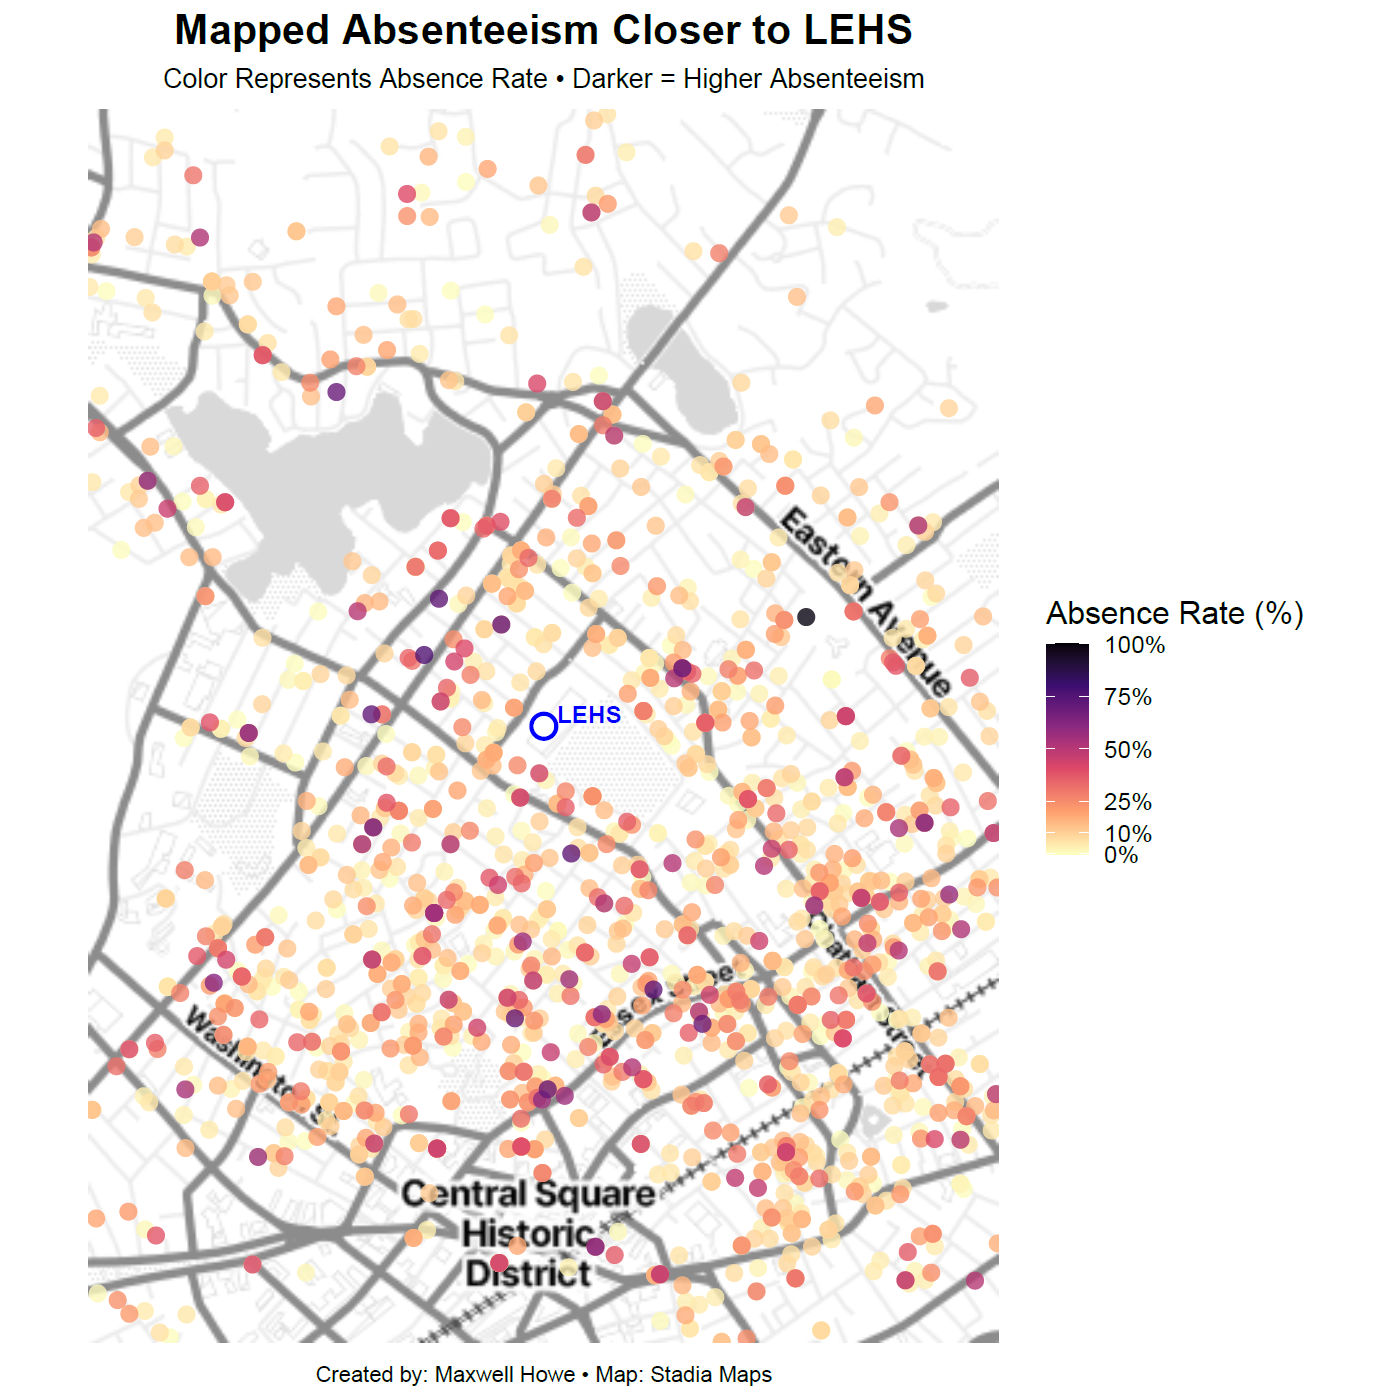
Lynn: Absence Dots (Close)
Lynn: Absenteeism Dot Map (Close to LEHS)
Close-up dot map of LEHS students colored by personal absence rate.
R
ggplot2
Capstone
Lynn
View full project →
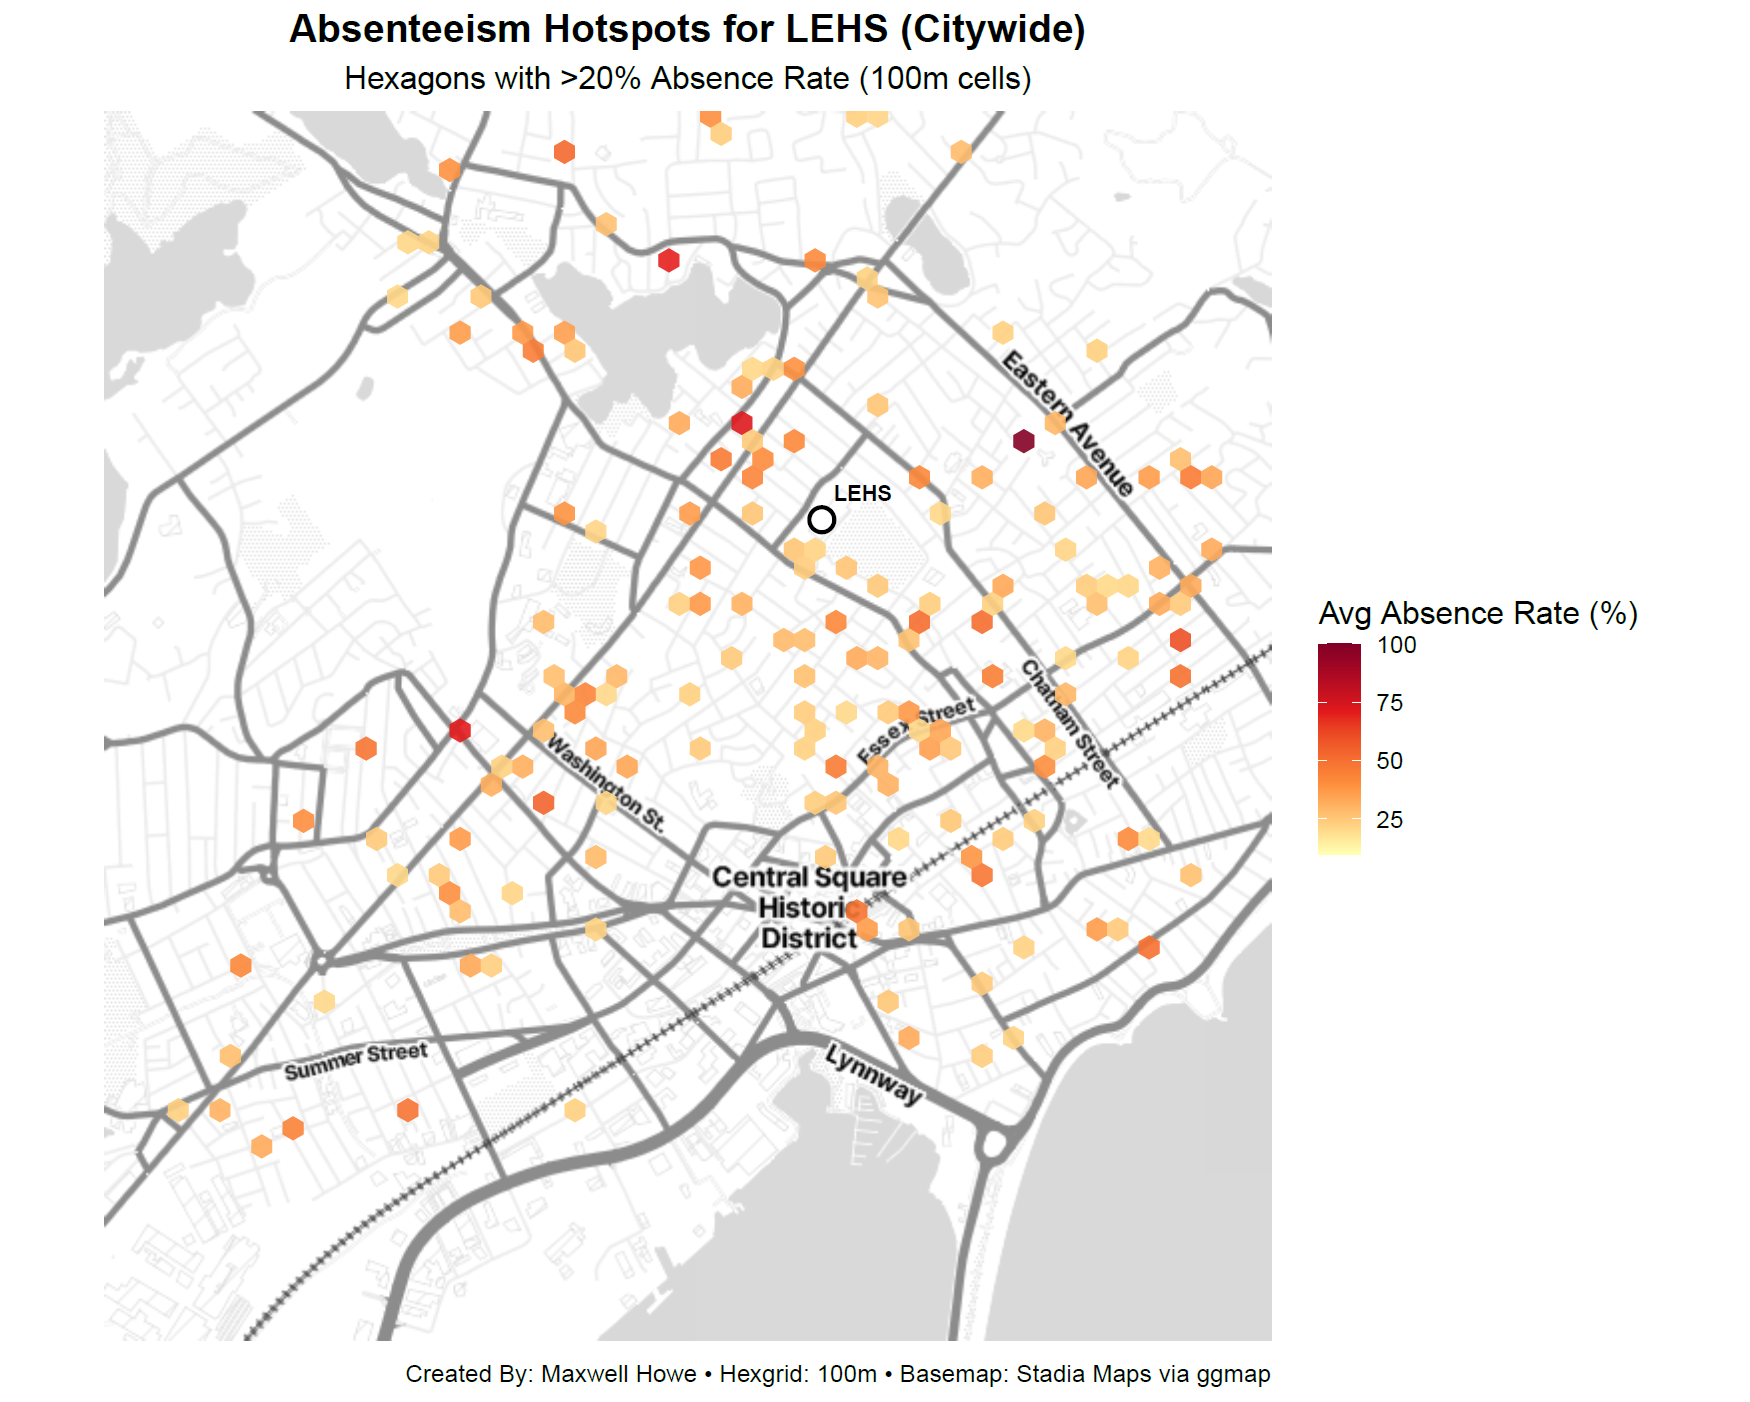
Lynn: Absence Hexbin
Lynn: Absenteeism Hotspots (Citywide Hexbin)
Citywide hexbin hotspot map filtered to >20% absence rate.
R
ggplot2
Capstone
Lynn
View full project →
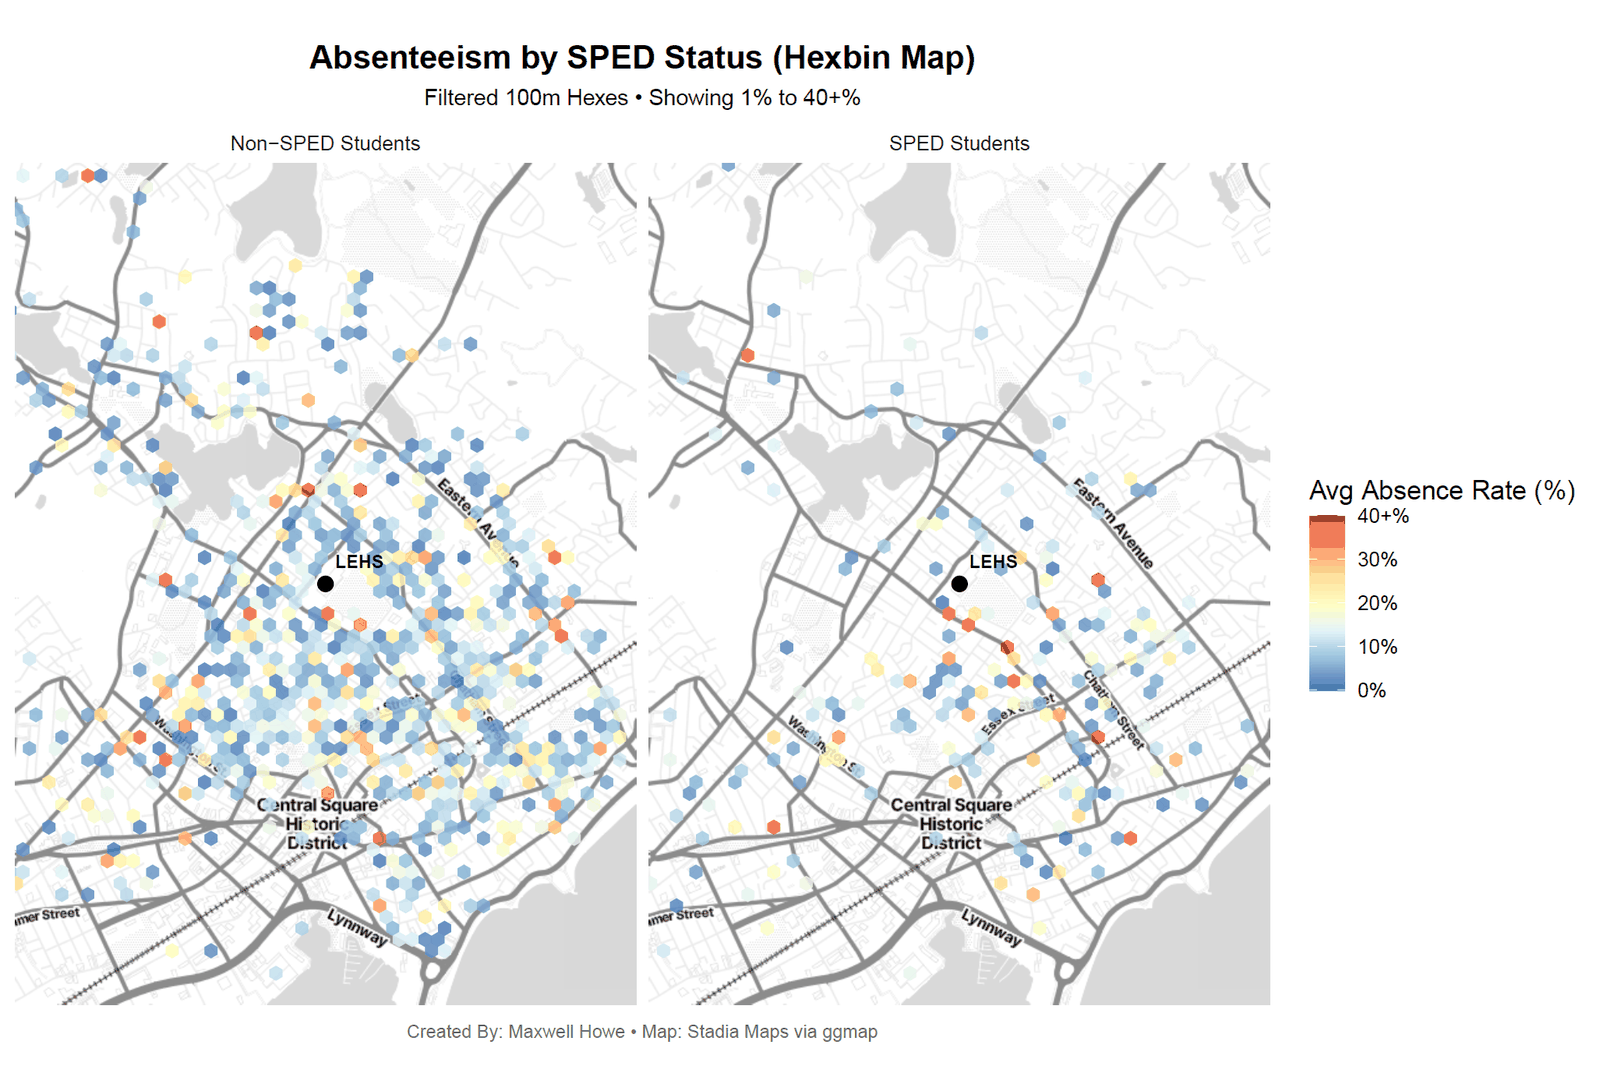
Lynn: SPED vs Non-SPED
Lynn: Absenteeism by SPED Status (Hexbin)
Side-by-side hexbin of absenteeism — SPED vs Non-SPED students.
R
Hexbin
Equity
Capstone
View full project →
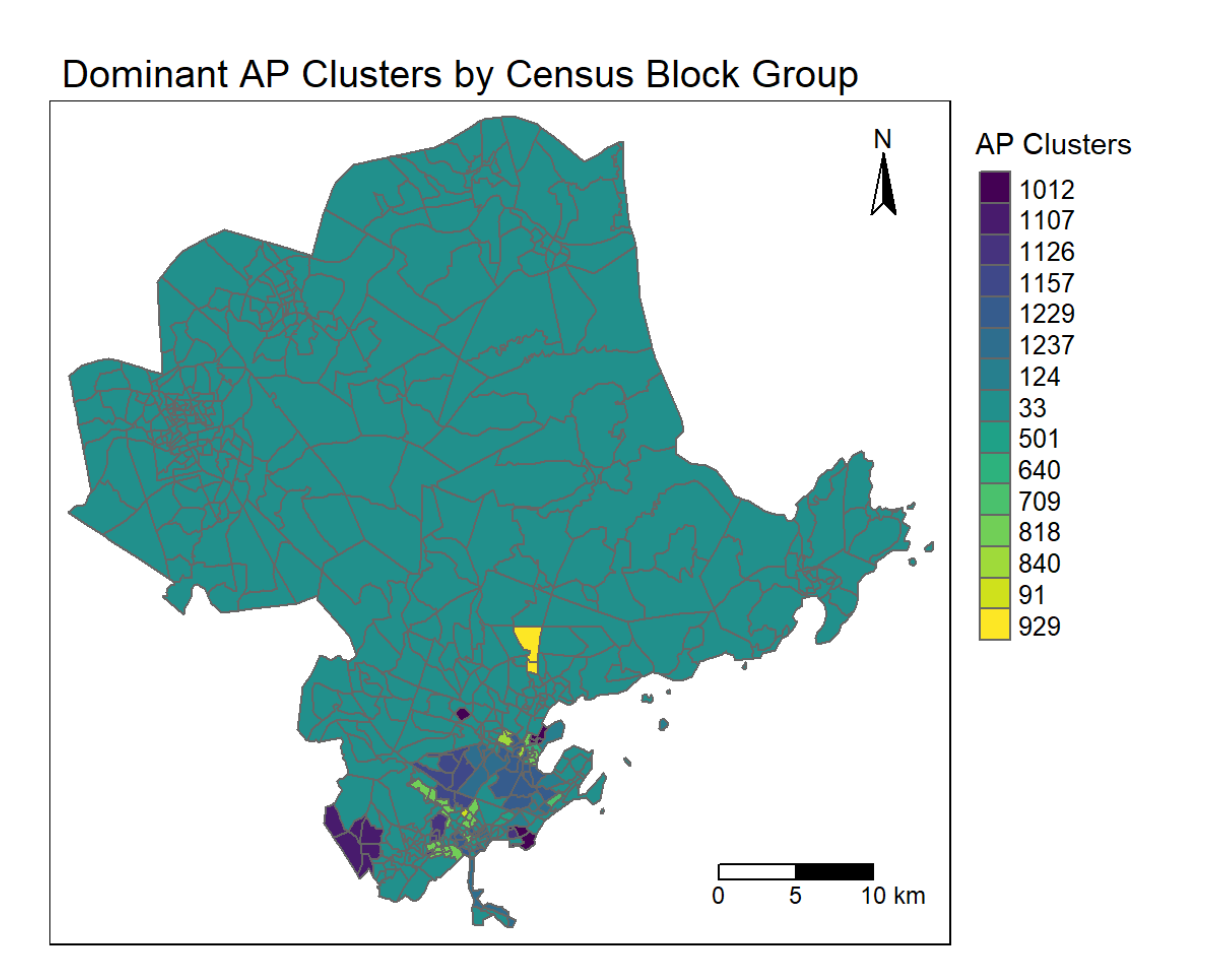
Salem Pantry: AP Clusters
Salem Pantry: Dominant Access-Point Cluster by Block Group
Dominant access-point cluster assignment per CBG around Salem.
R
Spatial Clustering
Census
Salem Pantry
Quabbin: Locator
Quabbin: Locating the Swift River Valley
The Swift River Valley within Massachusetts.
R
sf
Locator
View full project →
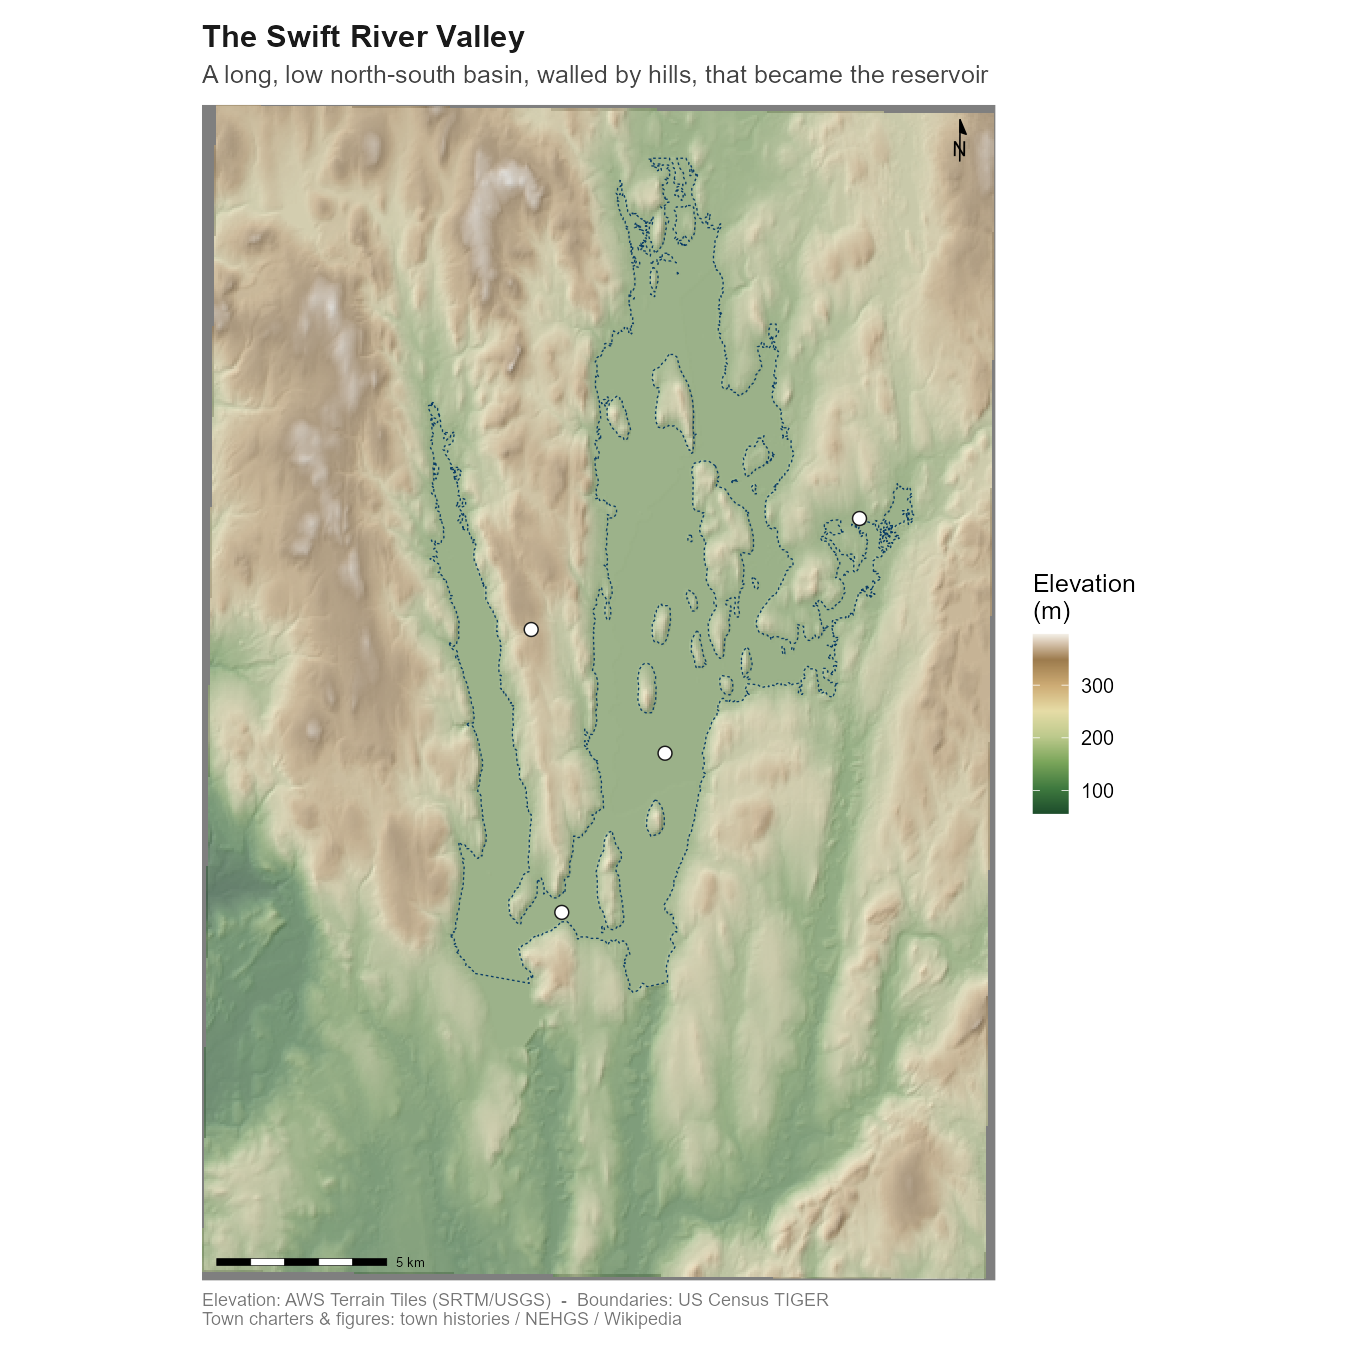
Quabbin: Hillshade
Quabbin: The Valley Before the Flood
DEM hillshade of the valley terrain, rendered in terra.
R
terra
Hillshade
View full project →
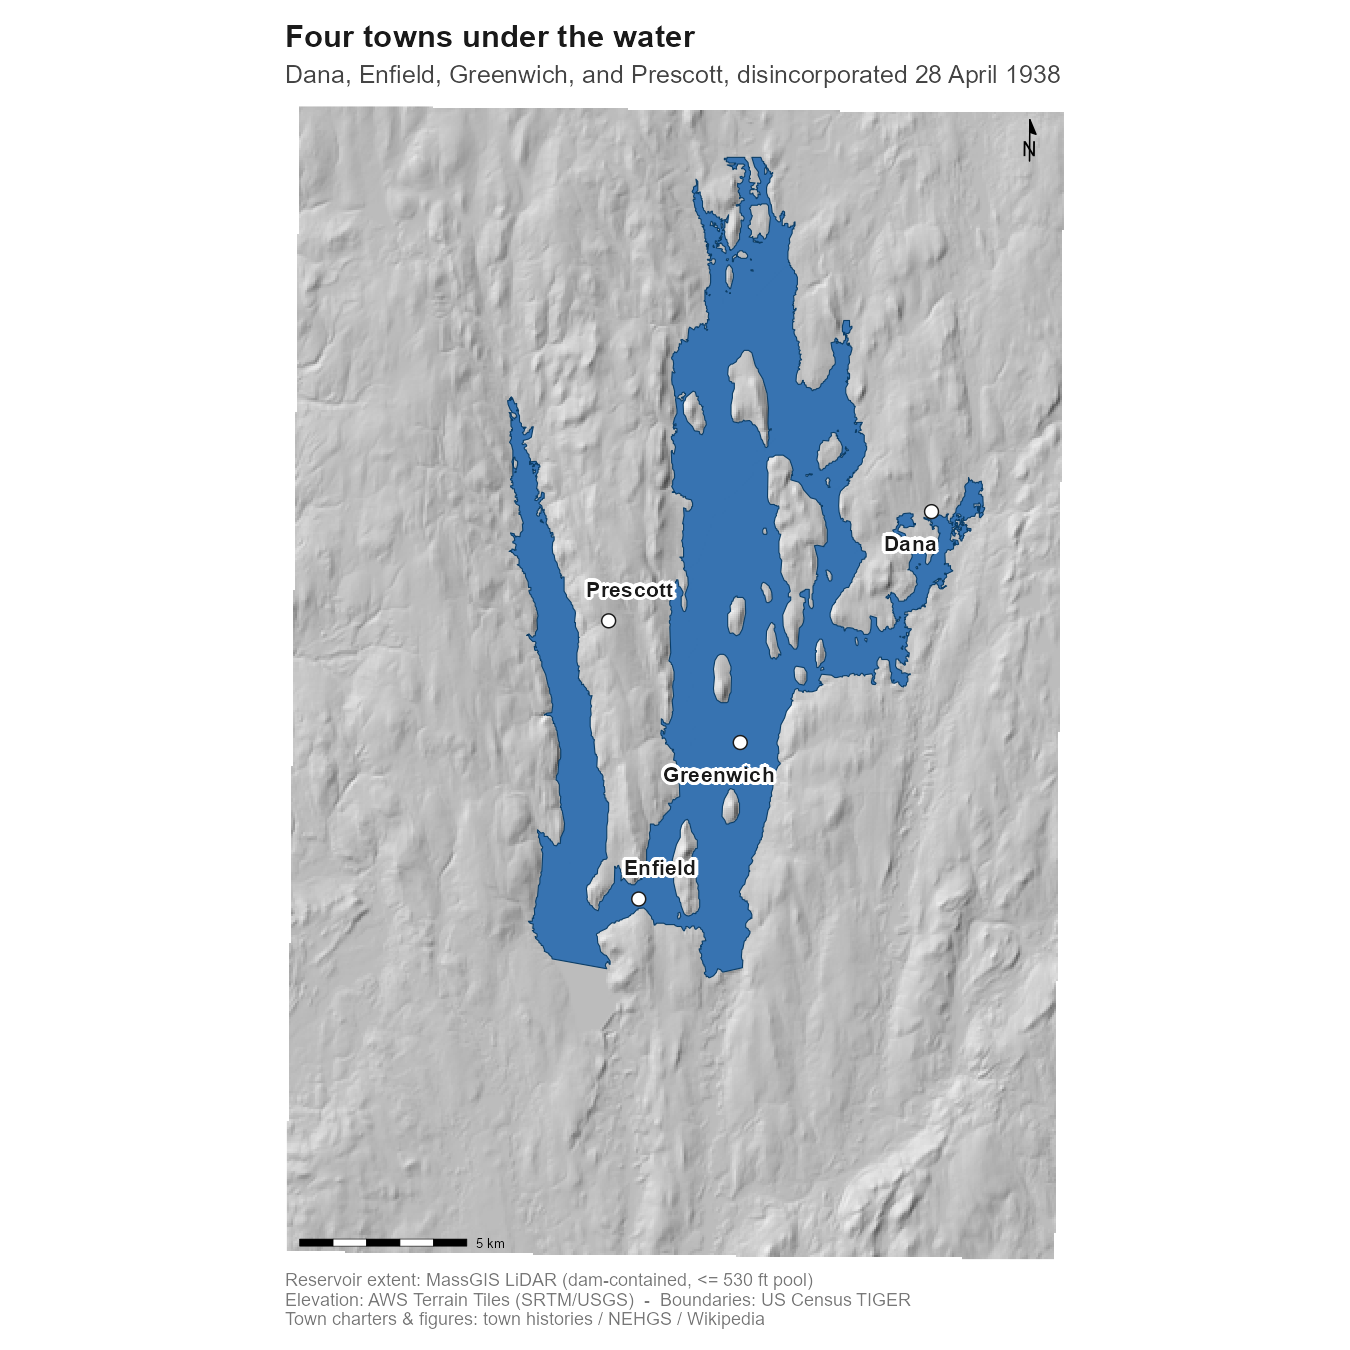
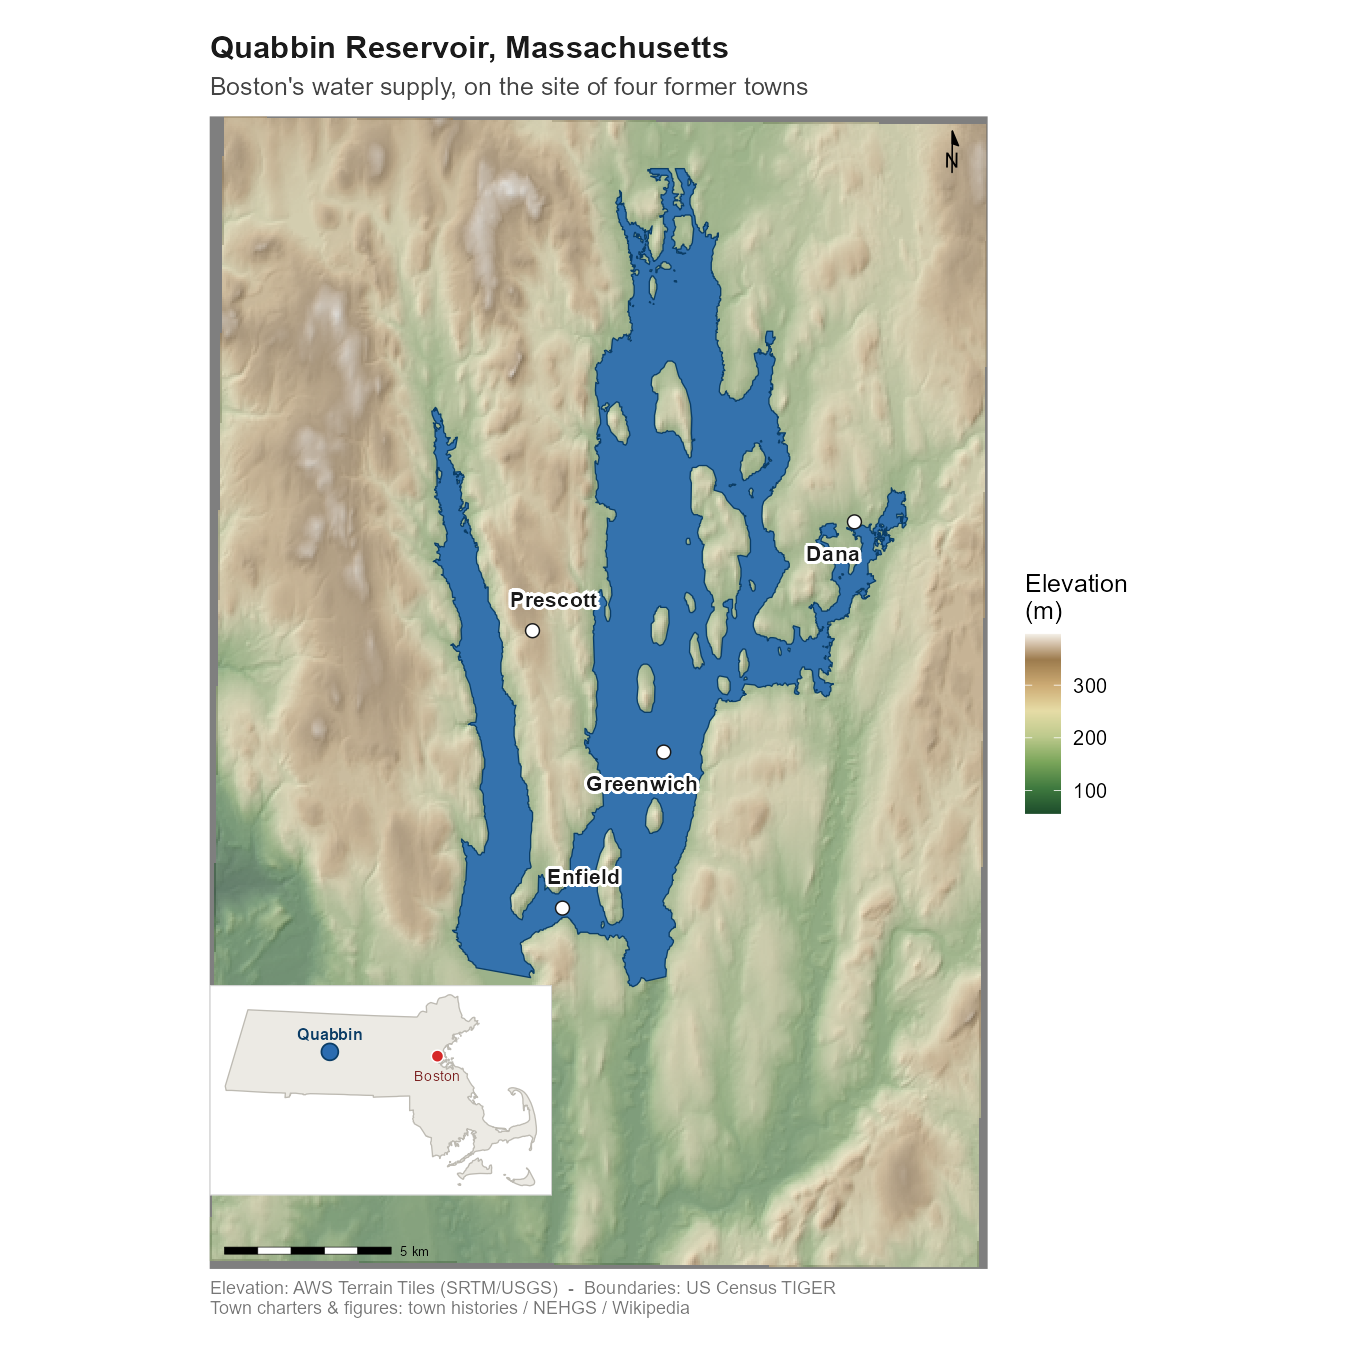
Quabbin: Lost Towns
Quabbin: Four Towns Under the Water
Dana, Enfield, Greenwich and Prescott, disincorporated in 1938.
R
sf
Historical
View full project →
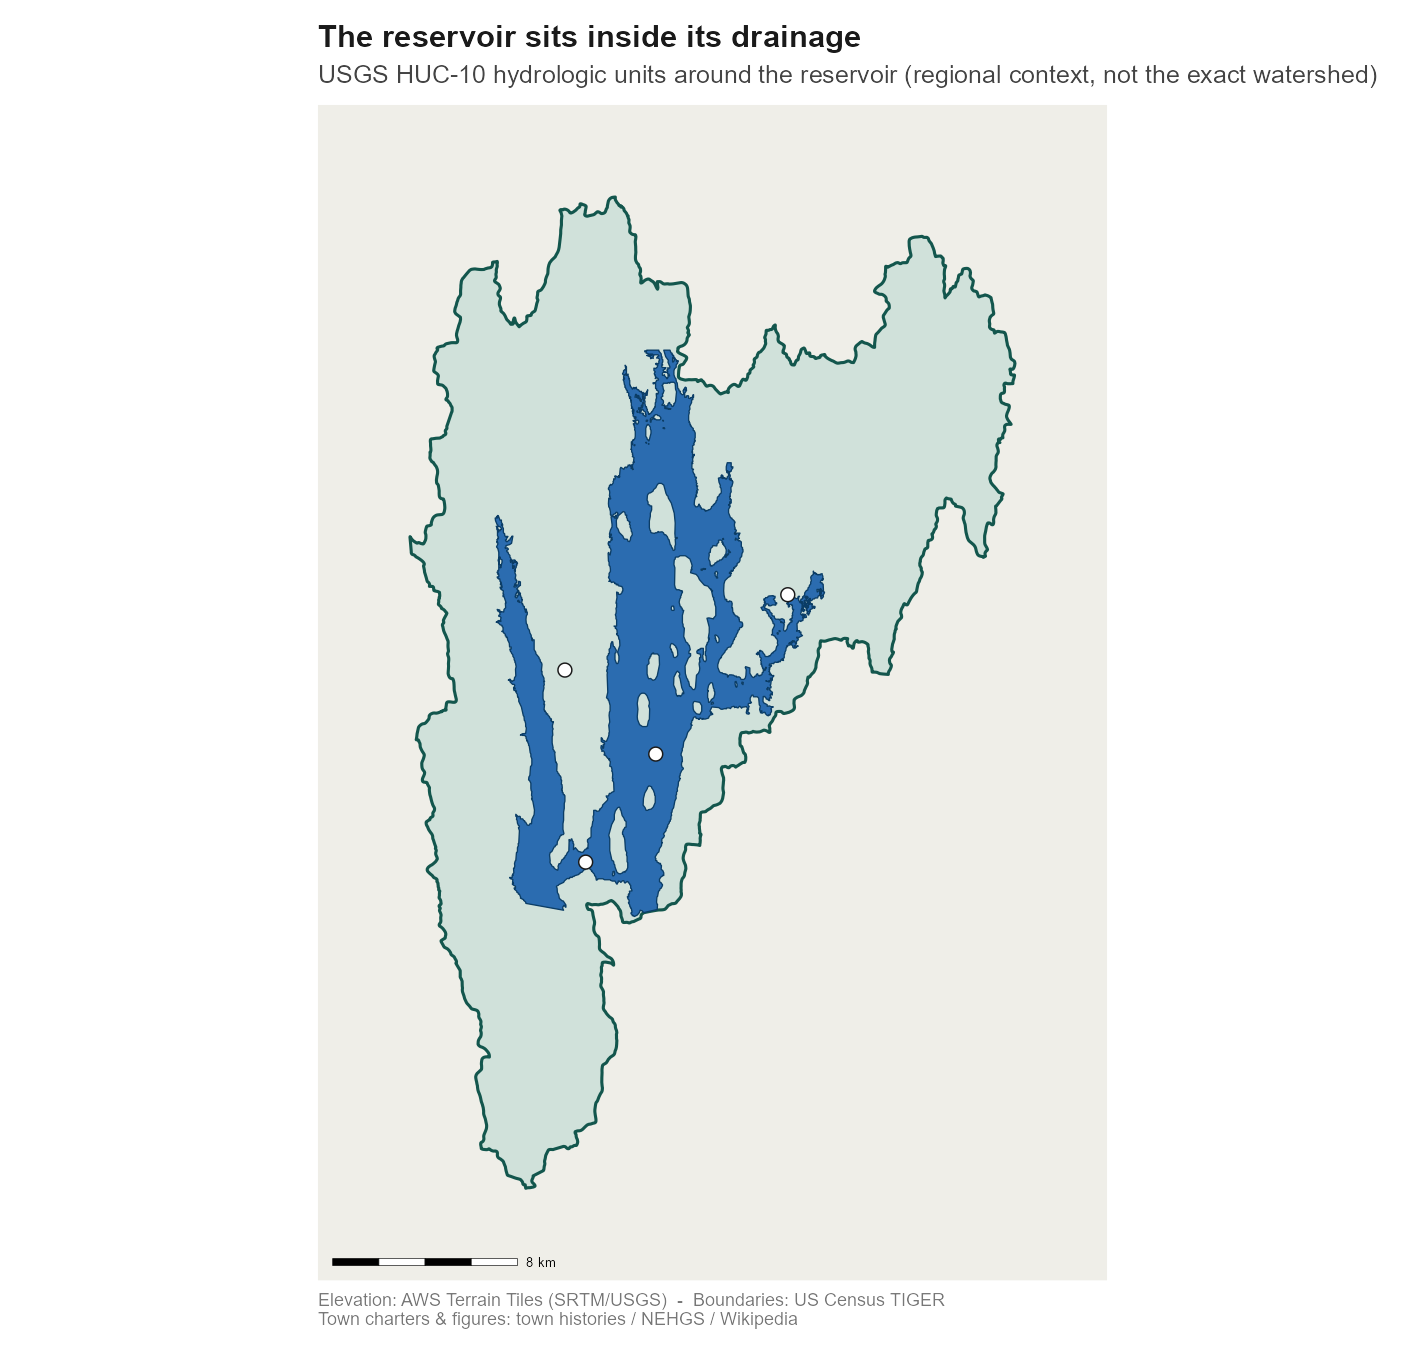
Quabbin: Watershed
Quabbin: Reservoir and Protected Watershed
The reservoir and its protected watershed (USGS WBD).
R
USGS WBD
Hydrology
View full project →
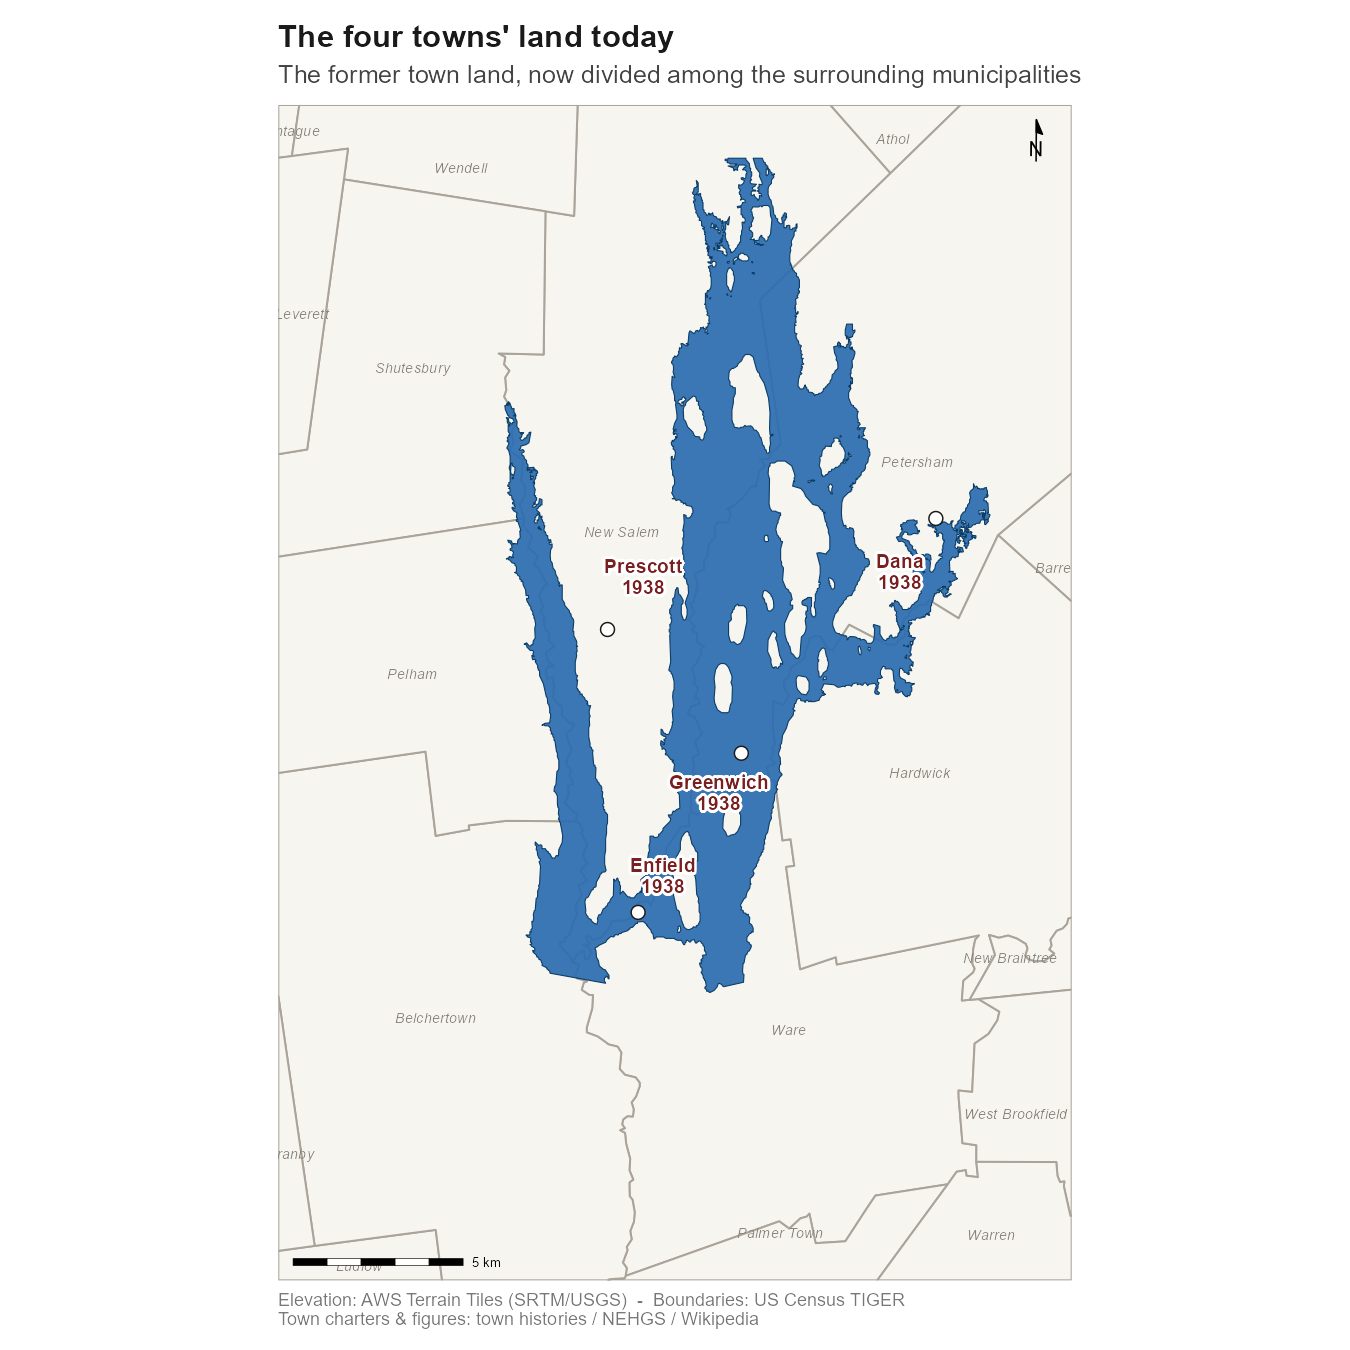
Quabbin: Erasure
Quabbin: Erased From the Map
How the former town land is divided among surrounding towns today.
R
Census TIGER
View full project →
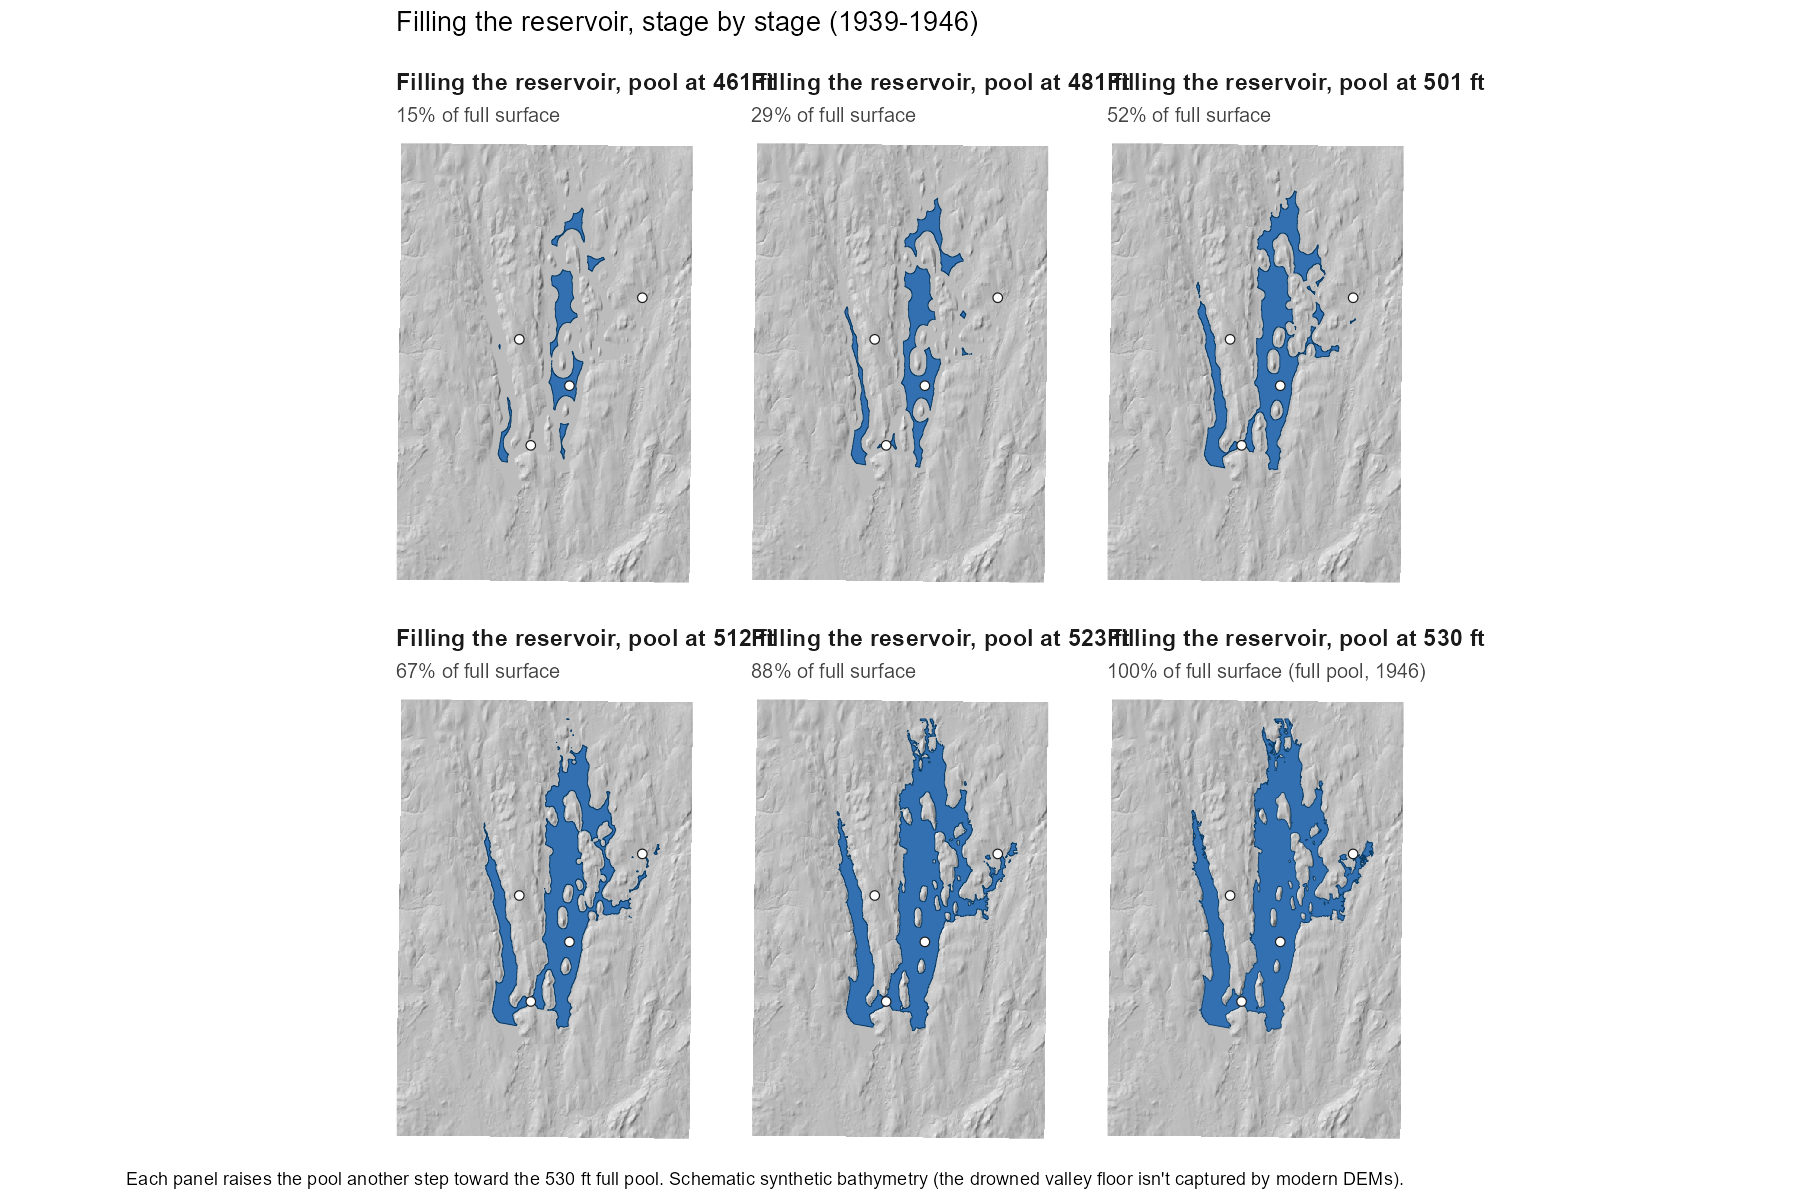
Quabbin: Flood Stages
Quabbin: Filling in Equal-Area Stages
Small multiples of the reservoir filling to its 1946 full pool.
R
Small Multiples
View full project →
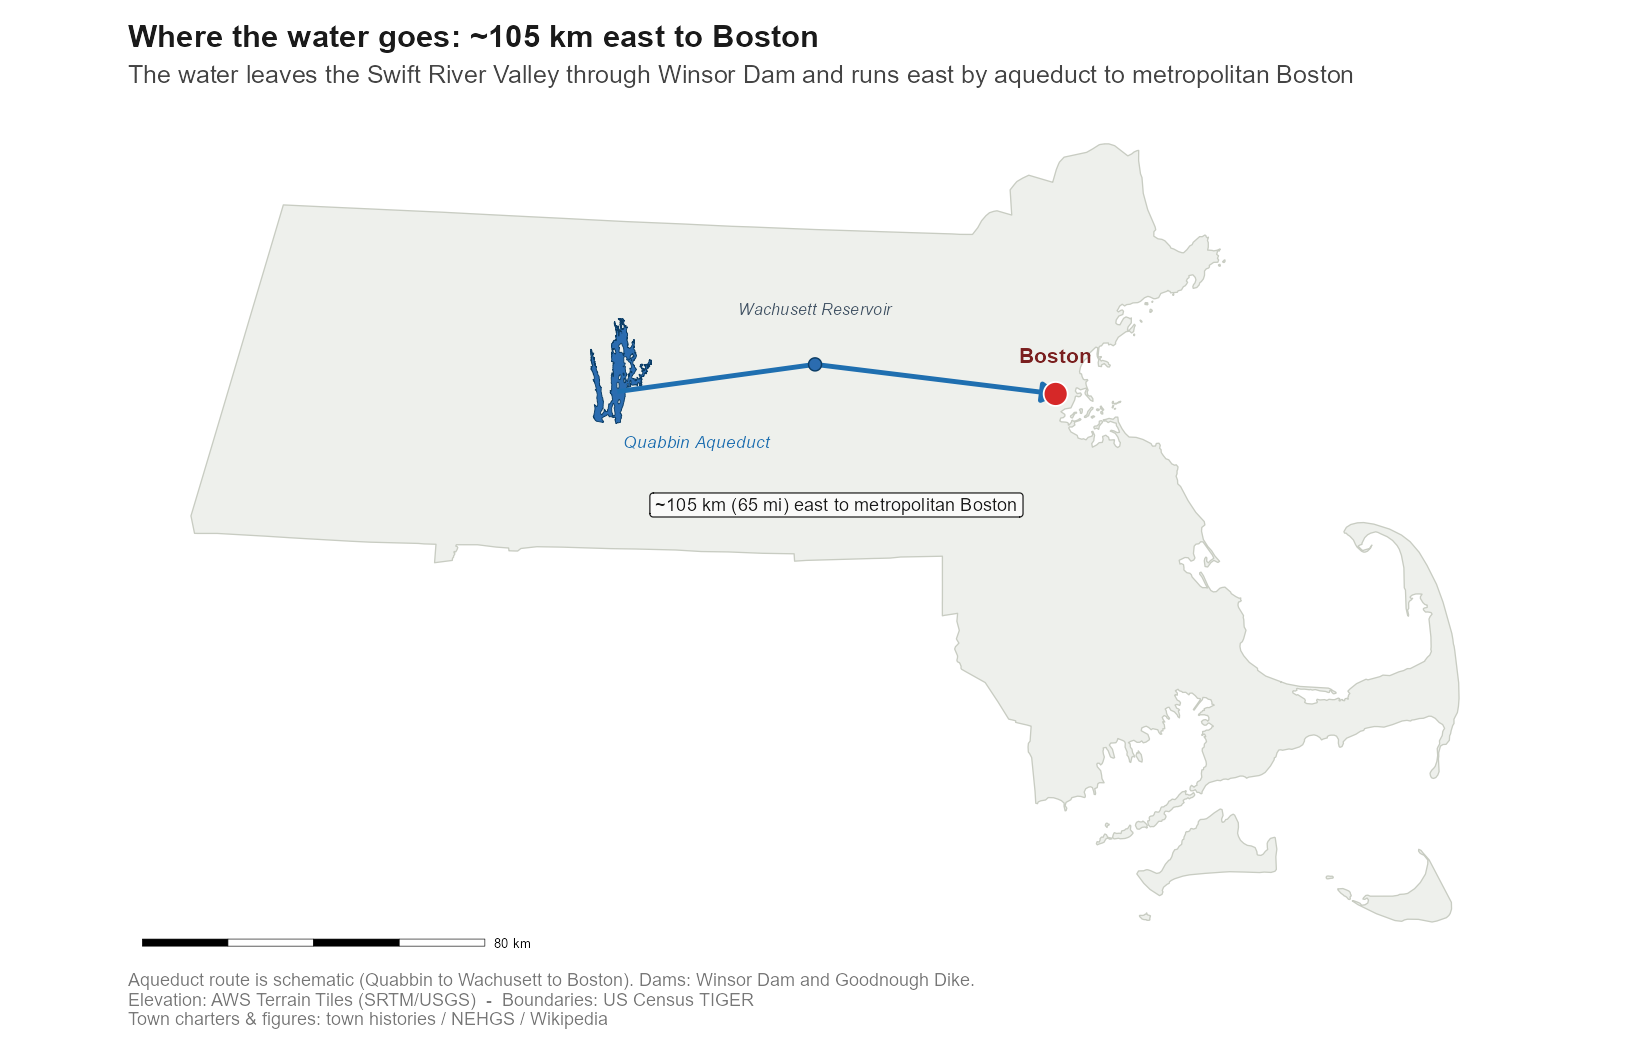
Quabbin: Aqueduct
Quabbin: The Aqueduct to Boston
The aqueduct carrying the water ~105 km east to Boston.
R
sf
Infrastructure
View full project →
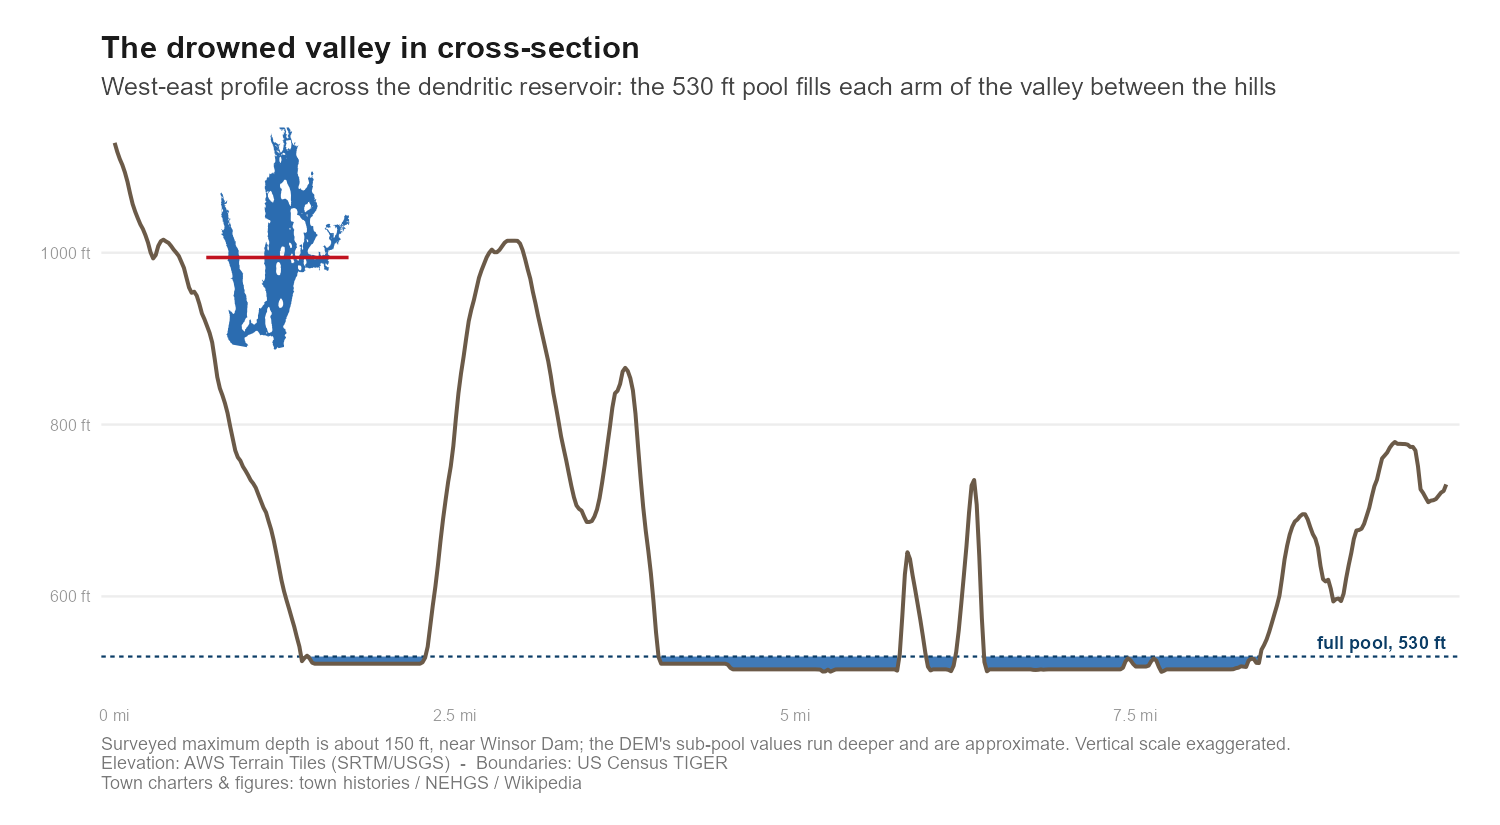
Quabbin: Cross-Section
Quabbin: The Drowned Valley in Cross-Section
A west-to-east elevation profile across the flooded valley.
R
terra
Profile
View full project →
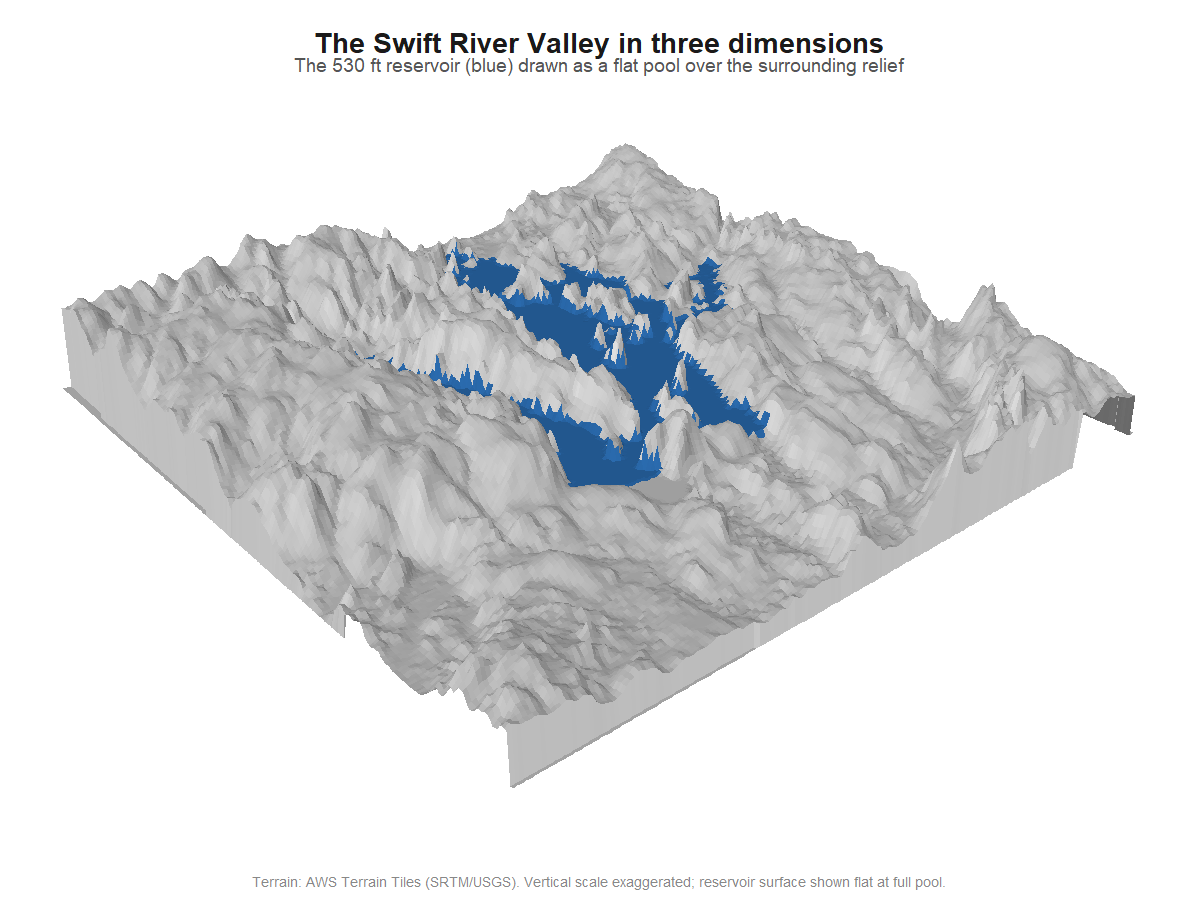
Quabbin: 3D Terrain
Quabbin: The Valley in Three Dimensions
A 3D terrain view of the Swift River Valley.
R
terra
3D
View full project →
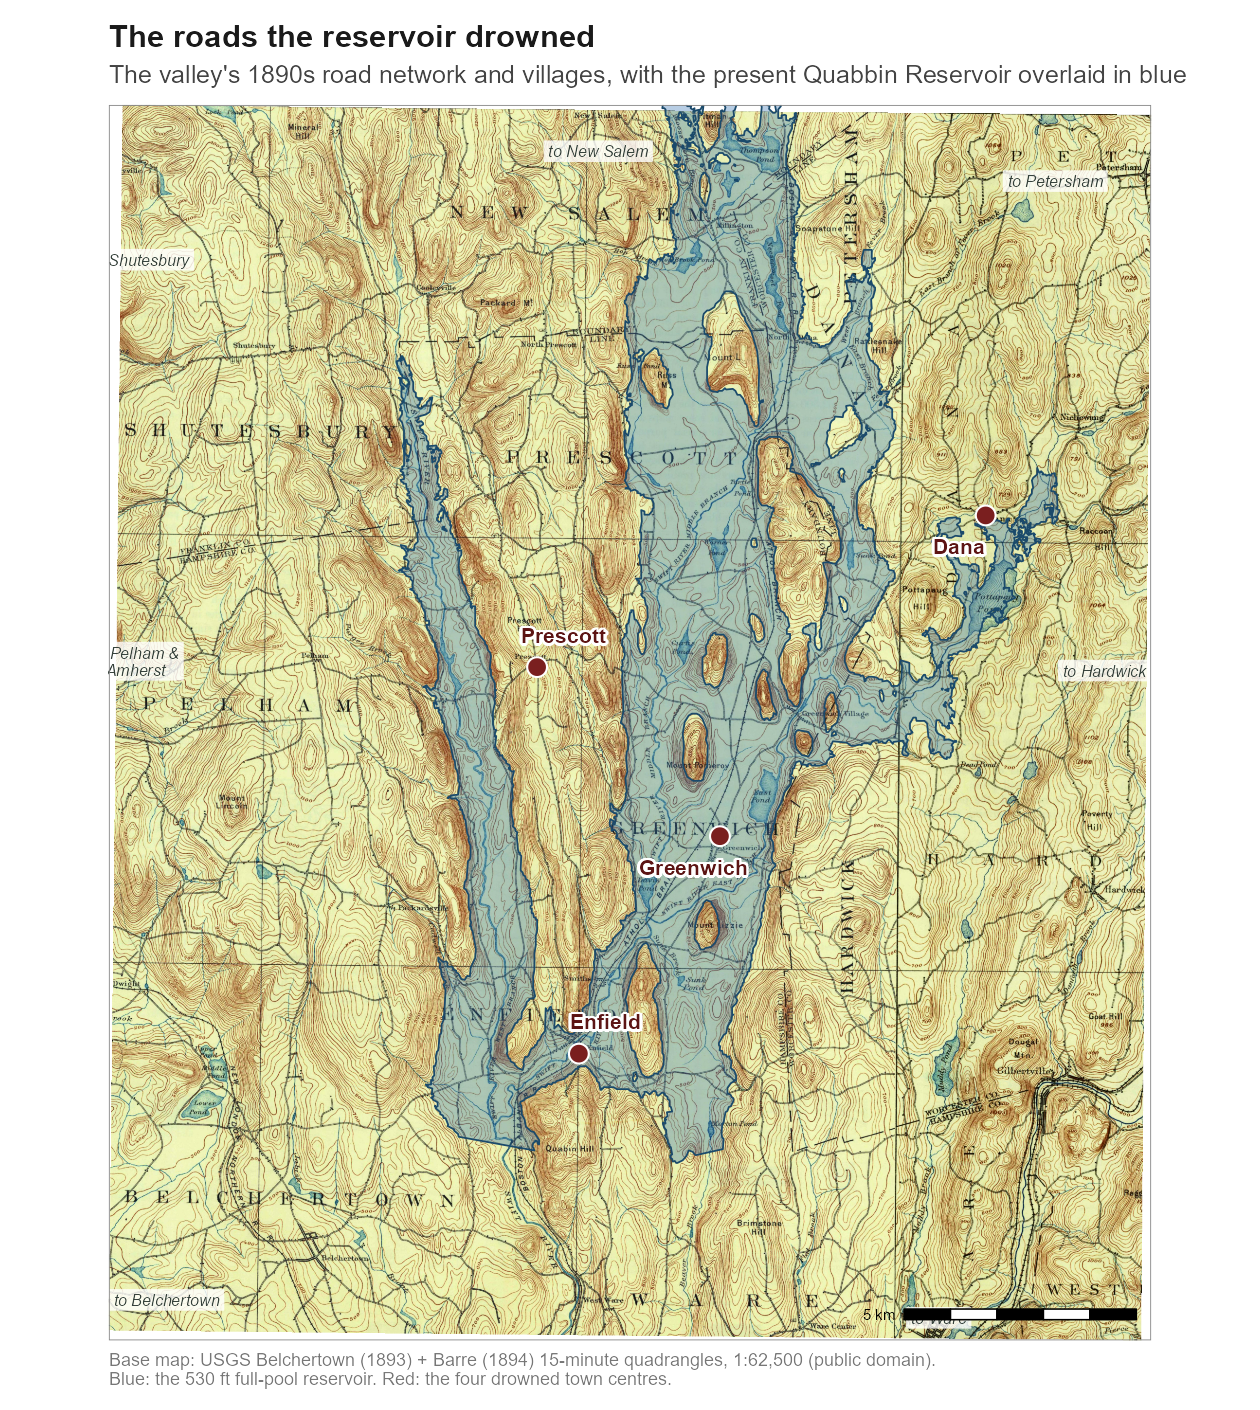
Quabbin: Drowned Roads
Quabbin: The Roads the Reservoir Drowned
The pre-flood street network now beneath the water.
R
OpenStreetMap
Historical
View full project →
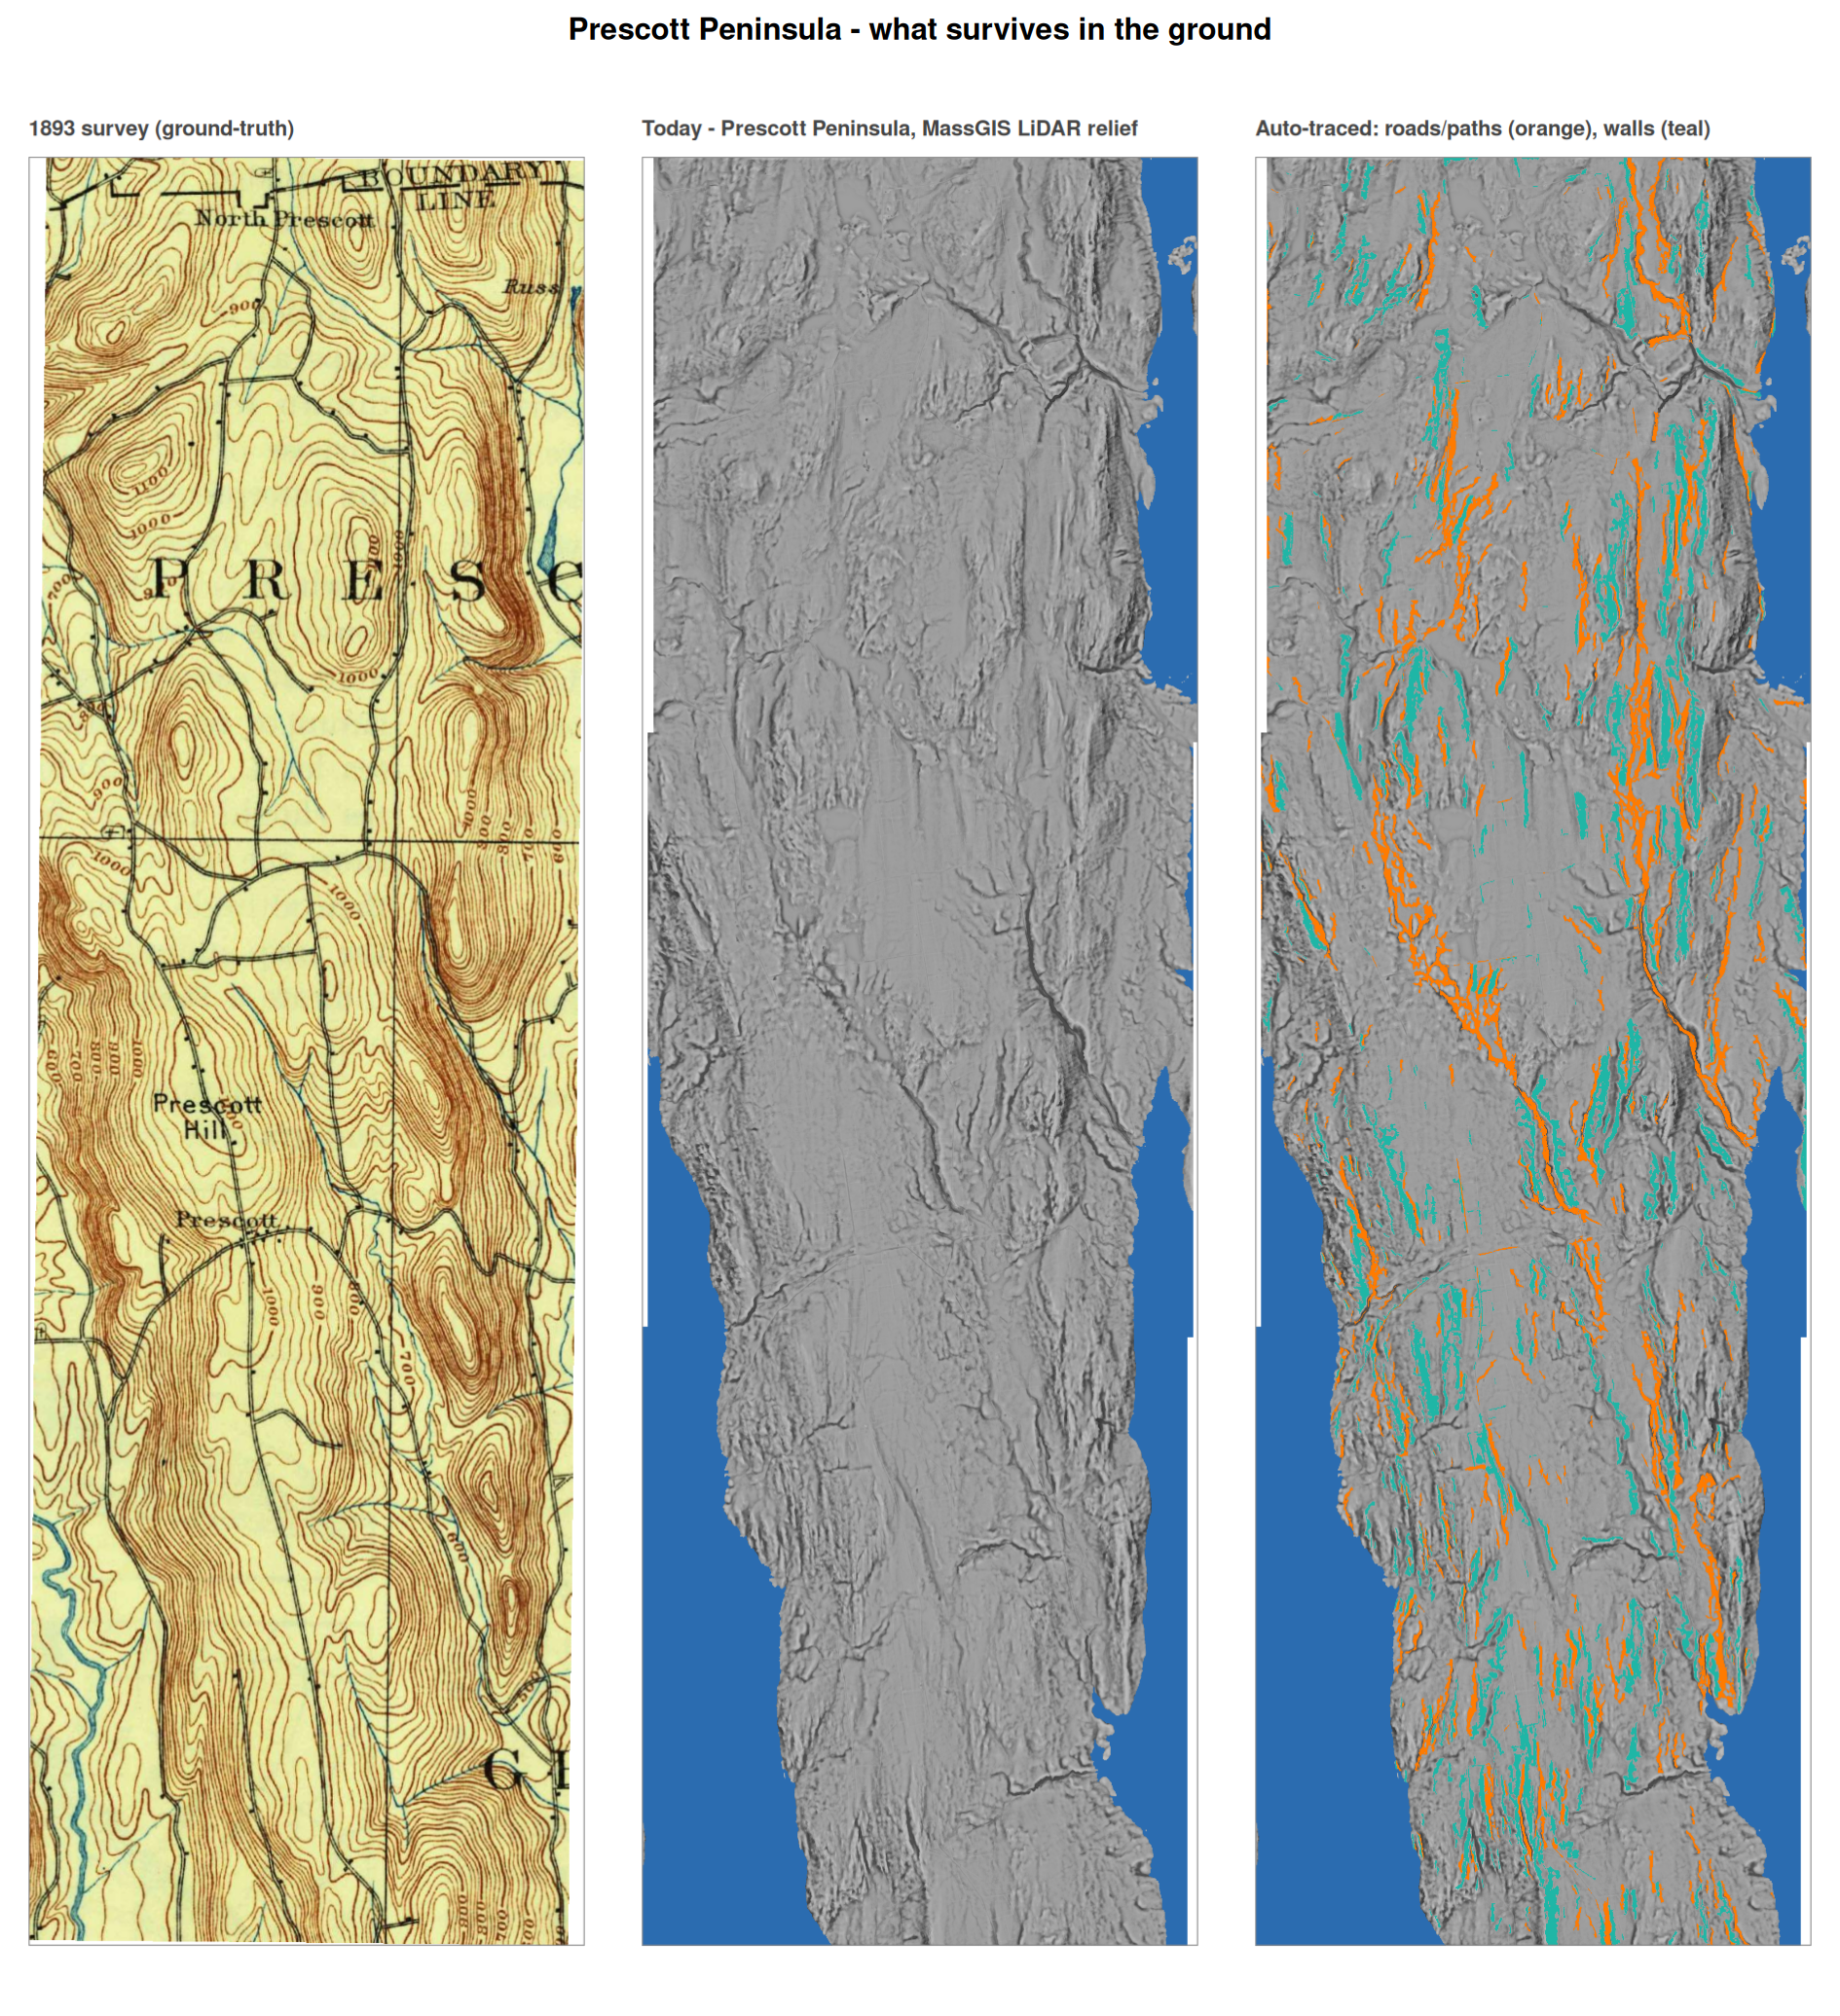
Quabbin: Prescott LiDAR
Quabbin: Prescott Peninsula in 1 m LiDAR
Roads and foundations still legible in 1 m LiDAR.
LiDAR
Hillshade
R
View full project →
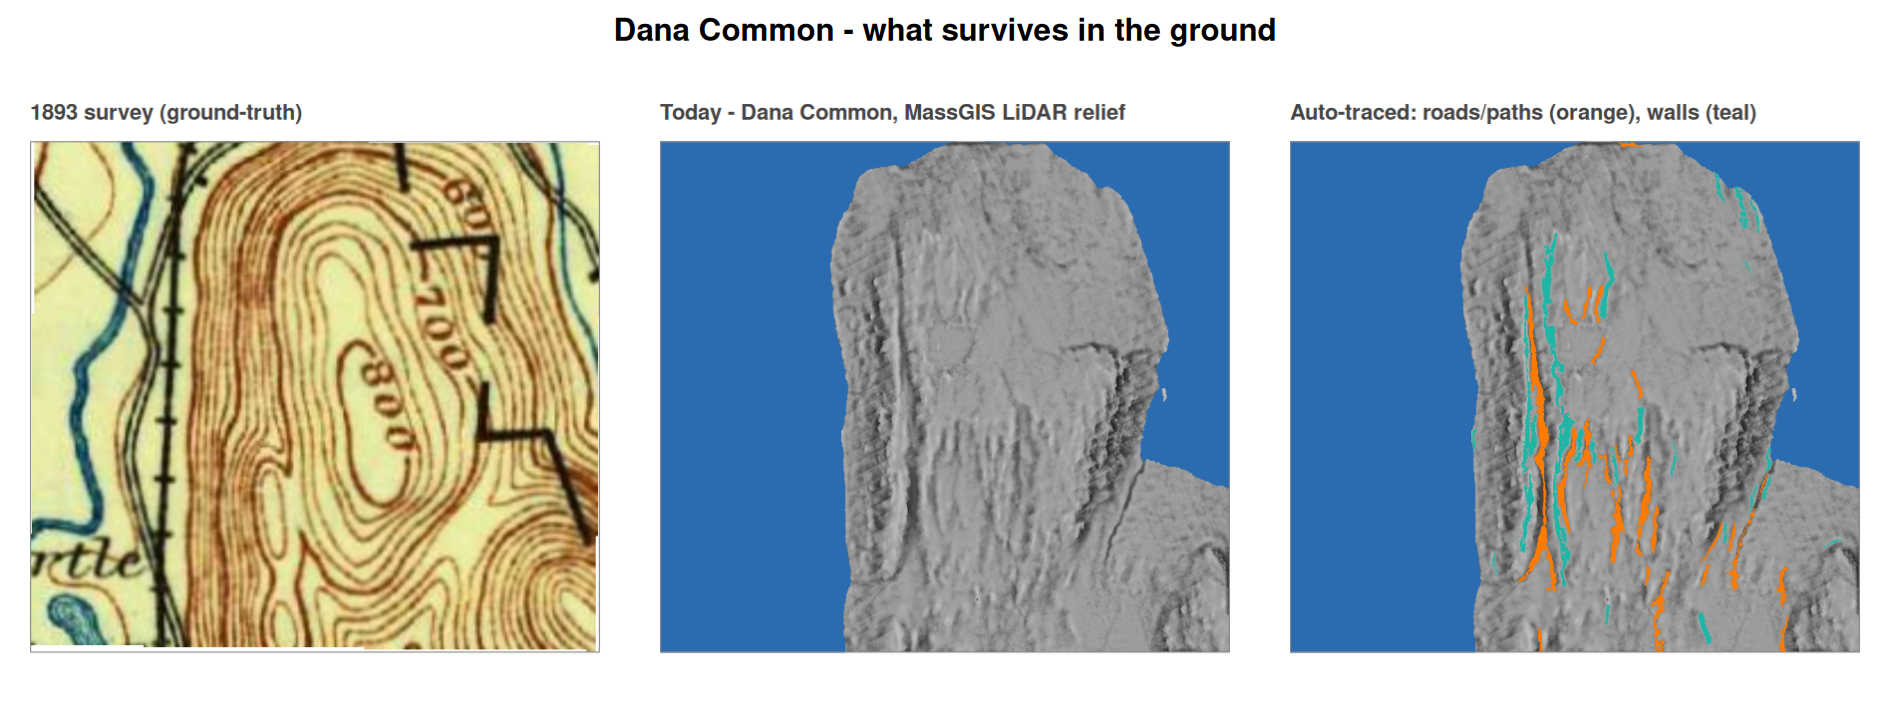
Quabbin: Dana Survey
Quabbin: Dana — Above the Waterline
Town map, LiDAR hillshade, and traced roads & cellar holes above water.
LiDAR
R
Historical
View full project →
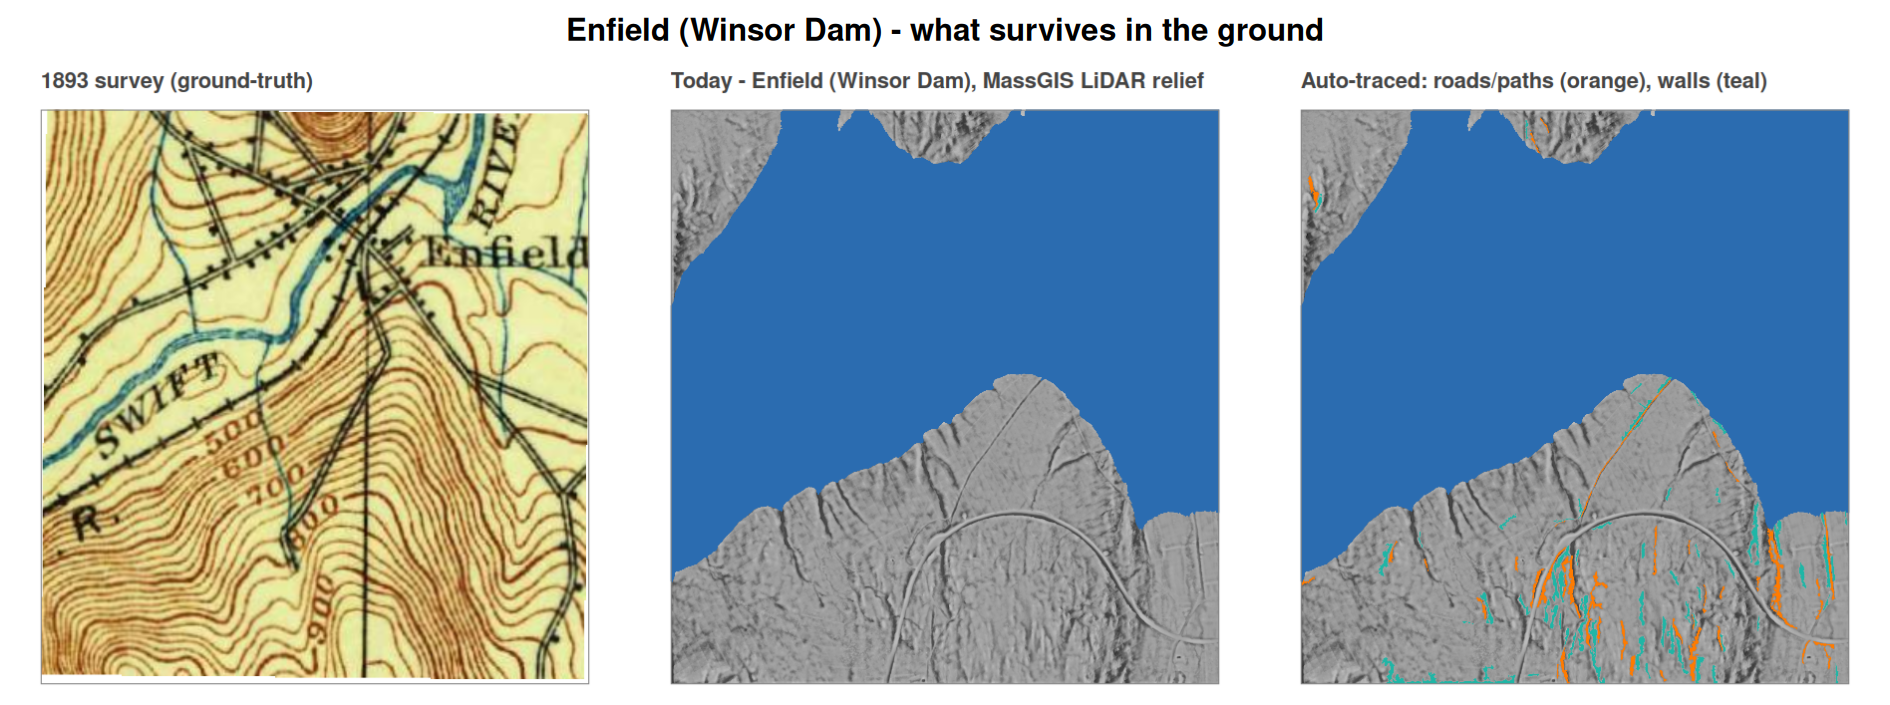
Quabbin: Enfield Survey
Quabbin: Enfield Beneath the Reservoir
The valley seat, now almost entirely underwater.
LiDAR
R
Historical
View full project →
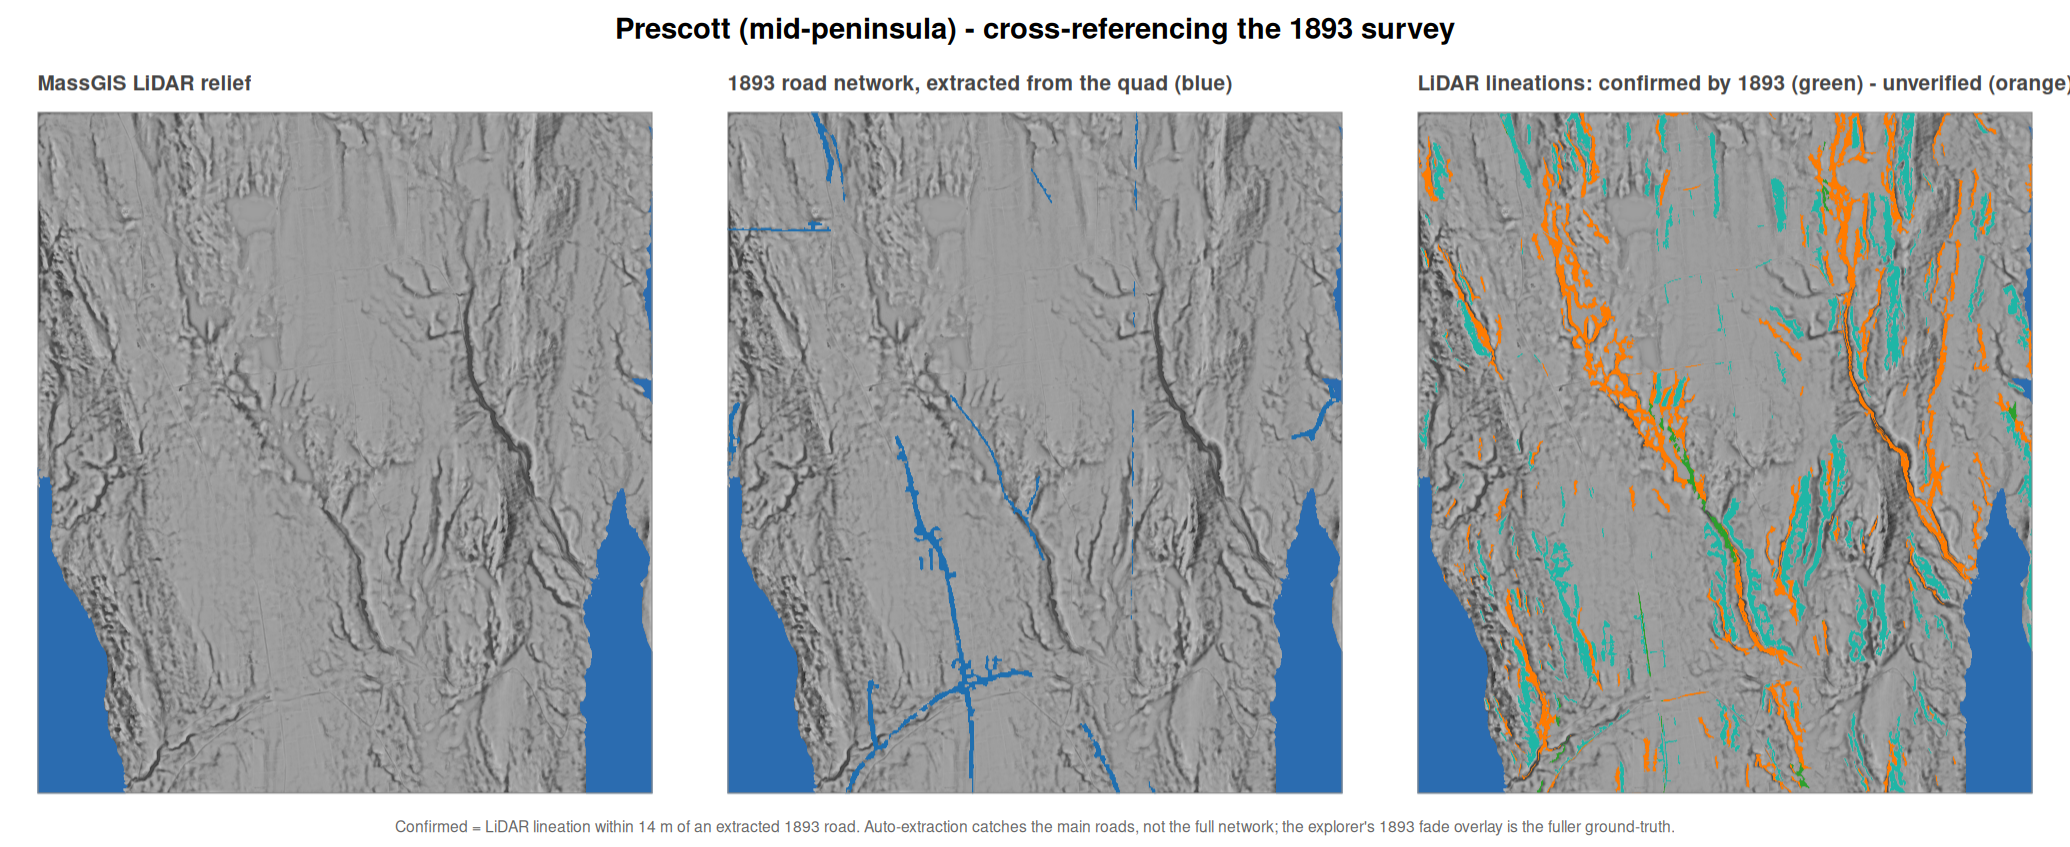
Quabbin: Ground-Truth
Quabbin: 1893 Roads Cross-Referenced to LiDAR
1893 USGS roads checked against the LiDAR traces.
LiDAR
USGS
R
View full project →
Quabbin: Animation
Quabbin: The Reservoir Filling (Animation)
An animation of the reservoir filling to its 1946 full pool.
R
ImageMagick
Animation
View full project →
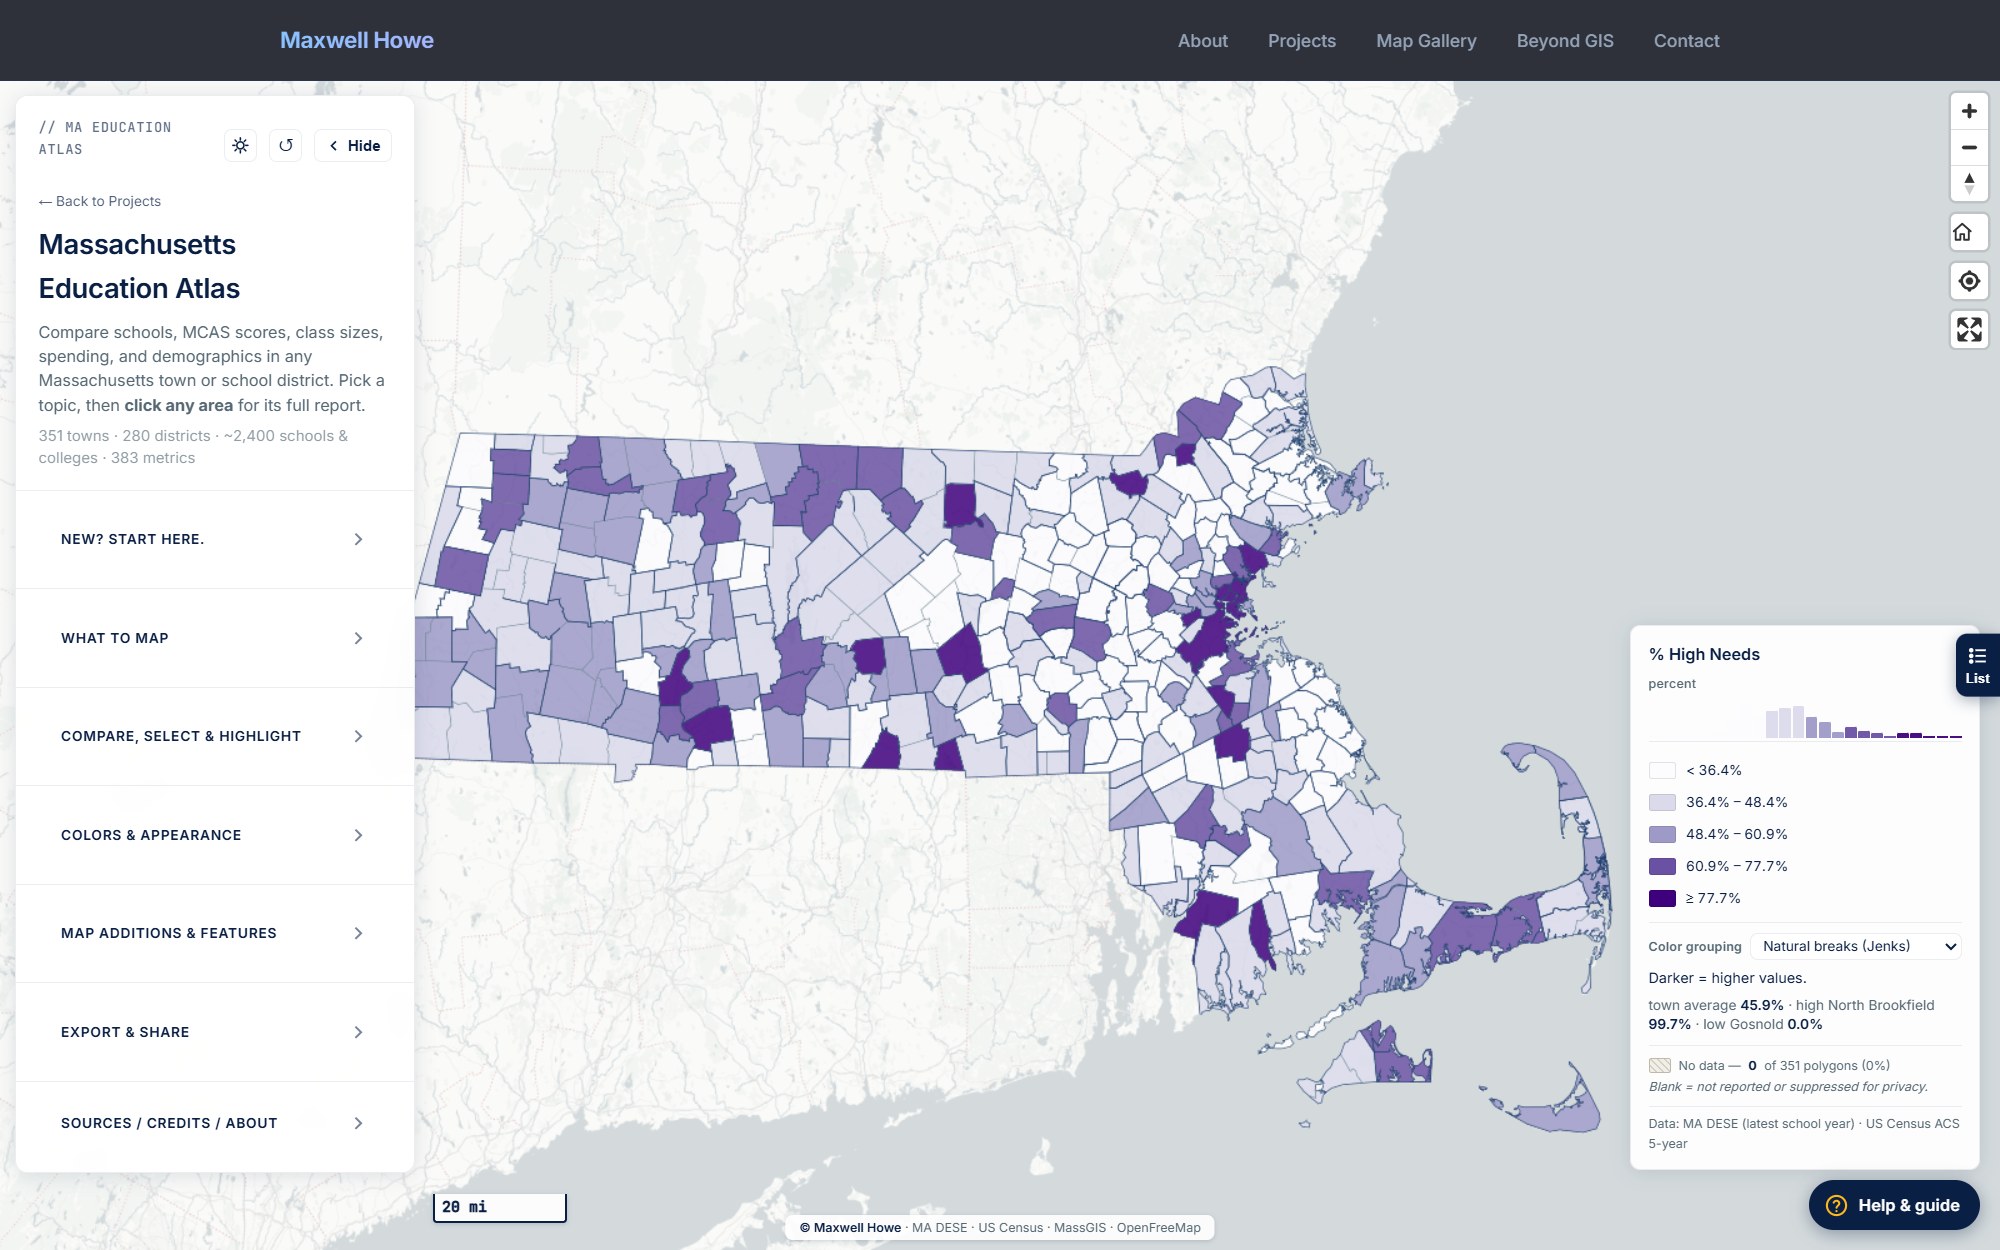
Atlas: High Needs
MA Atlas: % High Needs by Town
One of 380+ mapped metrics, Fisher-Jenks breaks.
MapLibre GL
Choropleth
MA DESE
View full project →
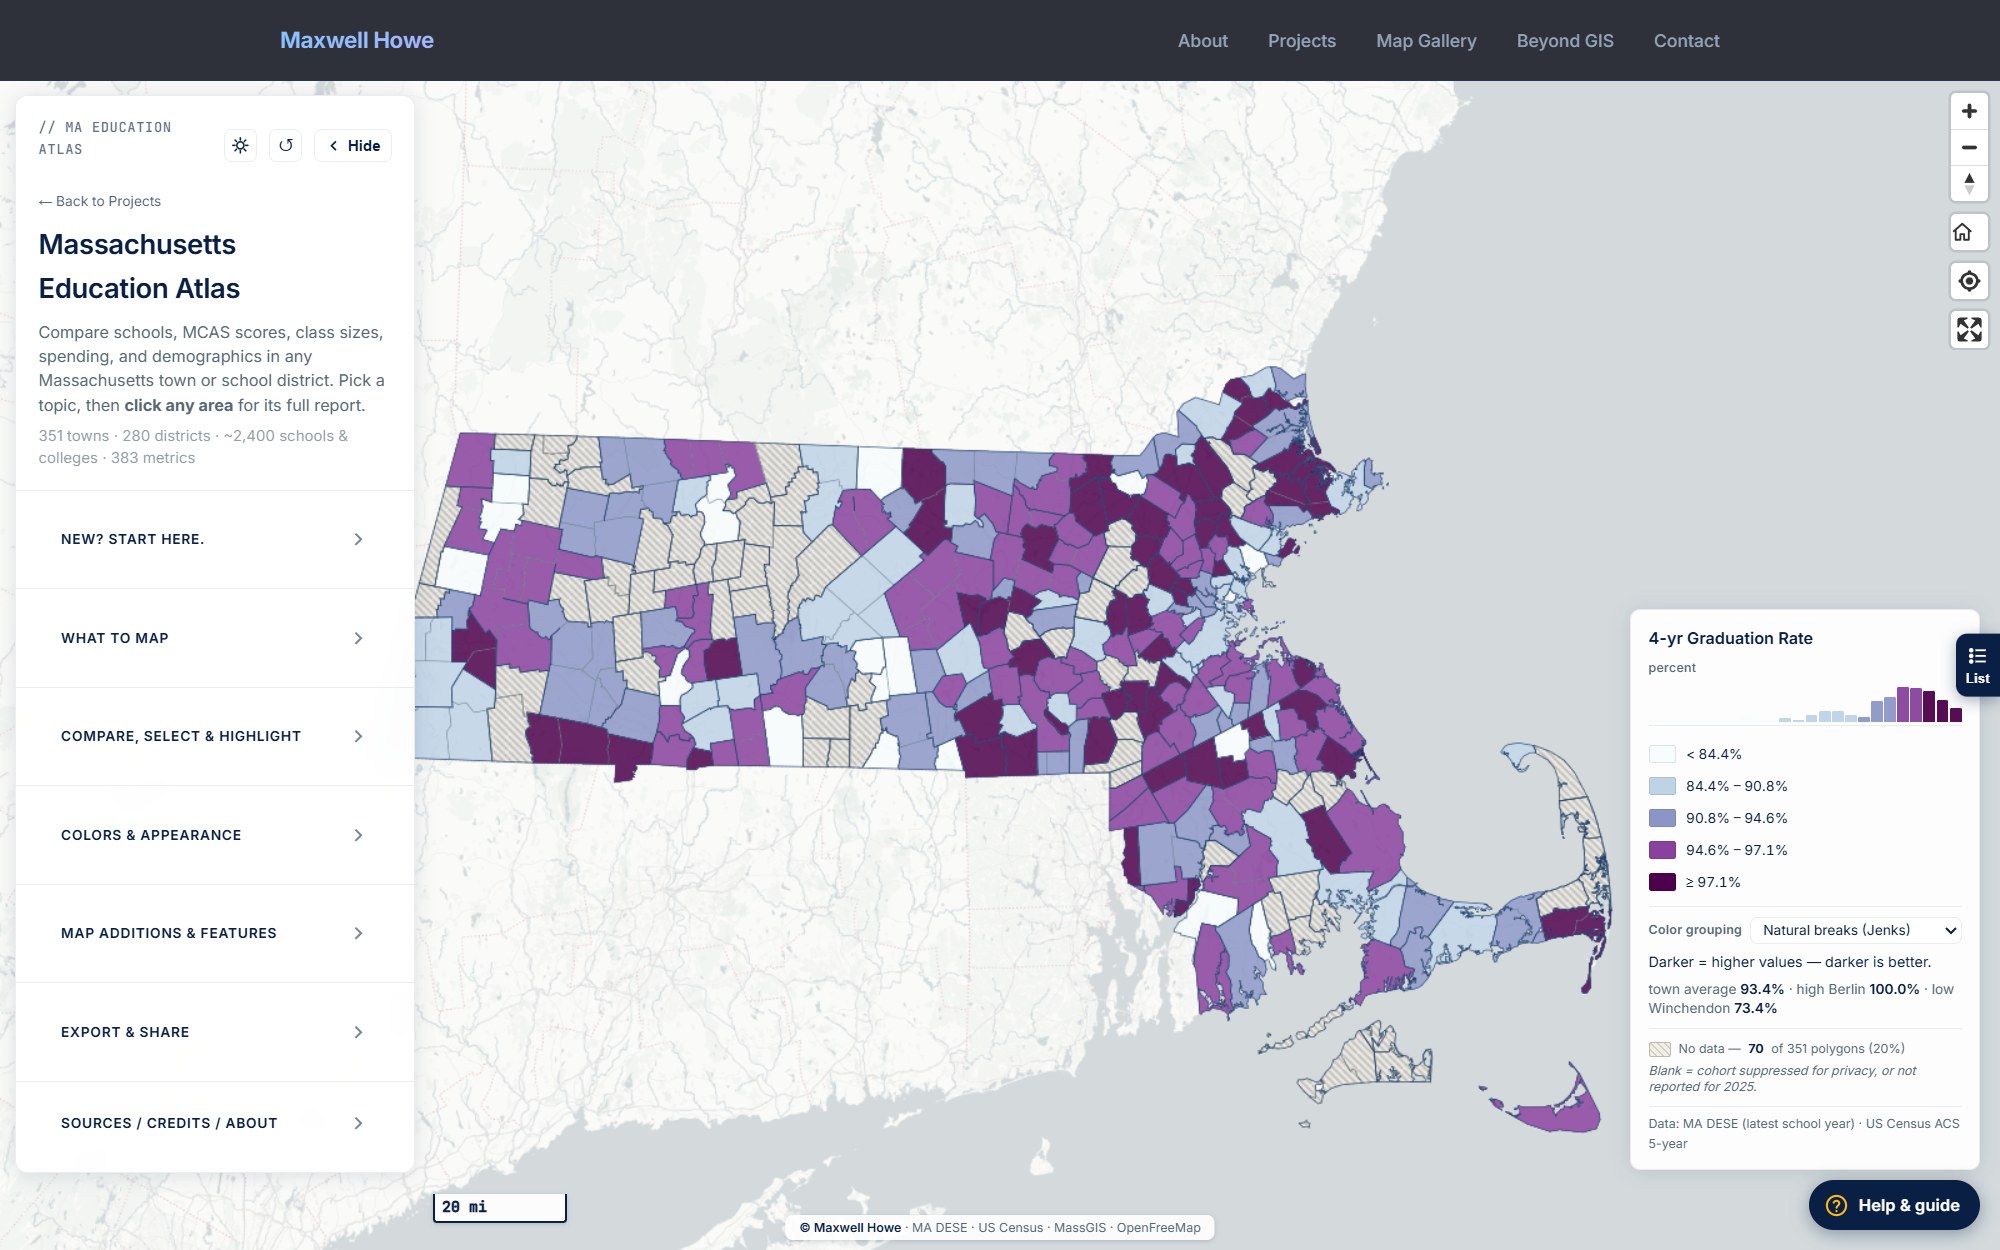
Atlas: Graduation
MA Atlas: Four-Year Graduation Rate
Four-year cohort graduation rate by town.
MapLibre GL
Choropleth
MA DESE
View full project →
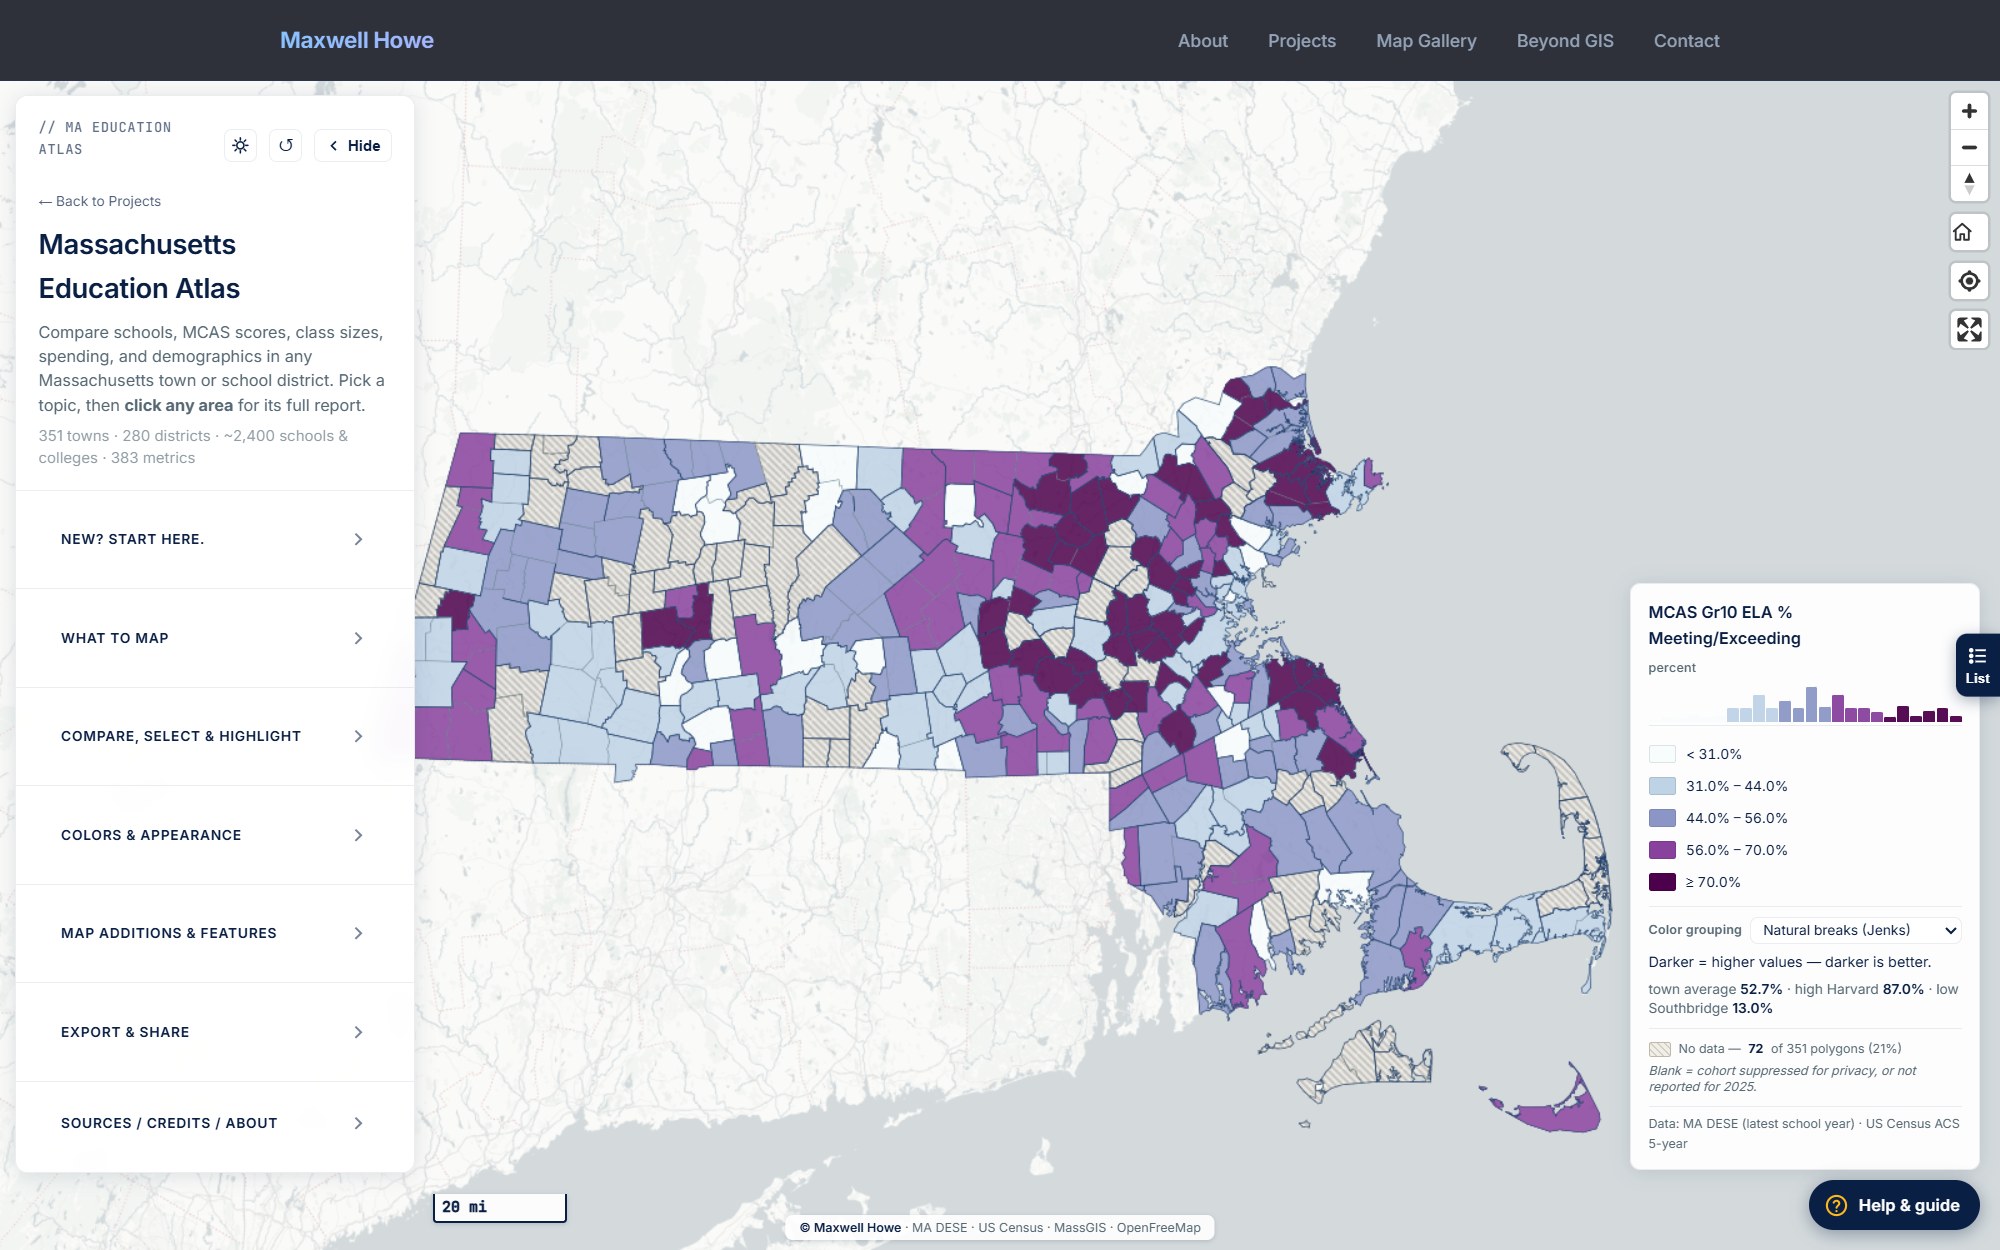
Atlas: MCAS ELA
MA Atlas: MCAS Grade 10 ELA
% meeting or exceeding on Grade 10 ELA.
MapLibre GL
Choropleth
MA DESE
View full project →
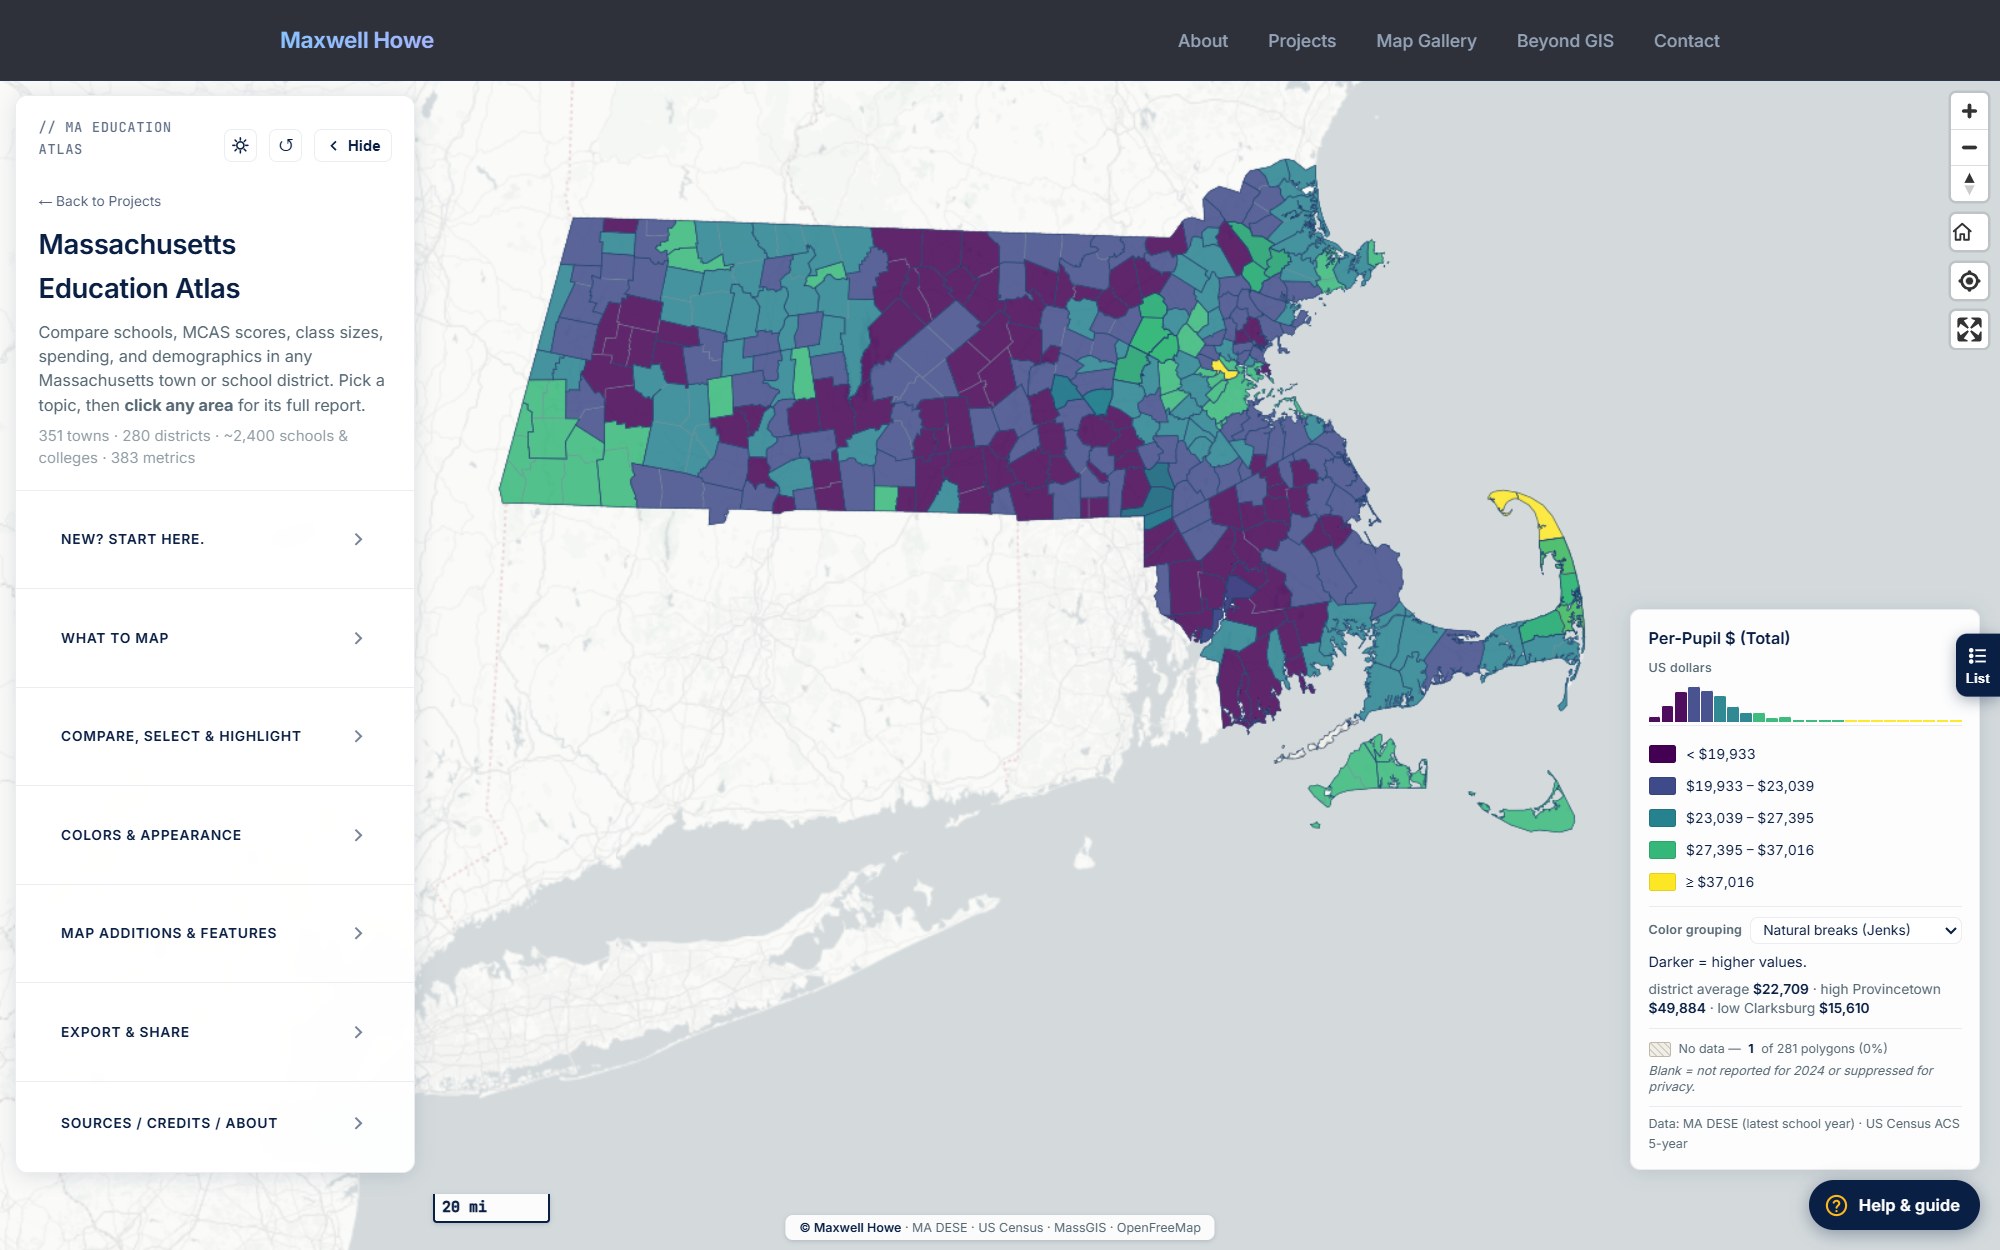
Atlas: Spending
MA Atlas: Per-Pupil Spending
Per-pupil spending by district (Viridis ramp).
MapLibre GL
Choropleth
Finance
View full project →
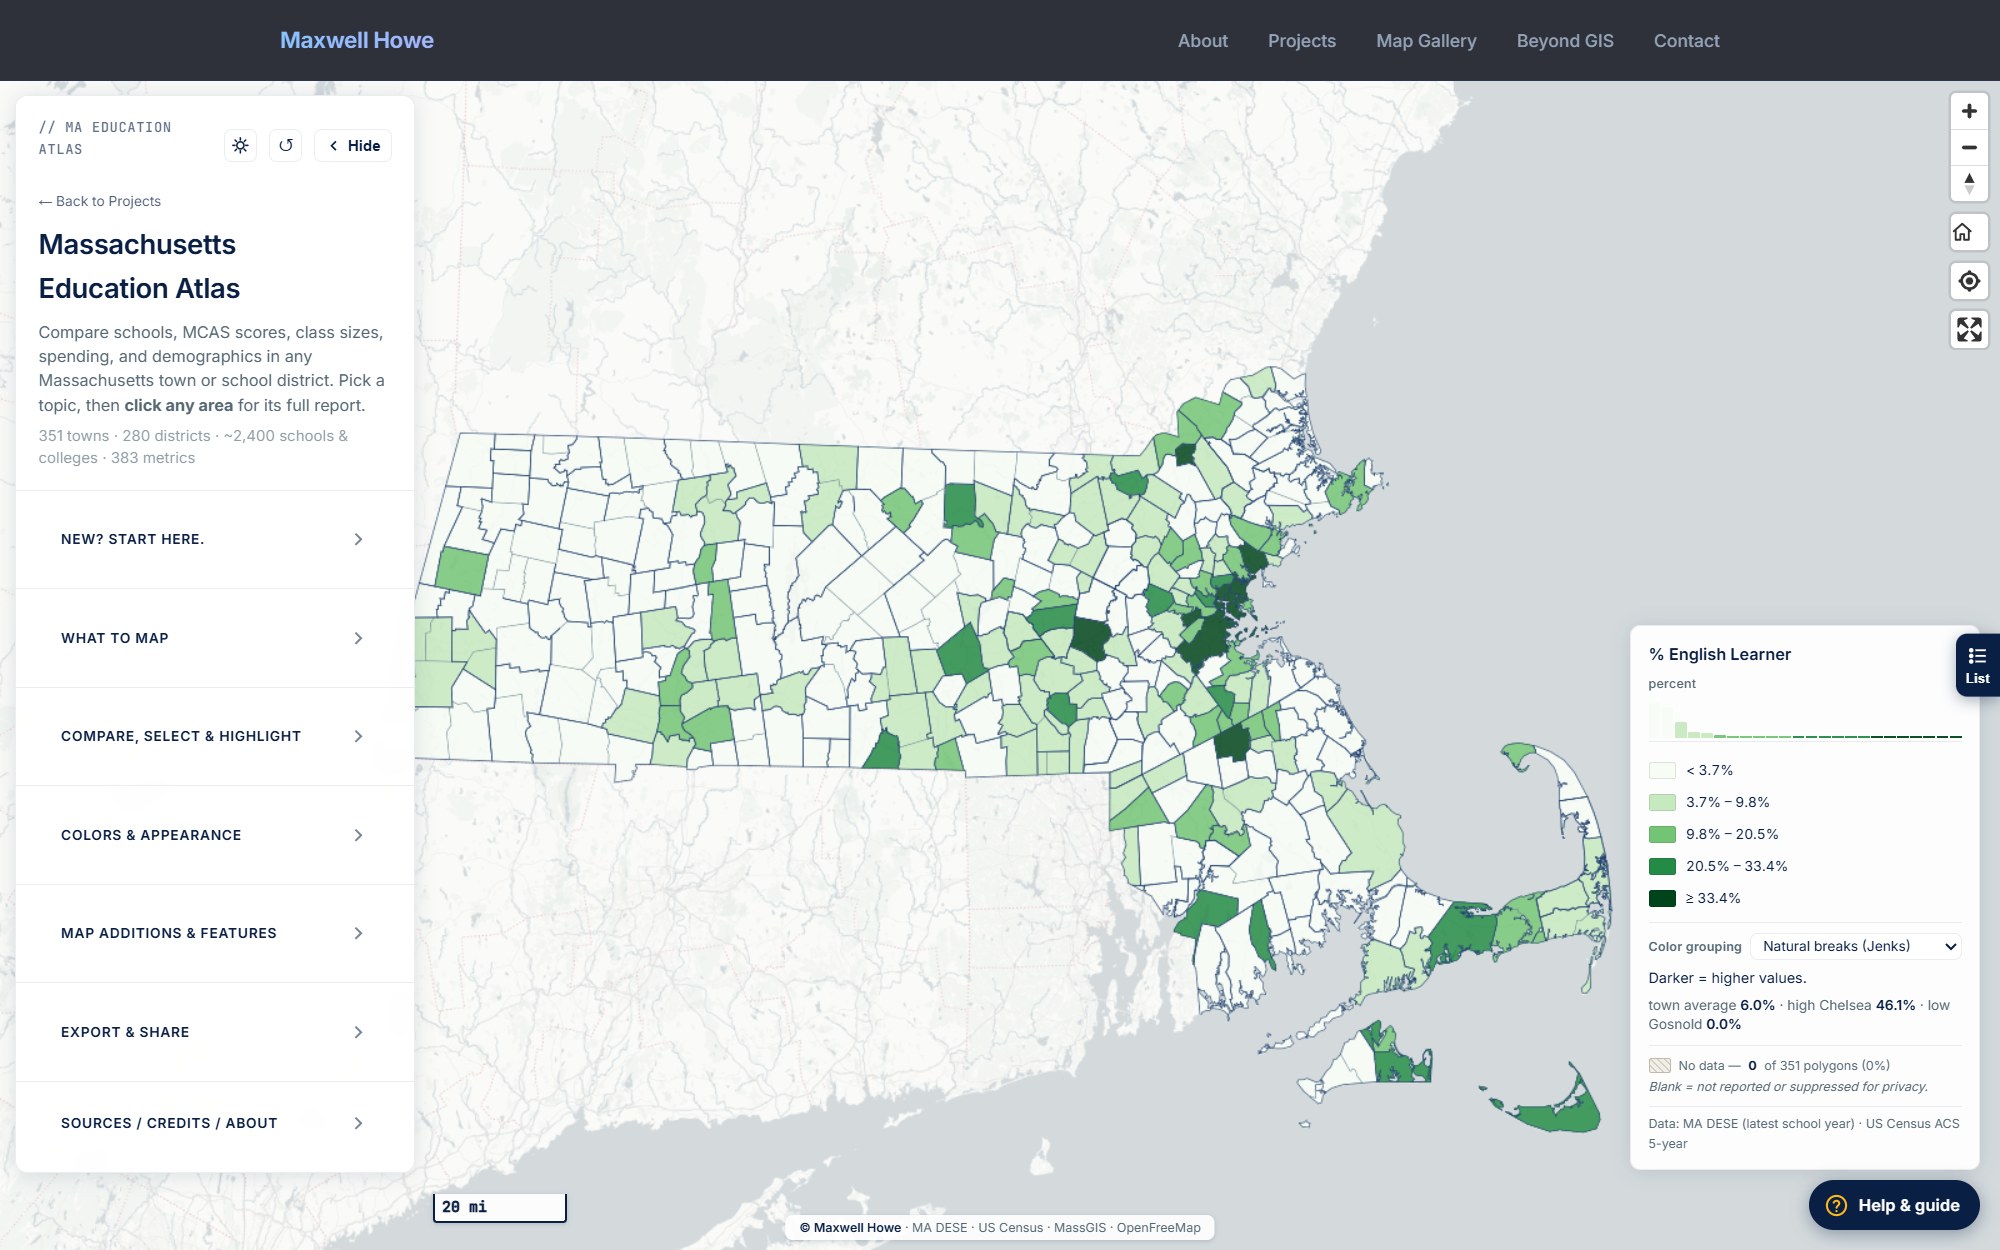
Atlas: English Learners
MA Atlas: % English Learners
Share of English learners by town.
MapLibre GL
Choropleth
MA DESE
View full project →
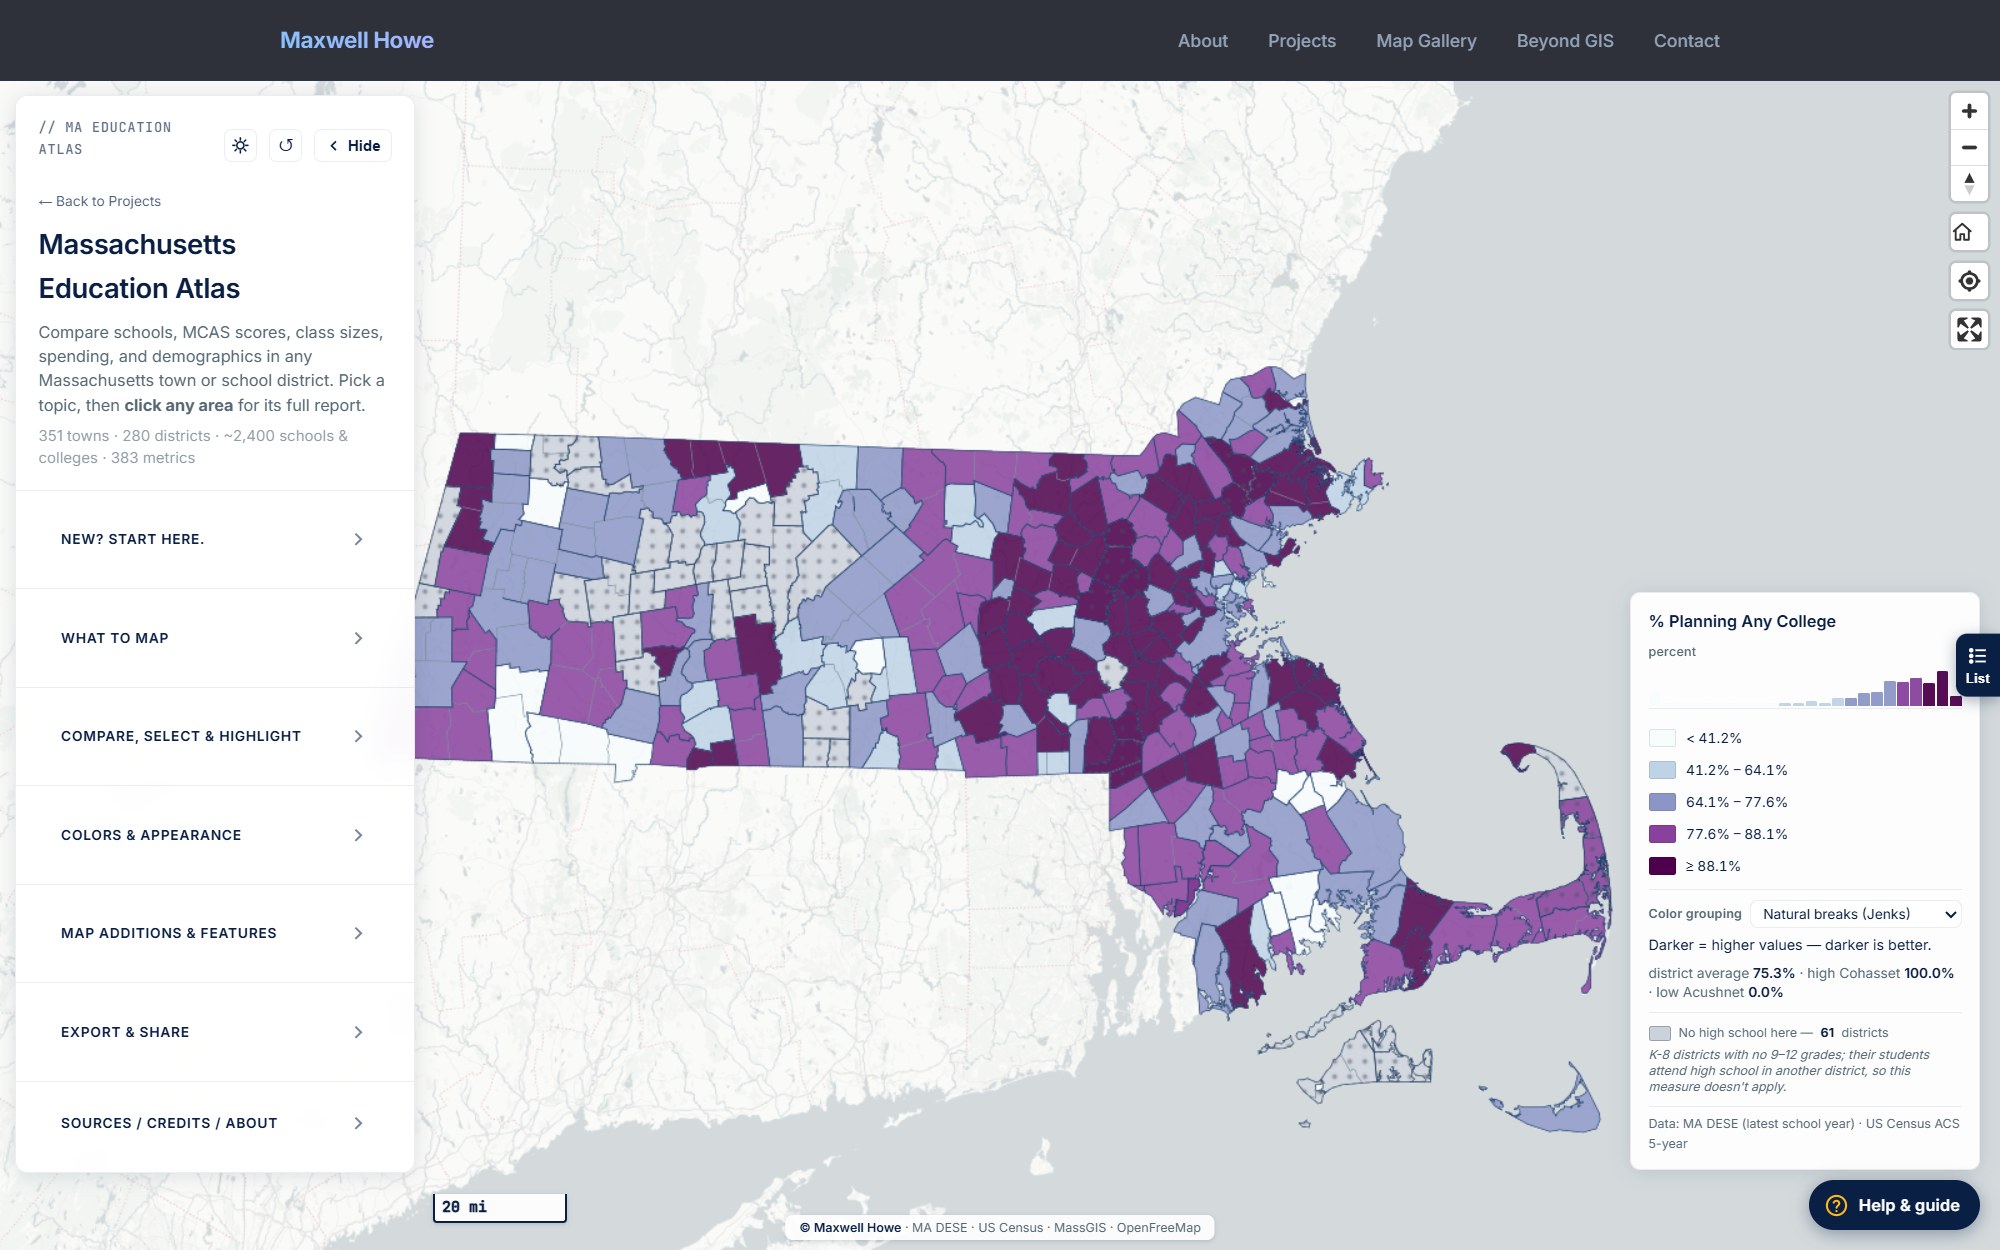
Atlas: College Plans
MA Atlas: % Planning College
College plans, on the academic-district polygons.
MapLibre GL
Choropleth
Districts
View full project →
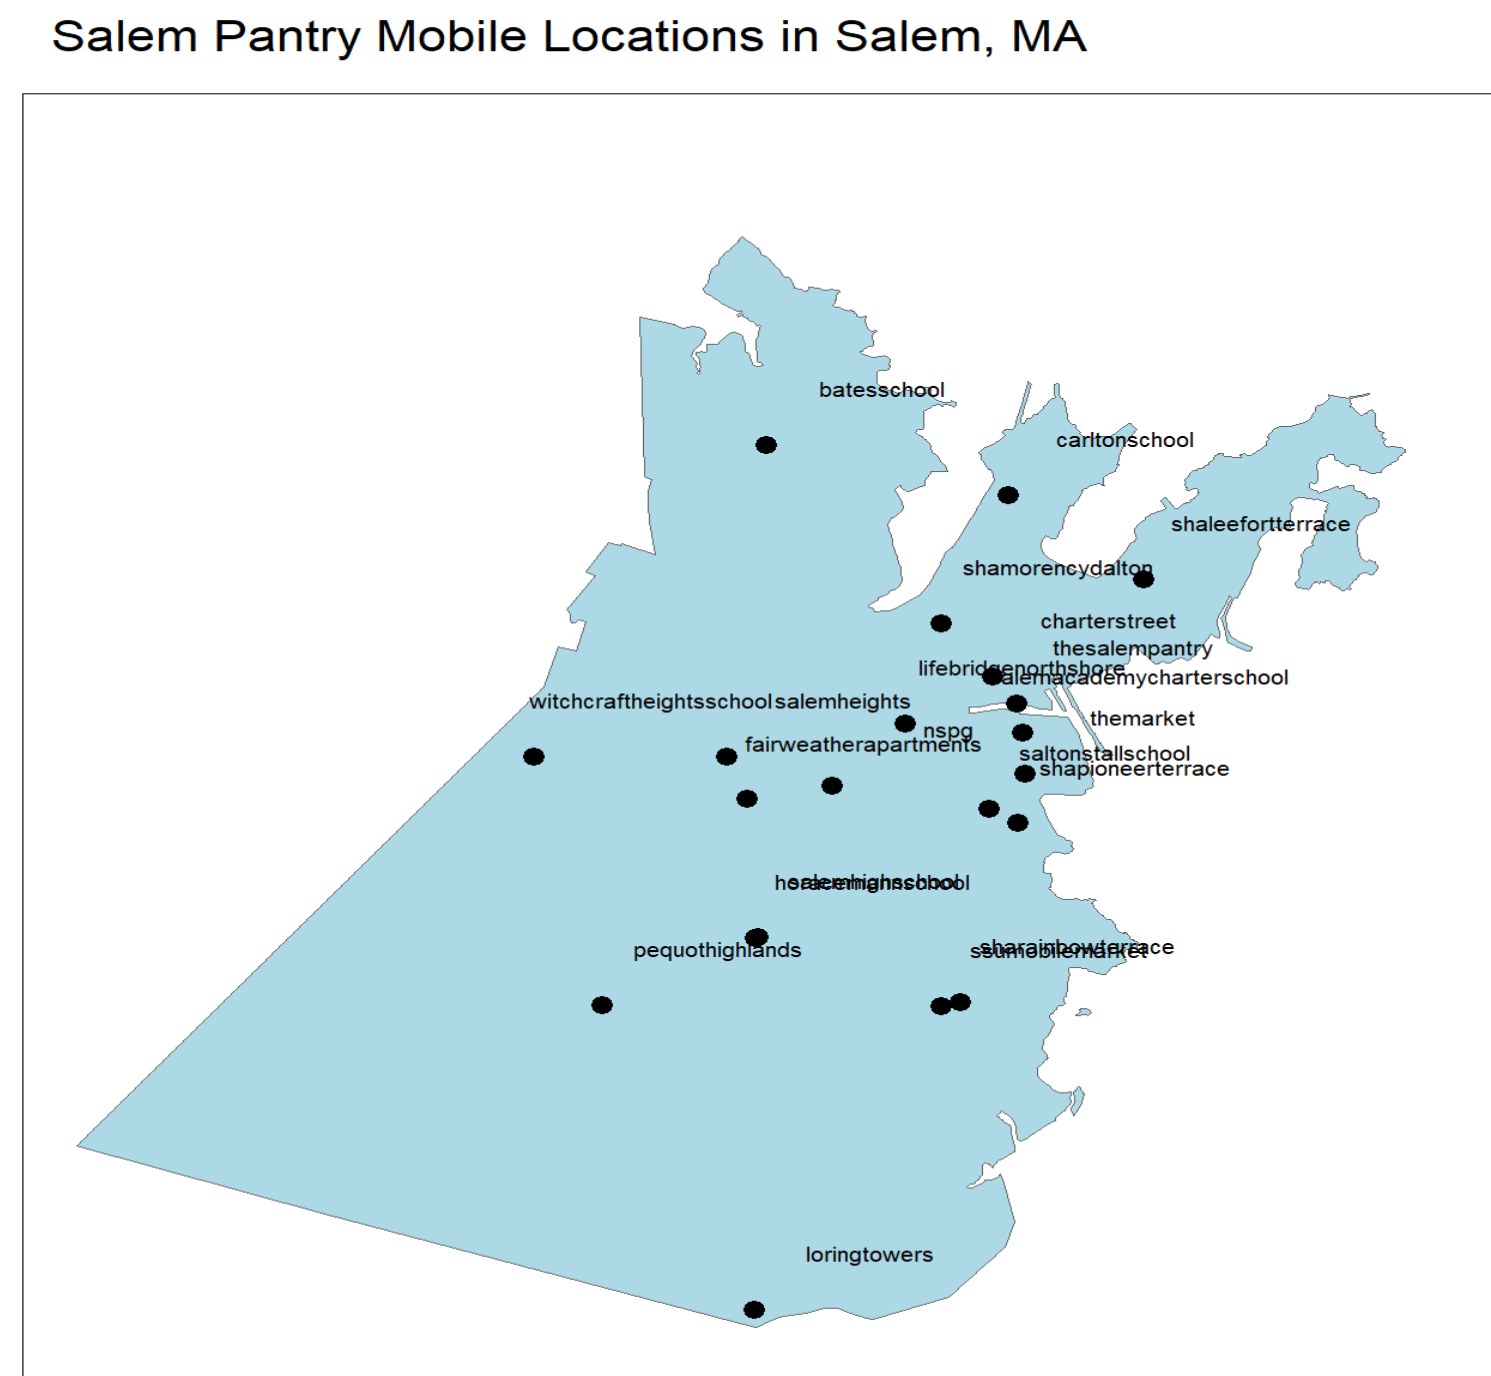
Salem Pantry: Mobile Sites
Salem Pantry: Mobile Distribution Locations
Where the pantry's mobile distributions reach.
R
Salem Pantry
Mapping
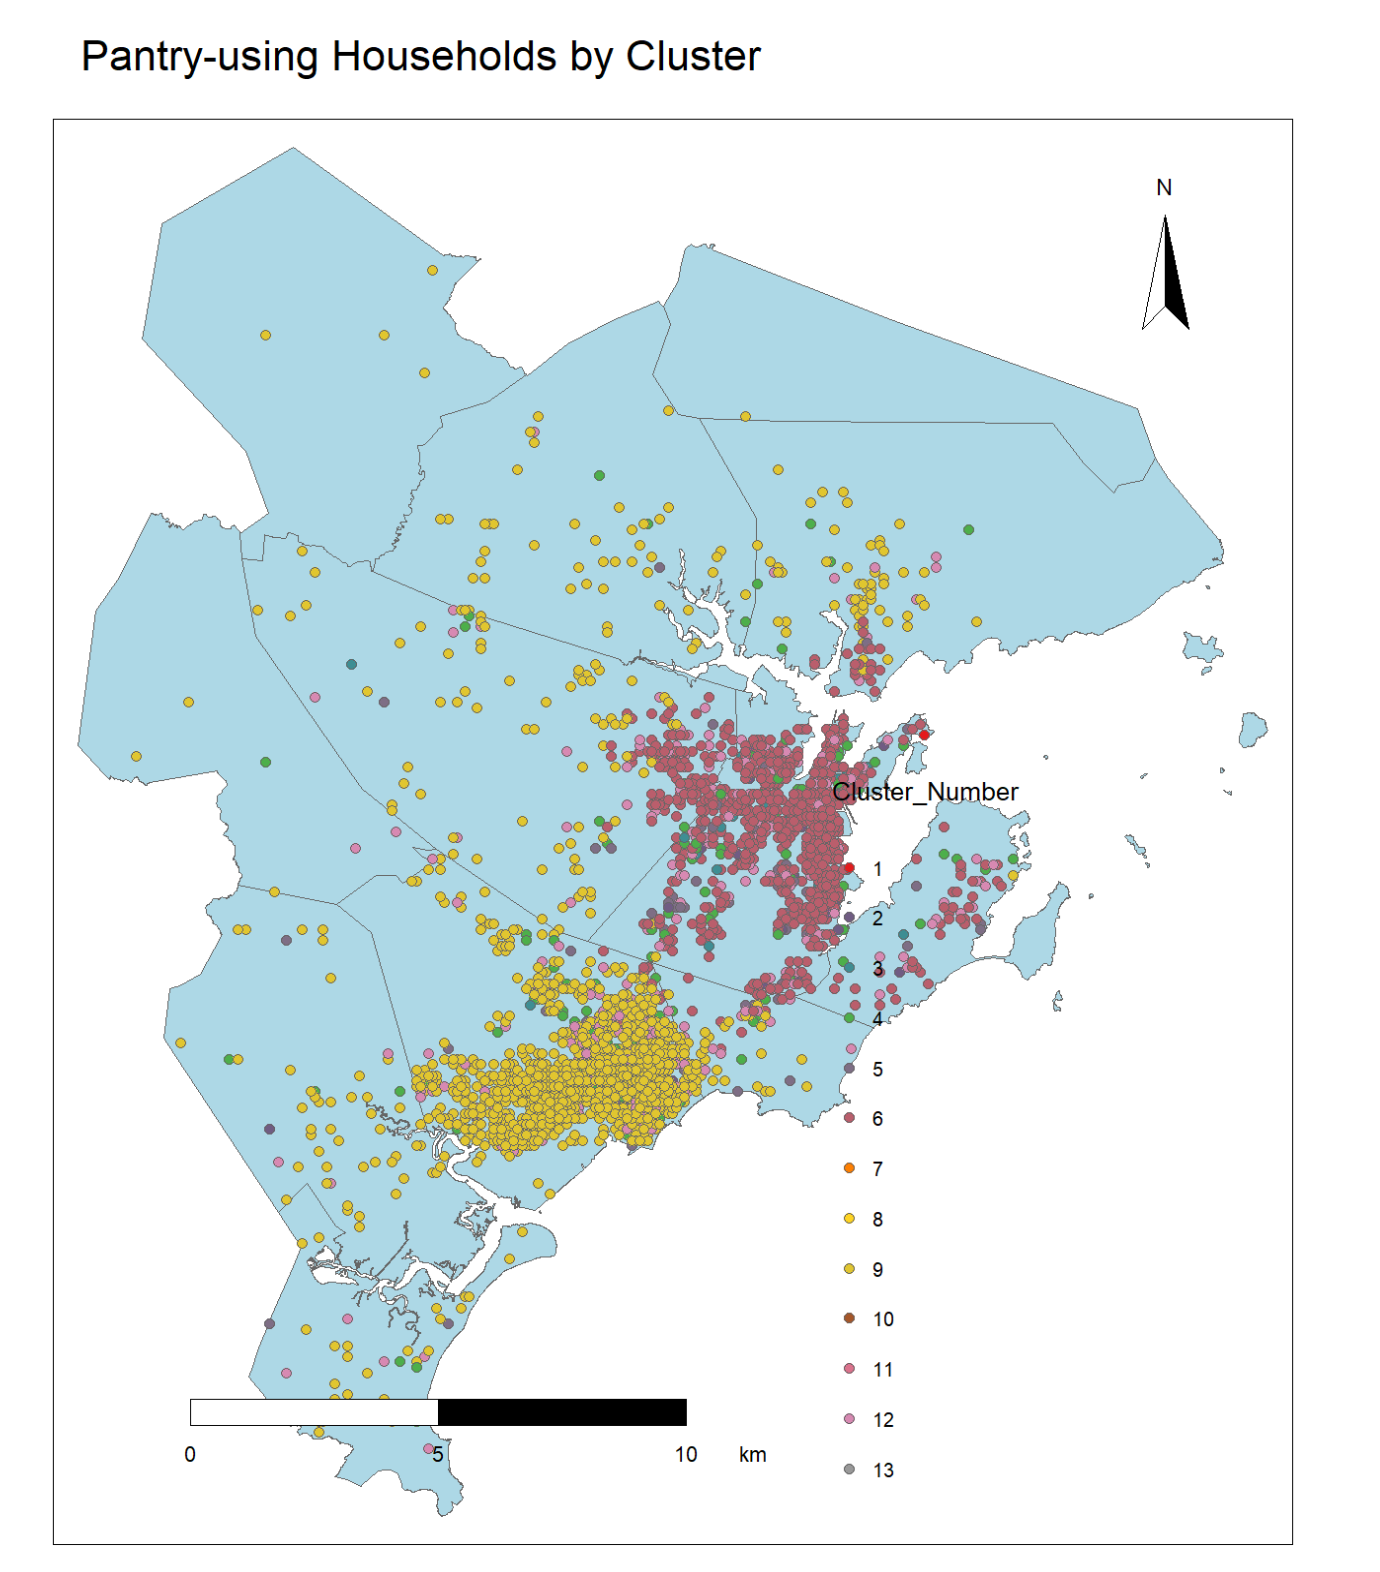
Salem Pantry: Clusters
Salem Pantry: Households by Cluster
Pantry households grouped by socioeconomic cluster.
R
Random Forest
Census ACS
Salem Pantry: Coverage
Salem Pantry: Coverage Gap Analysis
Underserved 'dry zones' in the pantry's coverage.
R
Census ACS
Access

Granite State: Change
Granite State: Concord Multitemporal Change
Where built surfaces replaced vegetation.
Landsat 8/9
Change Detection
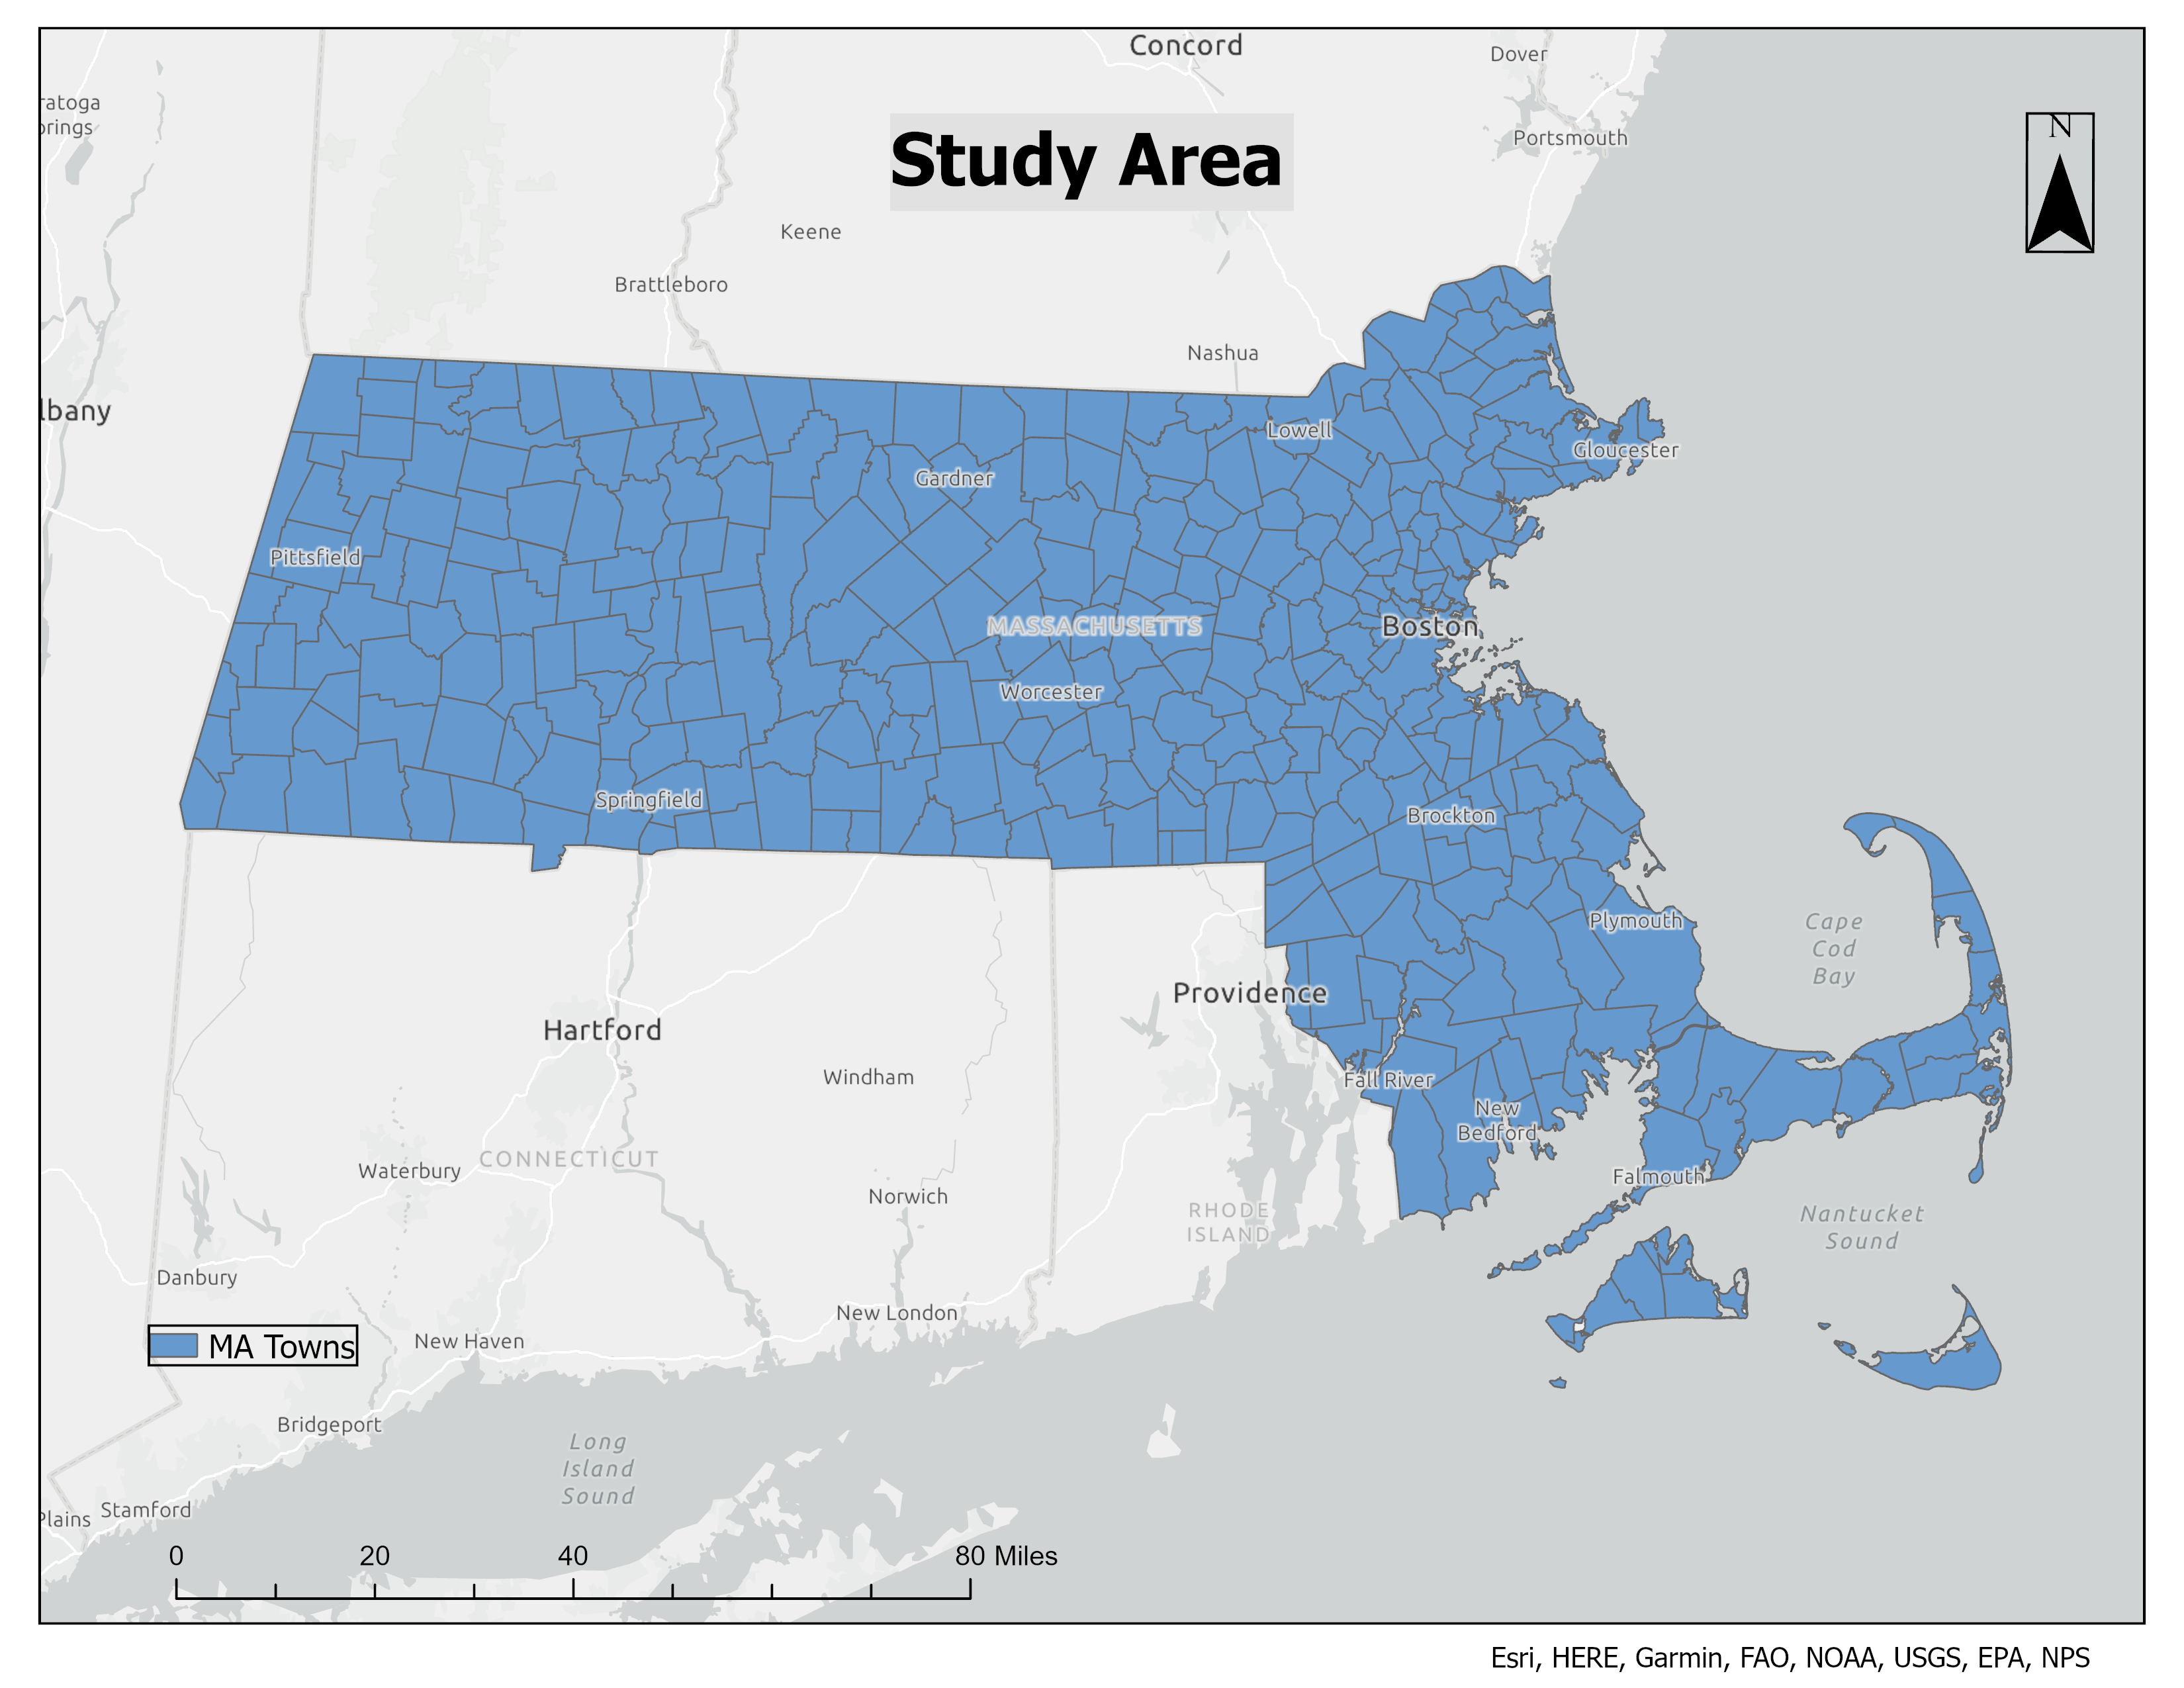
Edu & Wealth: Study Area
Education & Wealth: MA Study Area
Massachusetts municipalities — the study units.
ArcGIS Pro
MassGIS
Edu & Wealth: Income
Education & Wealth: Median Household Income
Median household income by municipality (ACS).
ArcGIS Pro
Census ACS

Edu & Wealth: Bivariate
Education & Wealth: Master's vs Income
Bivariate map of advanced degrees against income.
ArcGIS Pro
Bivariate
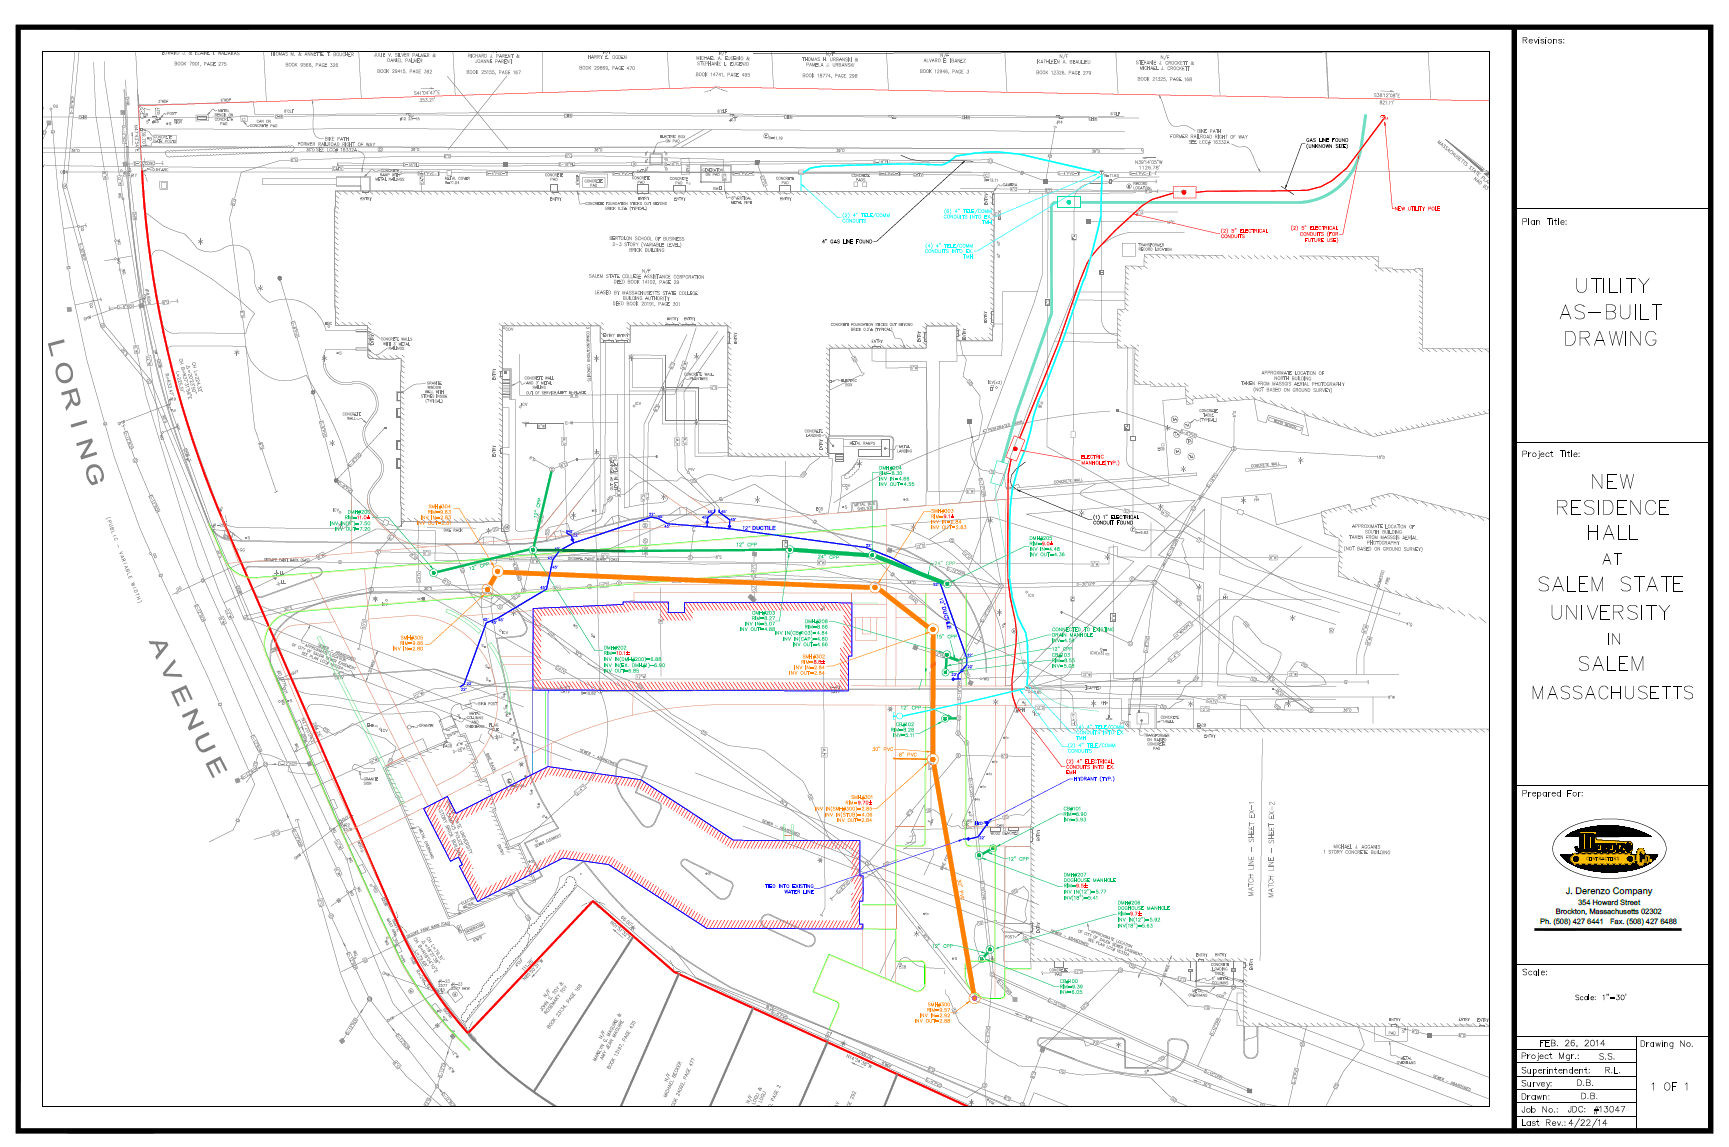
SSU: CAD As-Built
SSU Campus: CAD Utility As-Built
Campus utility as-built drawing in GIS.
CAD
ArcGIS Pro
Survey

SSU: Orthomosaic
SSU Campus: Drone Orthomosaic
Aerial orthomosaic flown over central campus.
Drone
Orthomosaic
UAV
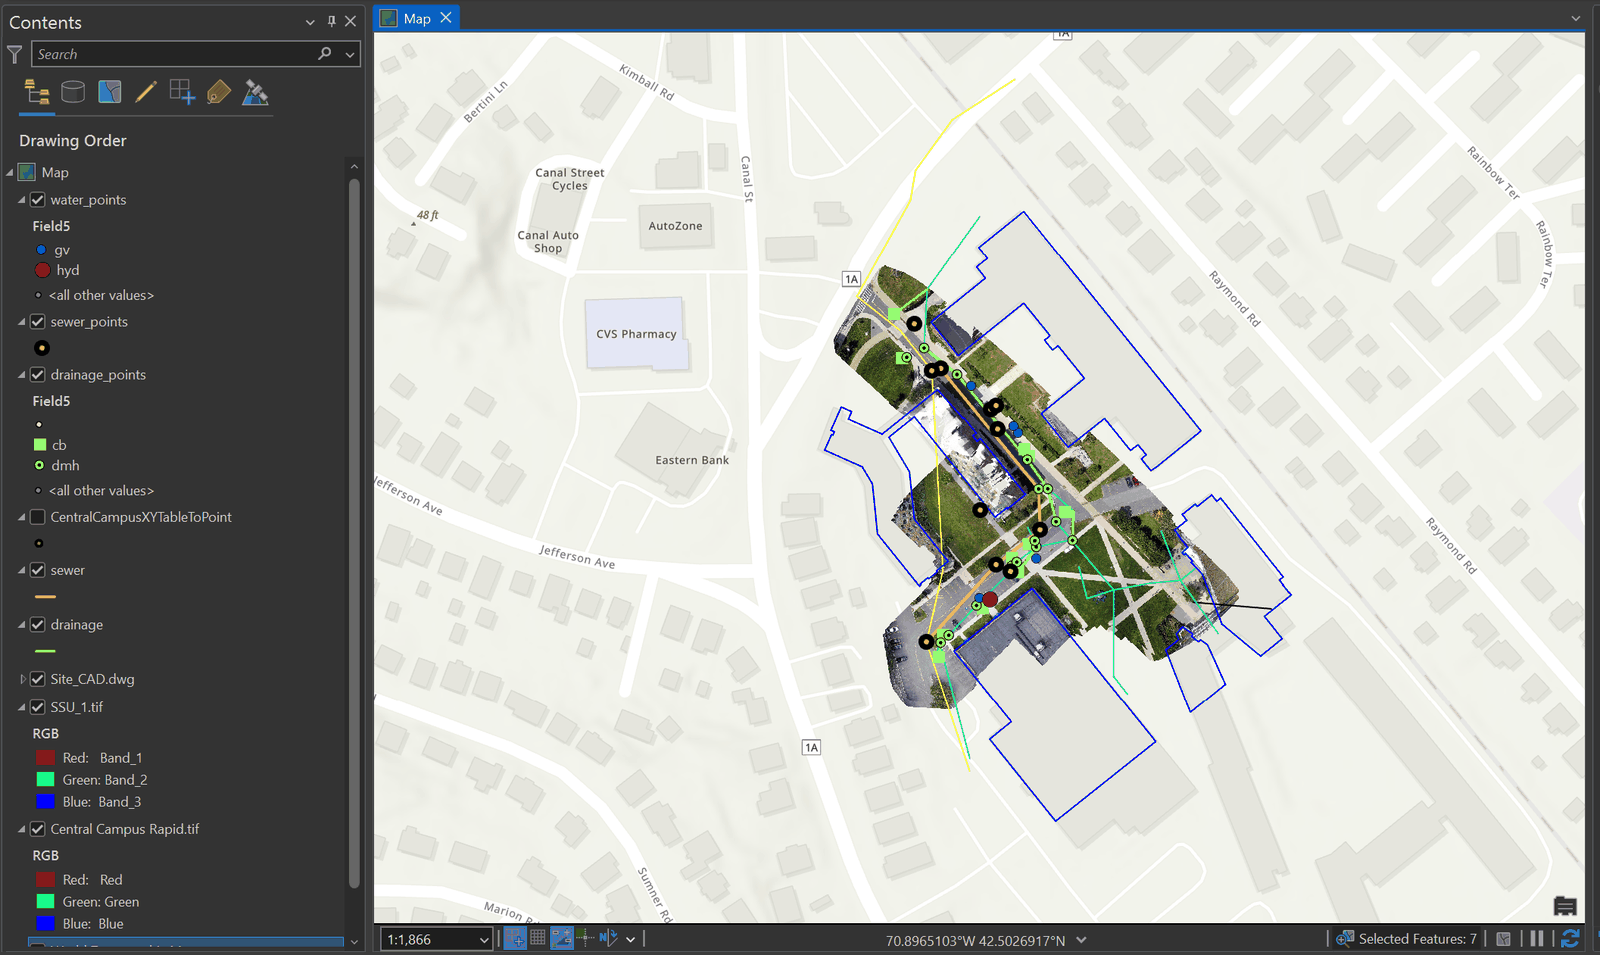
SSU: Drone Overlay
SSU Campus: Drone + CAD Overlay
CAD linework draped over the drone imagery.
Drone
CAD
Trimble GPS
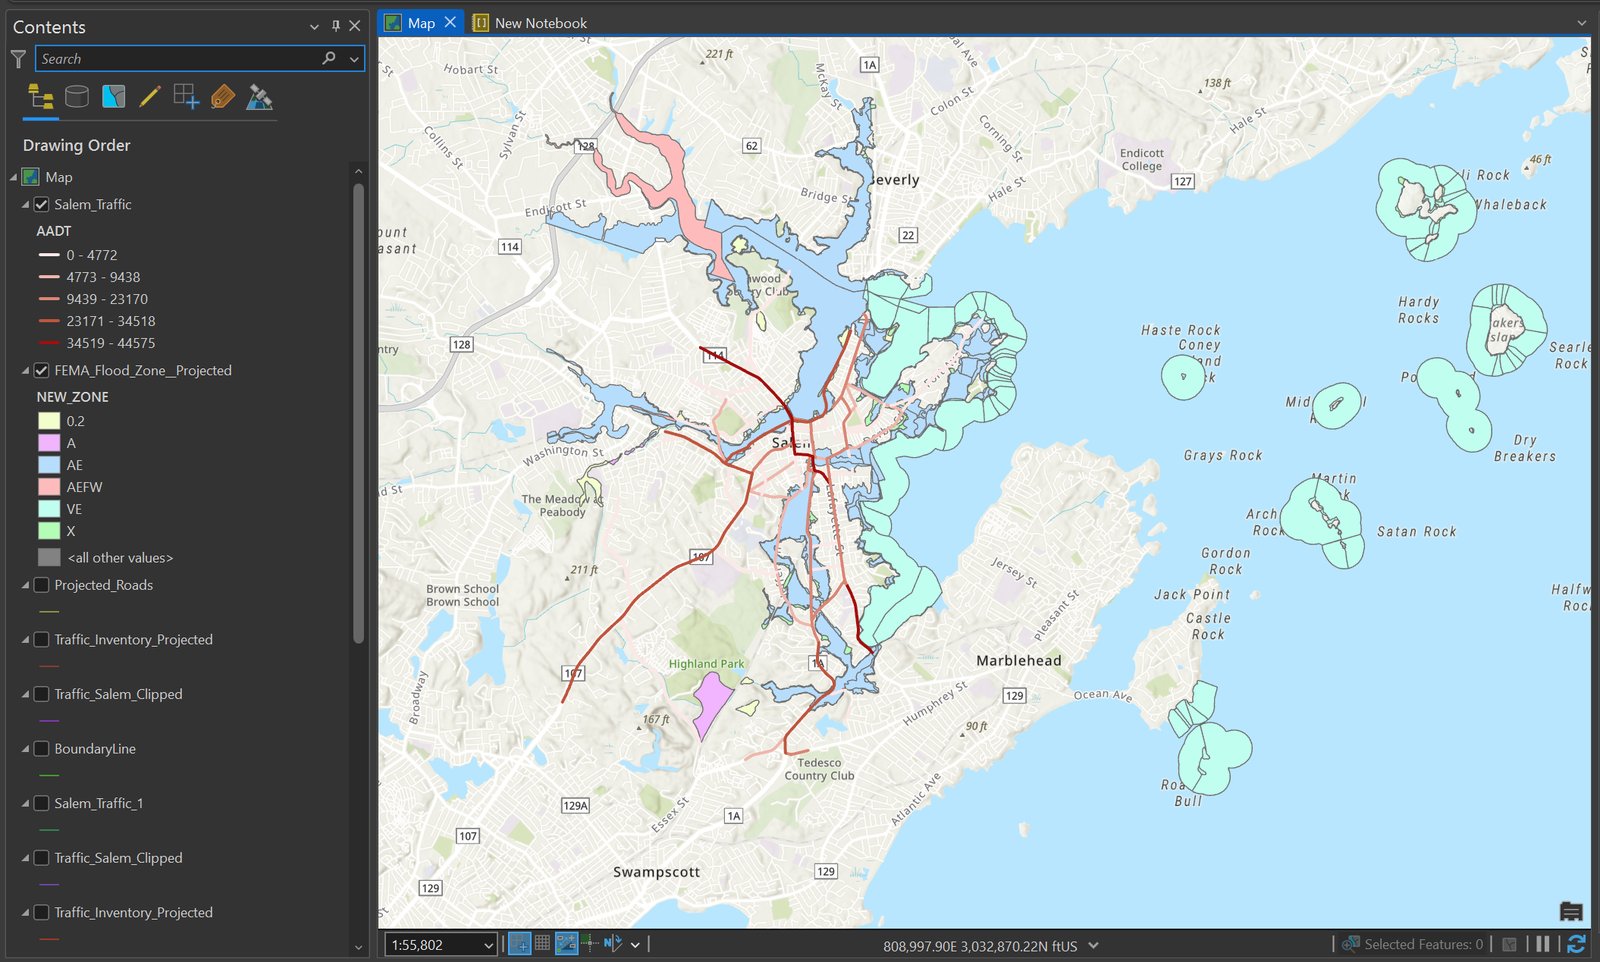
Salem Evac: Flood Network
Salem Evacuation: Flood Zone & Traffic Network
FEMA flood zones weighted against the road network.
Python
arcpy
FEMA